Problem Statement
Mexico City is a rapidly growing urban area, but not all neighborhoods and areas have seen equal levels of development. Some areas may be in need of revitalization, but it can be challenging to identify which section of the city is in need of investment and redevelopment. The data available need cleaning and in some areas is doesn’t exist.
By using graph representation, we can analyze patterns in the city and identify areas that are in need of redevelopment in a more precise manner.
Collection of Data
INEGI is one of Mexico’s autonomous constitutional bodies, managing, coordinating, and identifying the National System of Statistics and Geographic Information, as well as having its own legal personality.
Data from INEGI can be used for decision-making, planning, and research purposes because it is reliable and up-to-date. The agency conducts regular surveys, censuses, and other surveys across Mexico to gather information from households, businesses, and other institutions. Additionally, the agency conducts geospatial mapping and produces official maps.

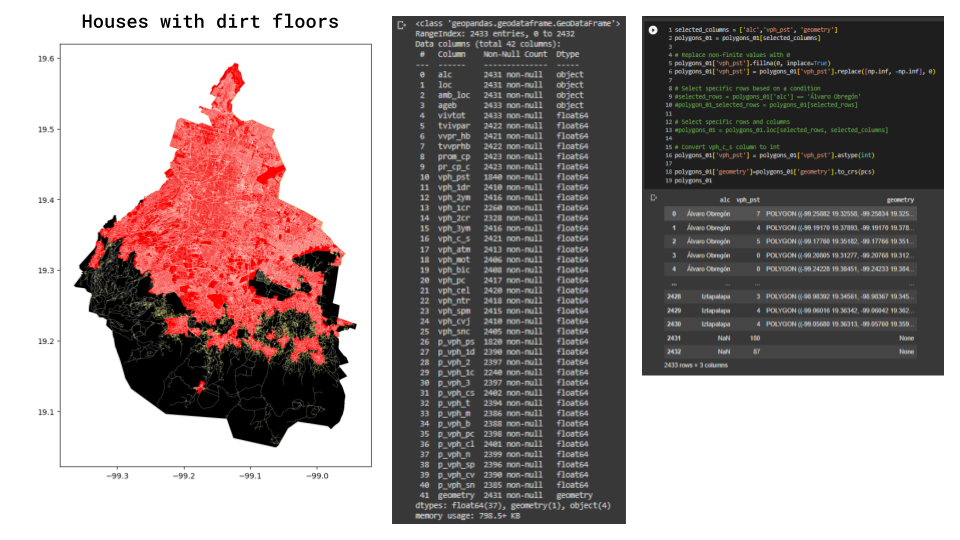
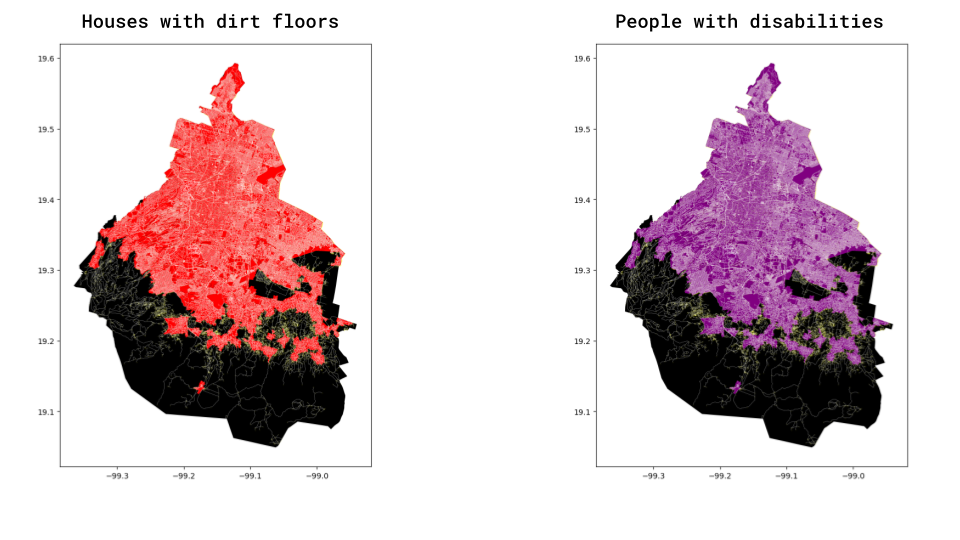
Mexico City Housing
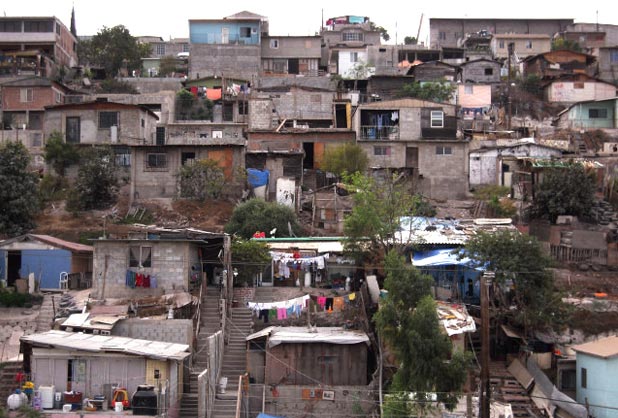
Mexico City alone has 58% of its population living in poverty or vulnerable due to social deprivation, such as health, education, and housing problems.
POPULATION WITH DISABILITIES
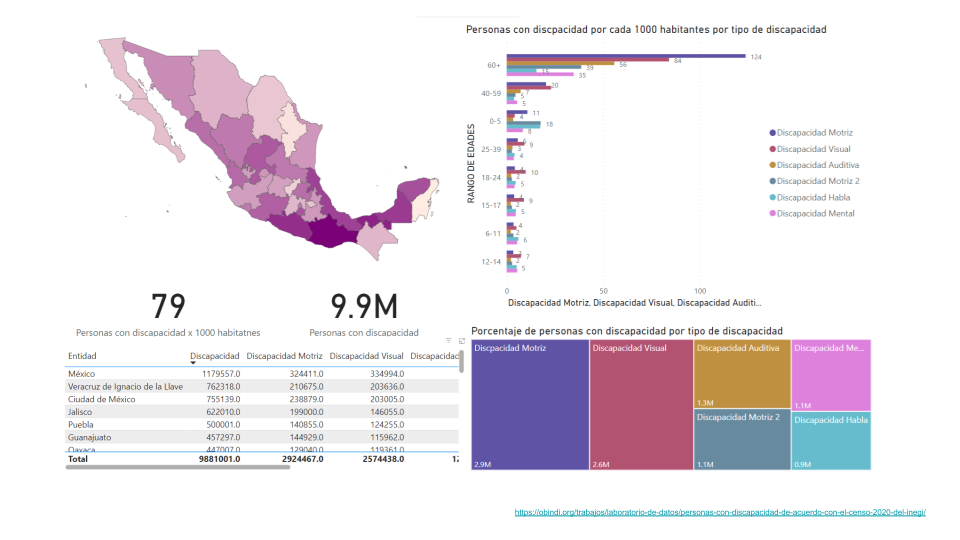

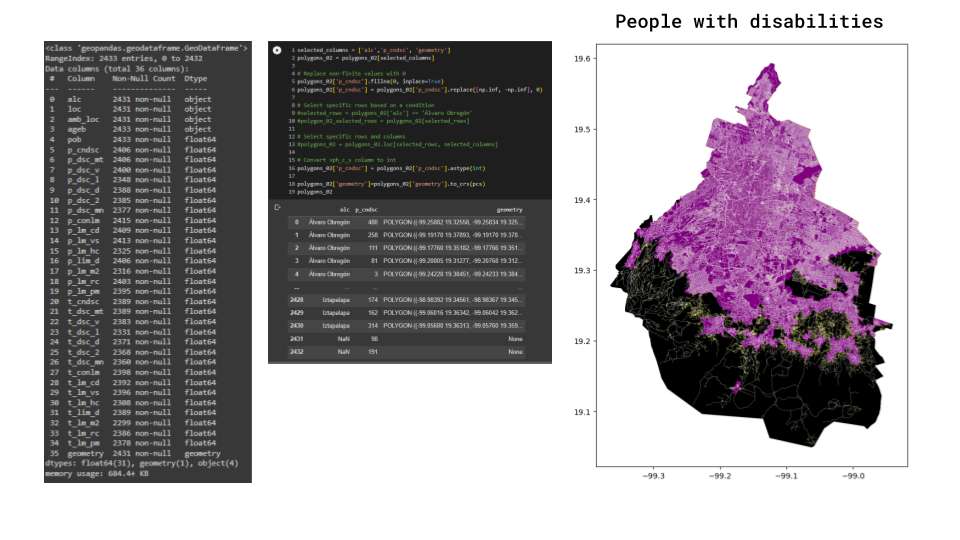
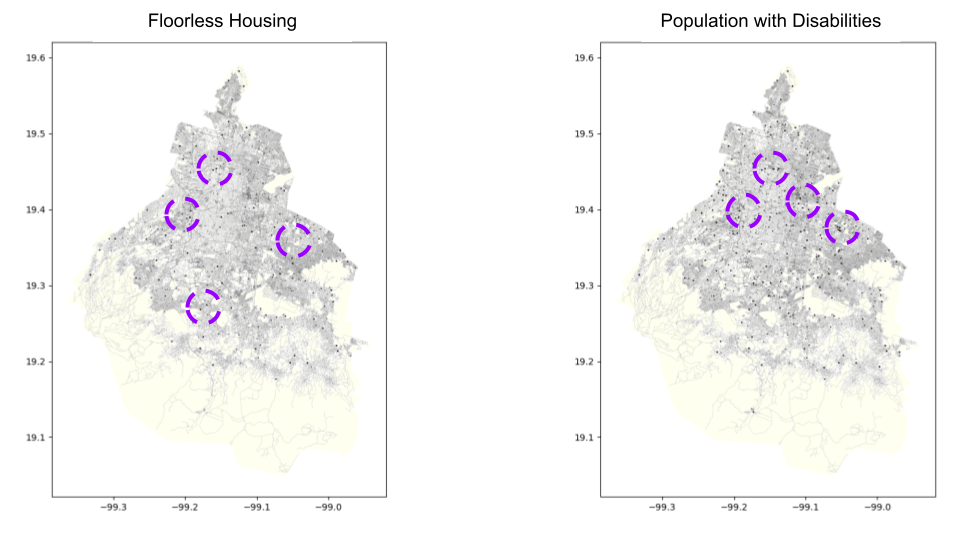
By embedding information in nodes, we can begin to see how we might locate points of interest in particular areas of the city. This is based on information we already have. Efforts should be focused on these aspects in order to be able to analyze them in depth. Knowing what areas are most important can help us to create better plans for infrastructure, safety, and other resources. We can use this data to help us make better decisions for the city’s future. This data can also be used to inform the public about the areas that need the most attention.
FLOOD LEVELS
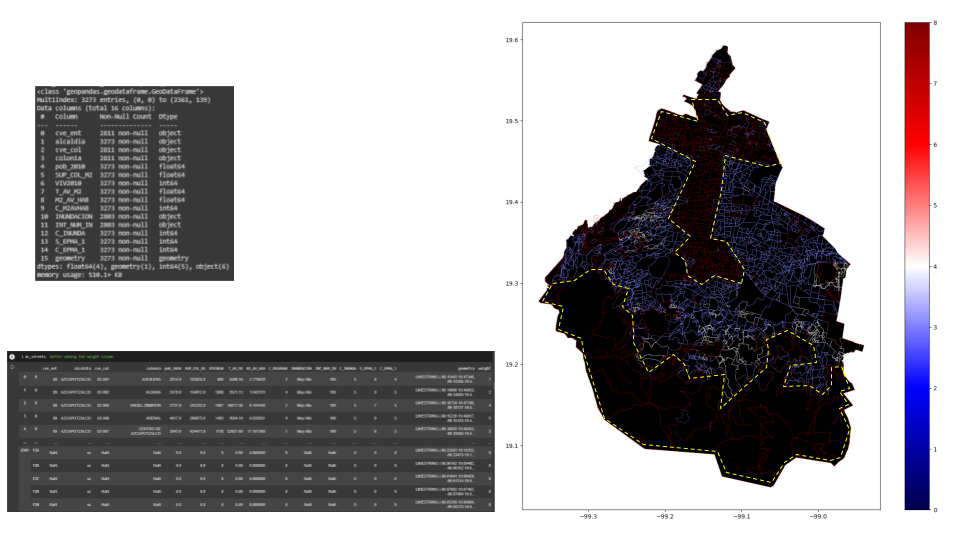
As a result of a database search, we were able to identify areas of the city that were flooded. There has been an extensive area of flooding in the south of the city, and flooding has also been reported in the north and the center of the city as well. Local authorities have been responding to the flooding by providing aid and assistance to those affected. They are also actively working to identify other areas of the city that may be at risk of flooding.
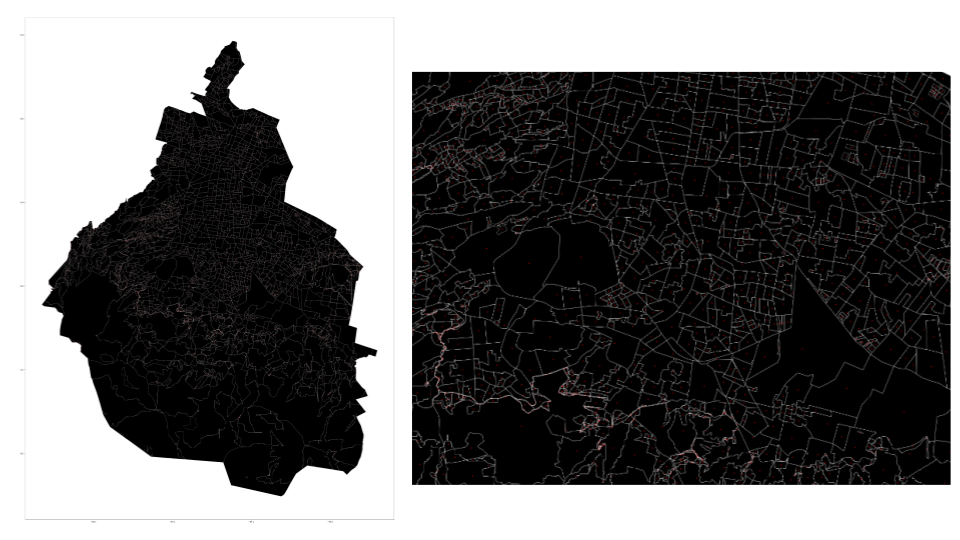
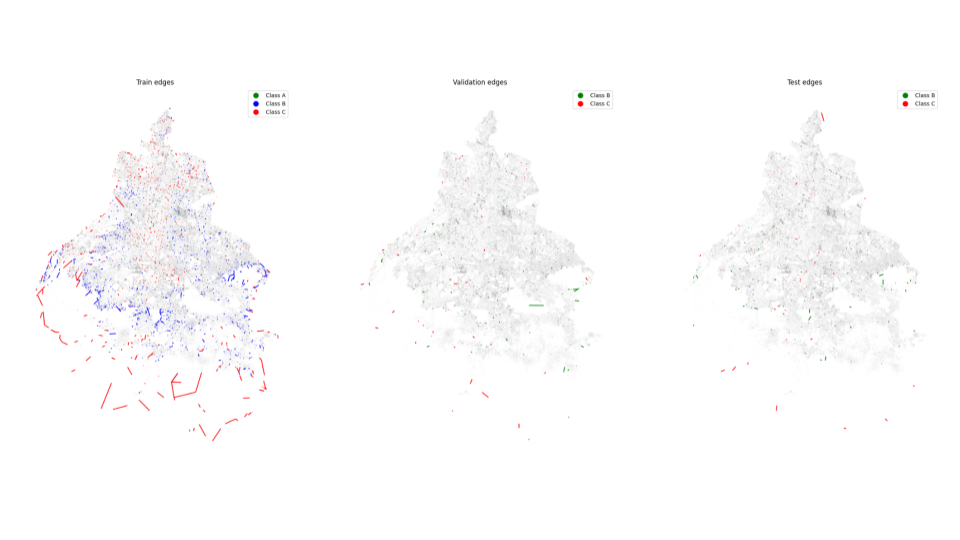
Taking a look at the next image, we can see that the edges are classified according to their edges. Due to the location of the database, the vast majority of the edges are null due to the lack of data in the database.
As a result of these classifications, we are able to separate the information for training purposes.