
Embarking on a journey through the dynamic realm of computational design, we’ve delved into the exciting world of interactive web application development. Along the way, we’ve not only grasped the tools and processes but also unraveled the core concepts driving innovation in this space.
From harnessing the power of data and geometry on the web to modernizing development workflows, we’ve opened doors to collaboration and innovation. But our exploration didn’t stop there. We’ve ventured into the convergence of design, computation, and accessibility, paving the way for groundbreaking creations.

Introducing SolarAlign, an app designed to revolutionize decision-making in solar farm development. With SolarAlign, you hold the reins to informed choices regarding panel placement and sizing, ultimately maximizing the efficiency of your solar farm. Witness the mesmerizing spectacle as our app dynamically illustrates how solar panels adjust their orientation to capture the optimal angle of sunlight. By tracking solar panel efficiency based on size, SolarAlign ensures peak performance output.
A solar farm isn’t just an array of photovoltaic panels; it’s a powerhouse of renewable energy. It absorbs sunlight, converts it into electricity, and feeds it into the grid for consumption by discerning customers like you.
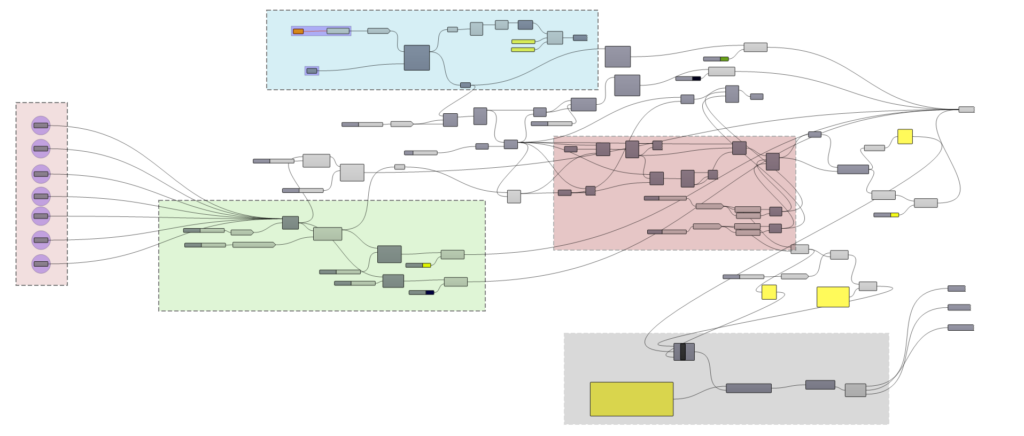
So, how does SolarAlign work its magic? It all begins with a Grasshopper file. Imagine diving into the script, where the pink box represents cities pivotal to our task. The blue signifies importing the model for terrain analysis, while the green box simulates the sun’s path based on the selected city, indicating the hour. The red delineates solar panel dimensions and spacing, while the grey box imparts specific panel information.
To validate our script, we turned to Hops, providing inputs and scrutinizing outputs. These inputs and outputs lay the groundwork for the coding phase in Visual Code, ensuring a seamless transition from concept to execution.
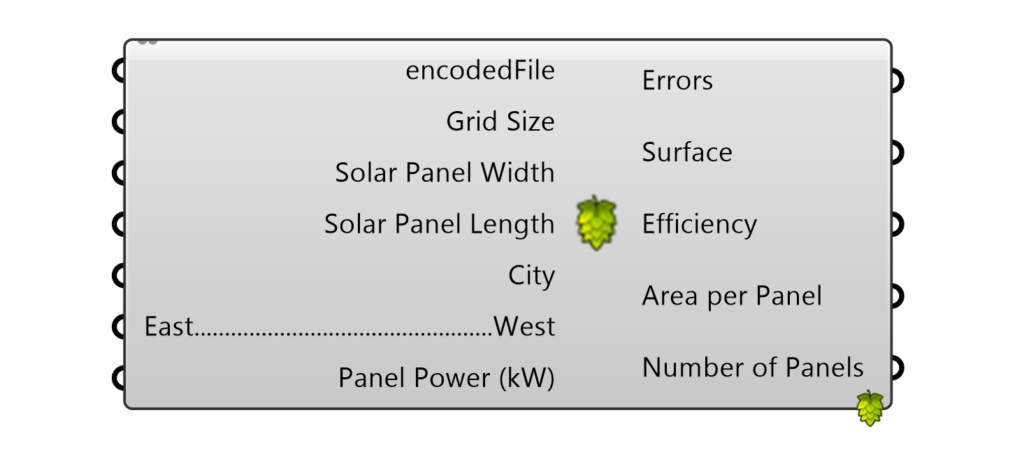
Inputs
Lets go one by one of the inputs that were used:
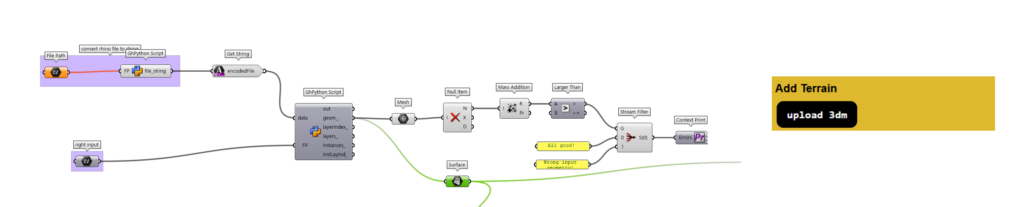
a. Terrain
Elevating interactivity, I’ve incorporated an element allowing the upload of 3D files from Grasshopper.
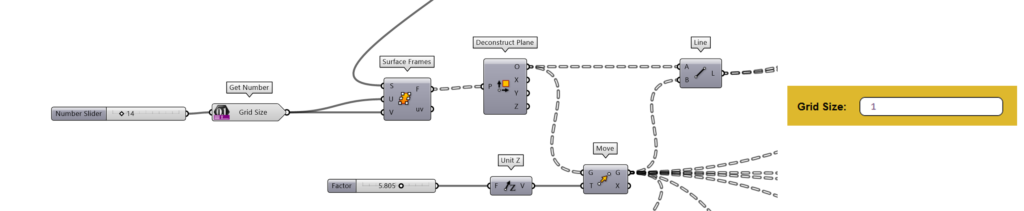
b. Grid Size
Specify the grid size of the terrain used in the app. This parameter affects solar panel placement and sizing decisions.
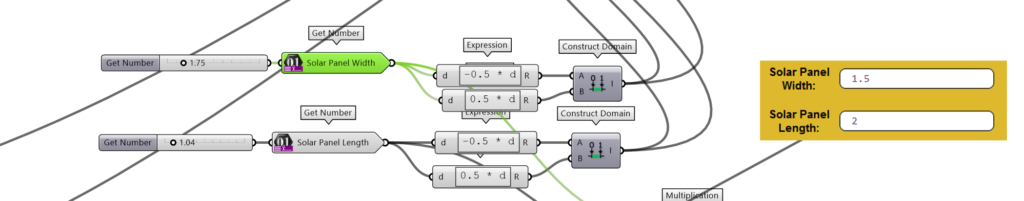
c. Solar Panel Dimensions
Customize the width and length dimensions of the solar panels used in the app. This would depends on the manufacturer and the efficiency we want to achieve.
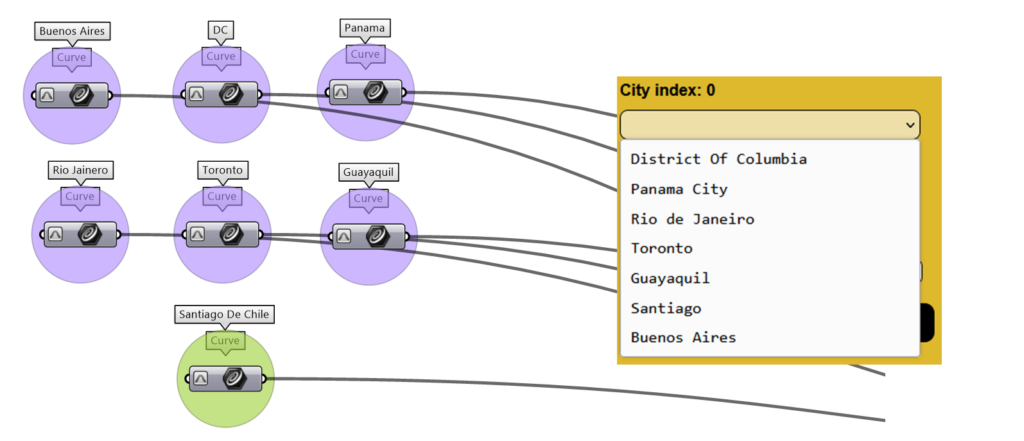
d. City Location
Specify the city location for which the solar farm is being designed.
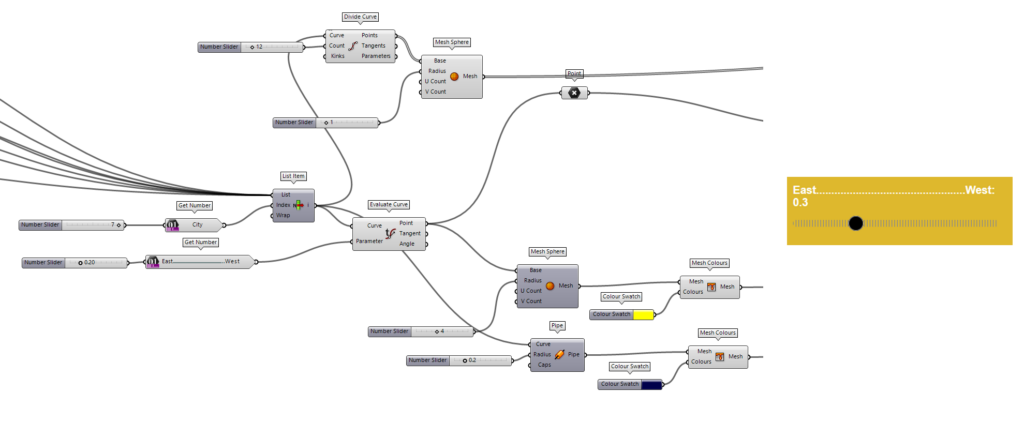
e. Time of Day
Showcase the app’s ability to simulate different times of the day and how solar panel orientation changes accordingly. Also added some visualization element to able to see the sun location during the day.
f. Panel Power
This input is based on the information of manufacture of the panel, its given by them. This would affect the efficiency of the each panel.
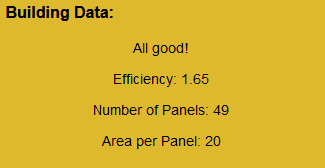
Building Data
To have a better idea of the information provided, I also created a section where we can see a summary of the app data. It will help the user understand their project and see where it can improve.
Conclusion
In conclusion, our exploration of digital tools for cloud-based data management has been nothing short of transformative. From conceptualizing the intersection of design, computation, and accessibility to bringing our vision to life with SolarAlign, we’ve embarked on a journey of innovation and discovery.
But let’s not just talk about it; let’s see SolarAlign in action. This video is the final presentation and a live demo of the app.
In this demo, you’ll witness the seamless integration of data and design as SolarAlign empowers users to make informed decisions about solar panel placement and sizing. With just a few clicks, users can upload their terrain data, specify panel dimensions, select their city location, and simulate different times of the day to optimize solar panel orientation. Watch as SolarAlign dynamically adjusts solar panel angles to maximize energy absorption, ensuring peak performance throughout the day. With intuitive visualization tools and comprehensive building data analysis, users can gain valuable insights into their solar farm projects, unlocking new possibilities for efficiency and sustainability.
