
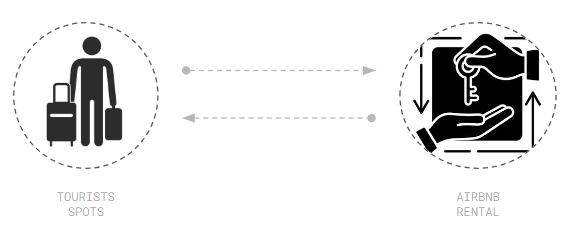
Our goal was to predict the relationship between the tourist activity zones and the airbnb rentals.
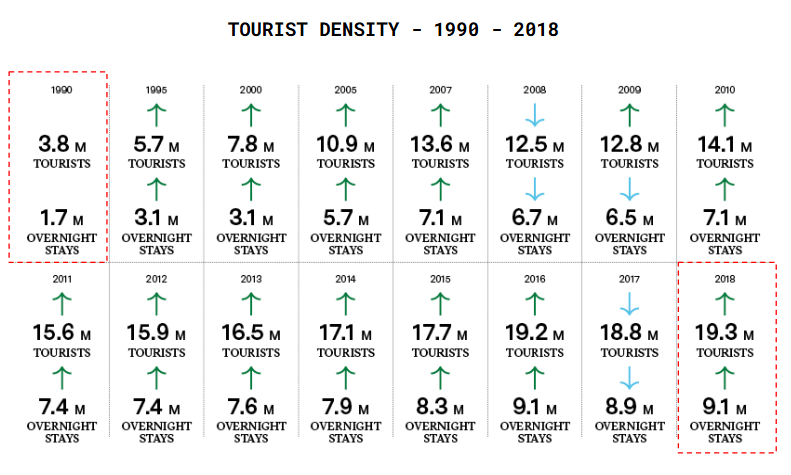
Tourism is vital to Spain’s economic growth, with Barcelona as a key contributor, accounting for over 12% of the country’s GDP.
TOURIST ANALYSIS AND DATA
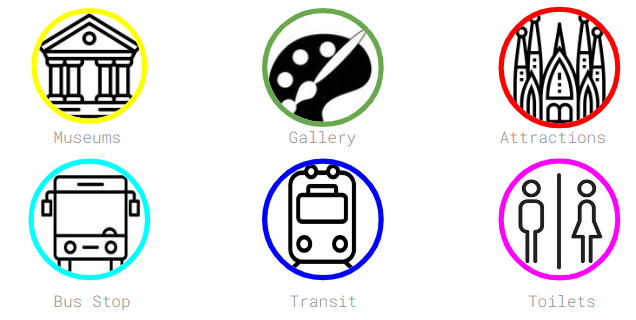
Tourist spots and zones can be broadly classified to tourist amenities – transits, bus stops, toilets and other tourist spots – where museums, galleries and attraction come into play in a given city. To understand the range of airbnb we looked into hostels, luxury hotels, motels and apartments


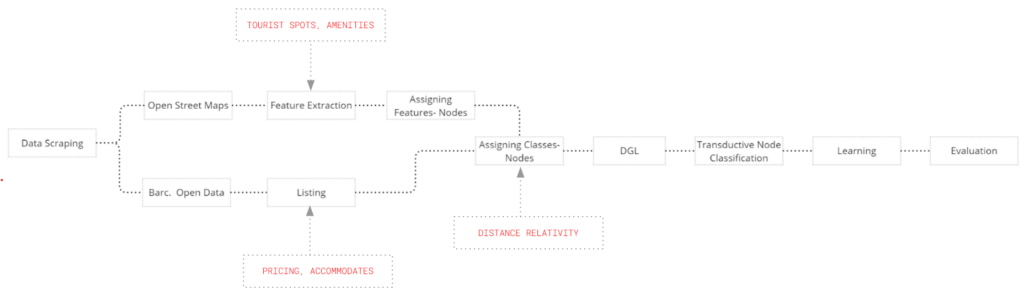
WORKFLOW
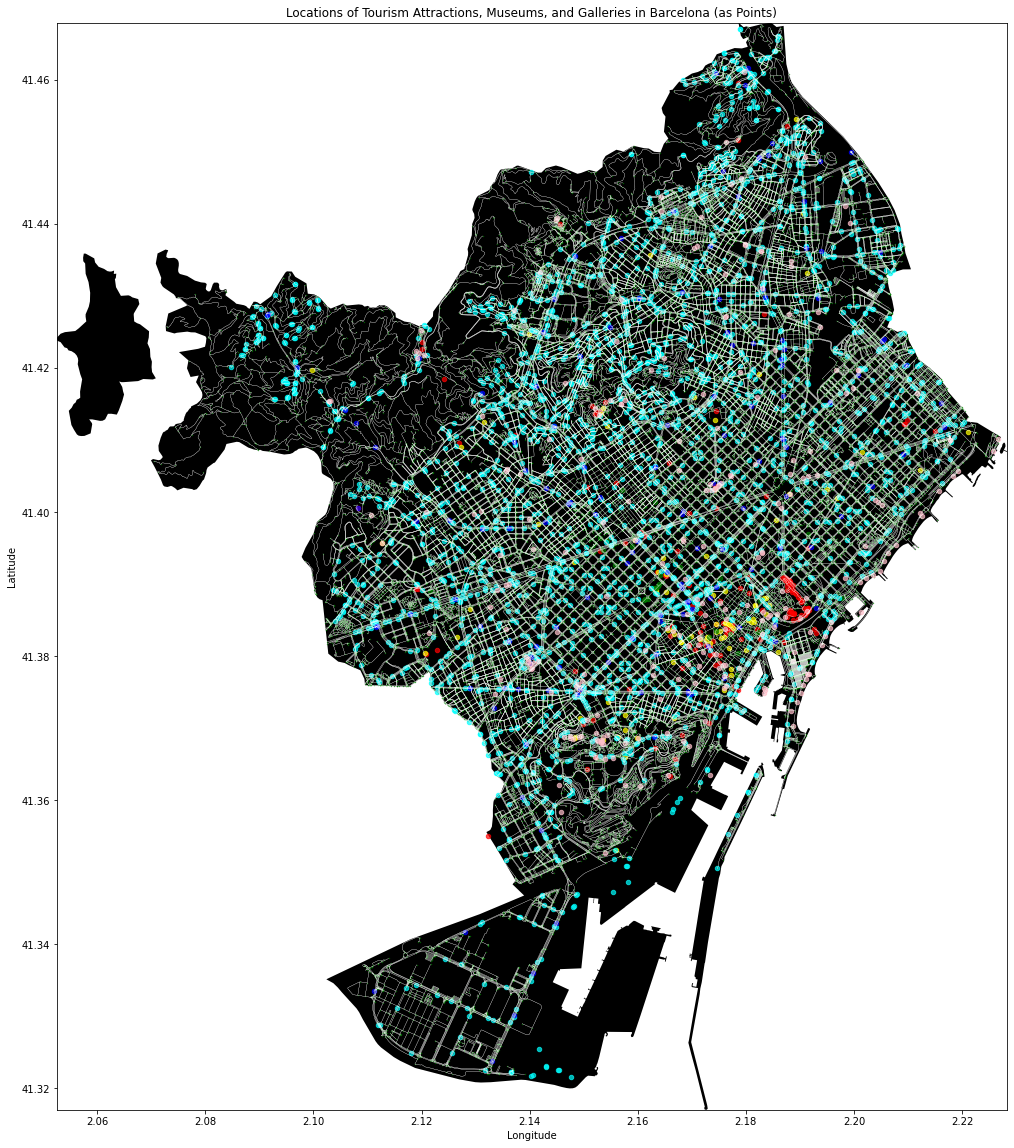
OSM DATA FOR TOURIST FEATURES
The tourist features, were extracted from the open street maps, and all the information was assigned to nearest node.
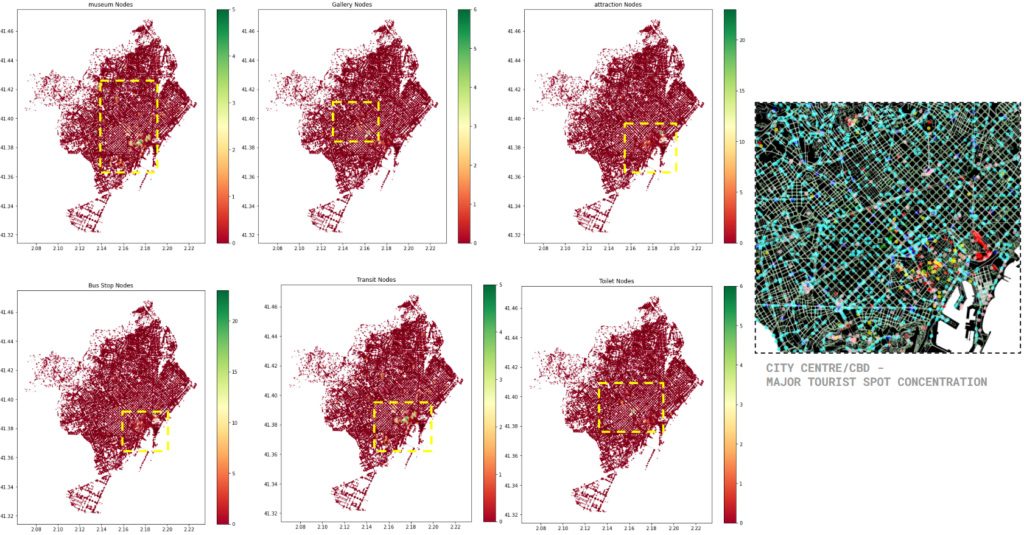
NODE FEATURES – DENSITY ANALYSIS
The density analysis of these 6 features – patterns of higher density is seen around the CBD area, and similar to all the features
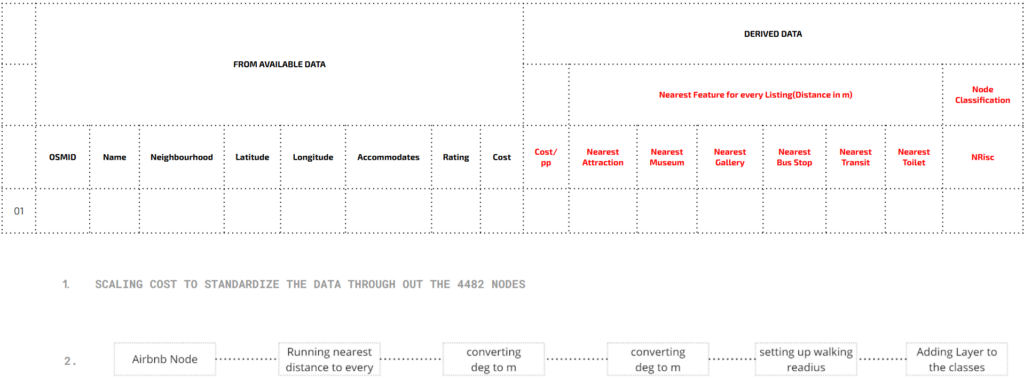
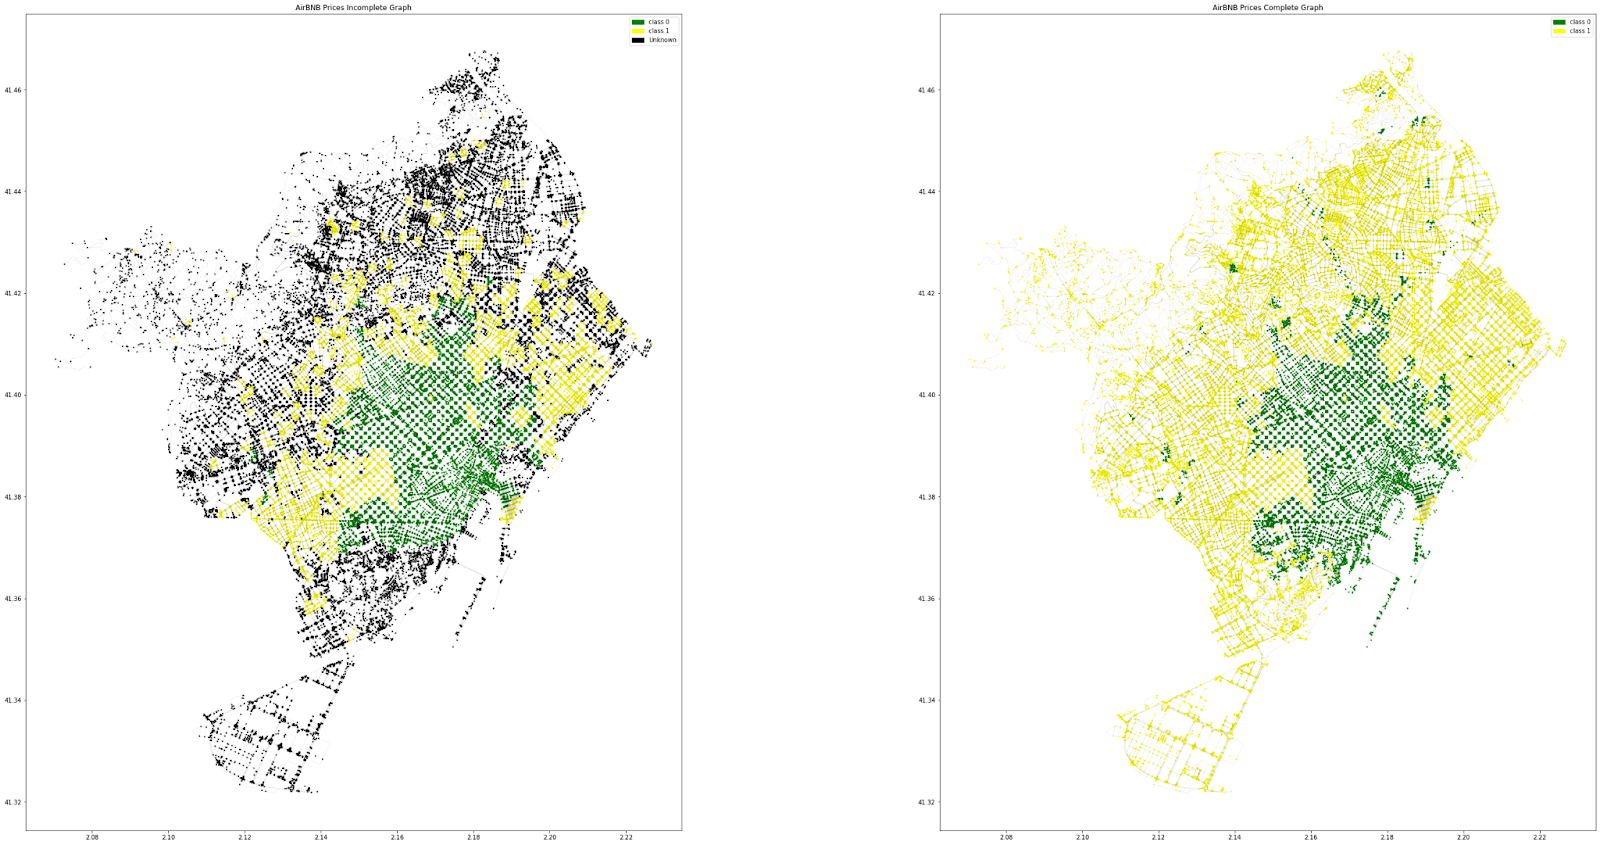
DATA SAMPLER – LISTINGS – BARCELONA OPEN DATA
The data set had effective information about the listings- their cost and accommodates. Later the dataset was enriched with the help of osm data to calculate the distance for the each feature. And then based on the pricing the node was classified to a certain range.
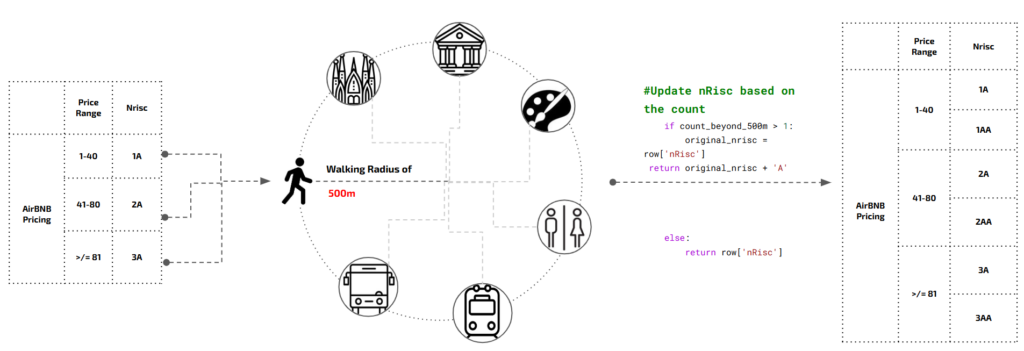
NODE CLASSIFICATION
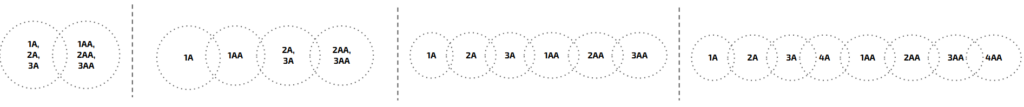
This classified price range was further enriched by establishing a walking radius of 500m. And even if more than one feature was beyond the walking distance then it was assigned a new subclass. Hence every price range is now divided to two classes each. Further through permutations- it was divided to 2,4,6,8, overall classes to run different tests
DGL GRAPHS
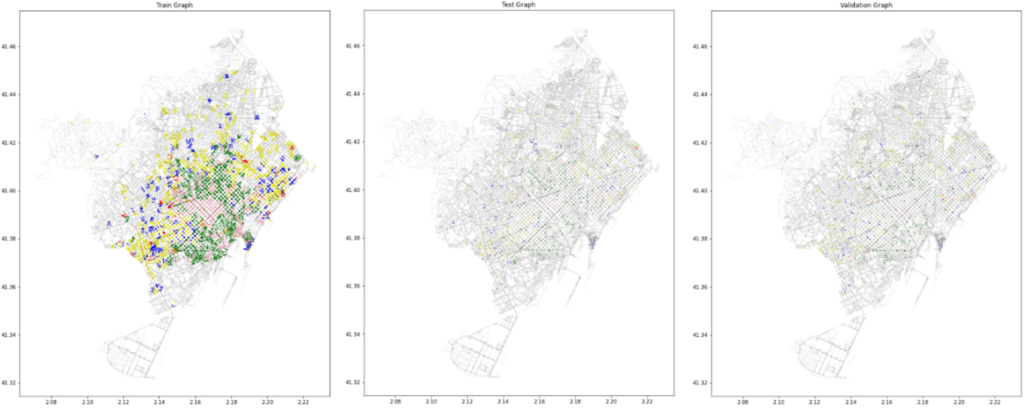
DGL GRAPHS – TRAIN, TEST AND VALIDATION
The known 4482 nodes were further divided into training, testing and validation and masked accordingly in the given ratio
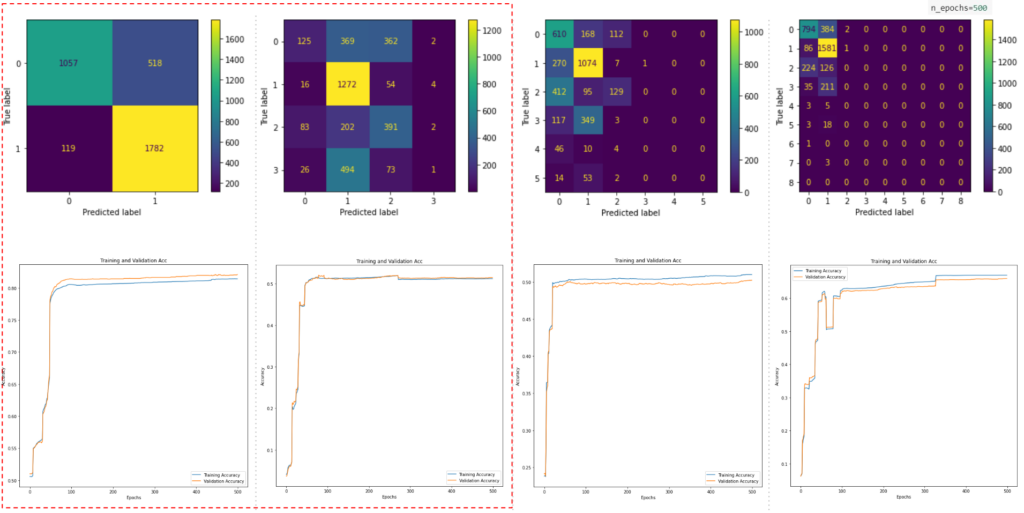
TESTING – 2,4,6,8 CLASSES
We ran training for 2,4,6,8 classes in a 500 epoch model with 4 hidden layers, And noticed that the model with 2 and 4 classes performed better, in terms of node distribution and smoother curves and better accuracy level as shown in the plot.
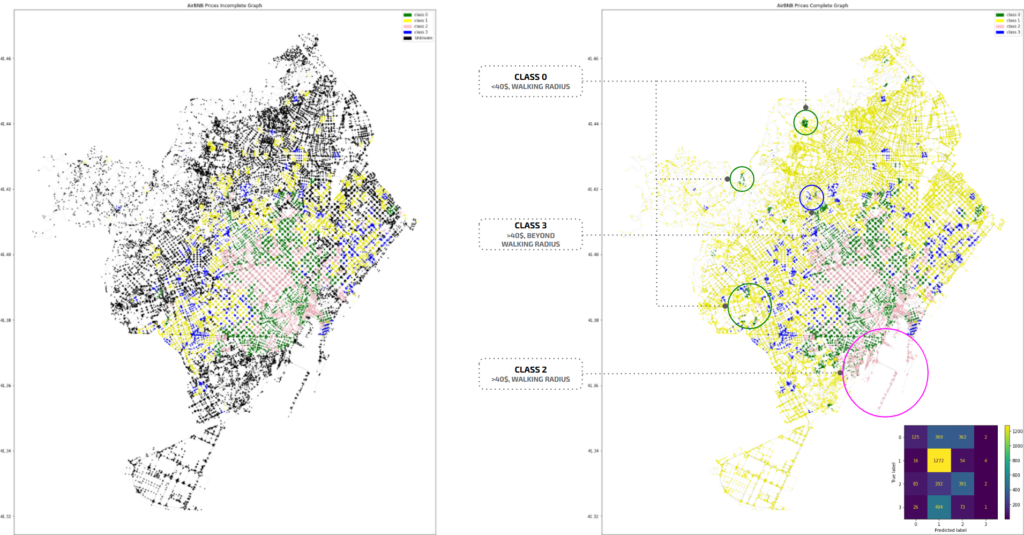
TESTING – 2 CLASSES
-All the nodes are broadly classified. WHICH IS Not very useful for a in depth ml exercise.
TESTING – 4 CLASSES
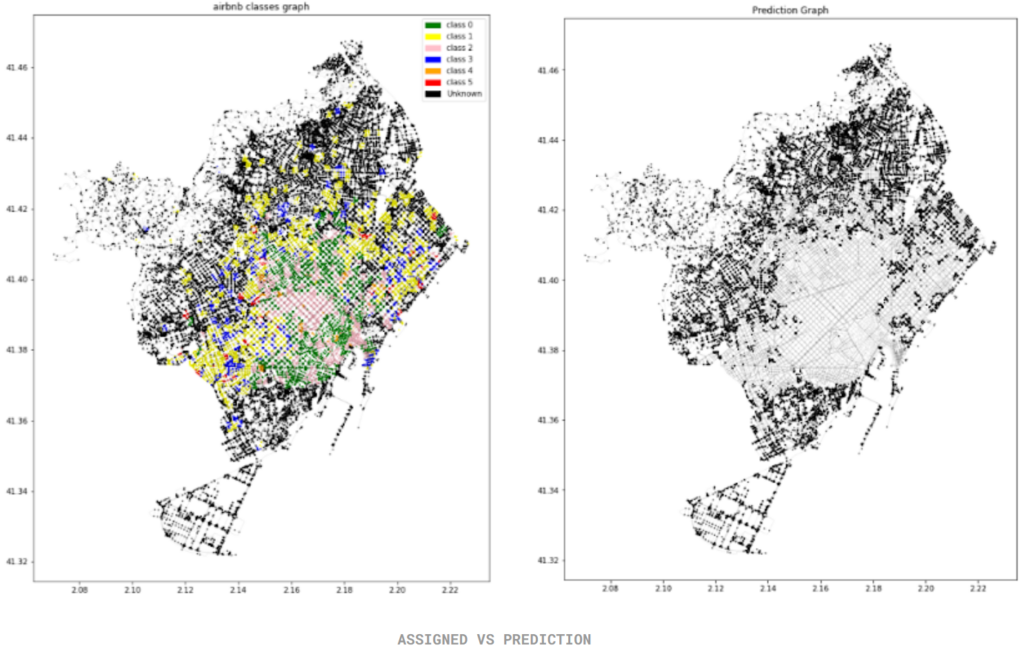
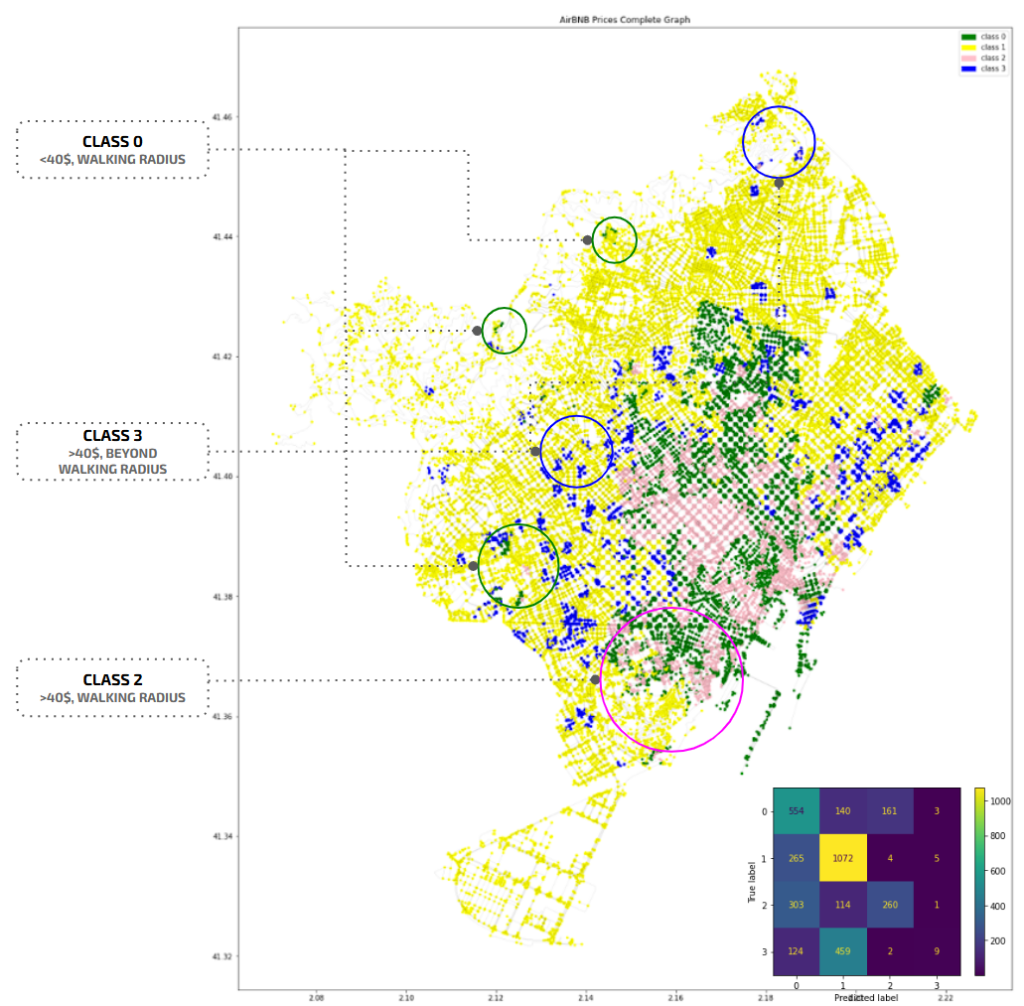
Testing against four classes: most nodes fall under class 1. Classification into class 0 is based on surrounding known nodes, while class 2 applies to the CBD area with prices above $40.
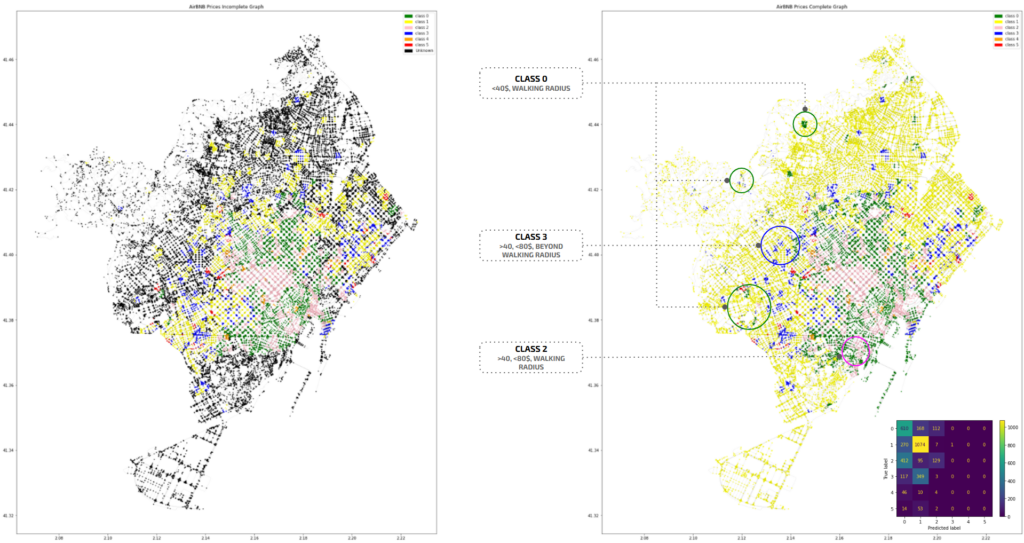
TESTING – 6 CLASSES
we see similar classification as the prediction for 4 classes, and little to no nodes assigned for 3,4,5 classes.
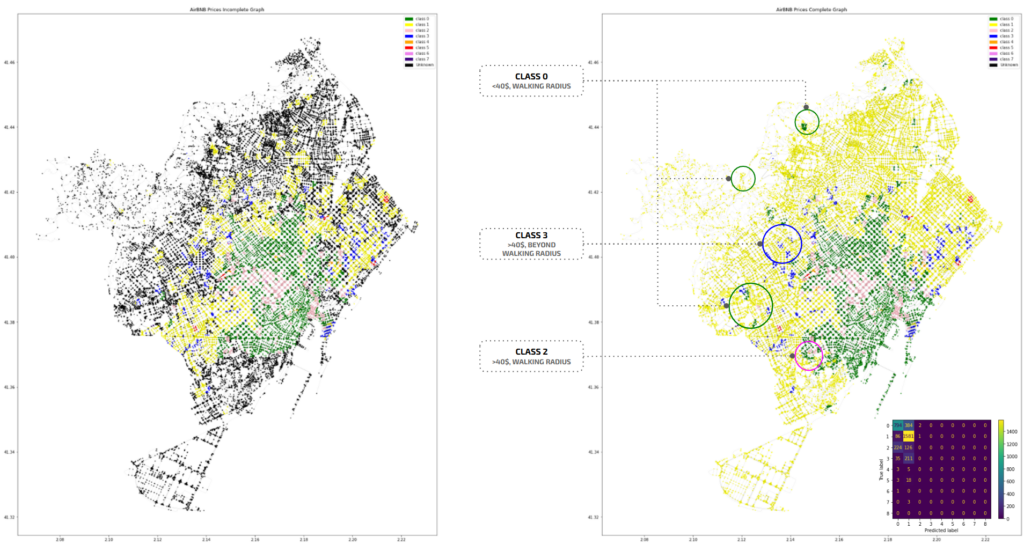
TESTING – 8 CLASSES
we see similar classification as the prediction for 6 classes, and no nodes assigned for 3 – 7 classes.
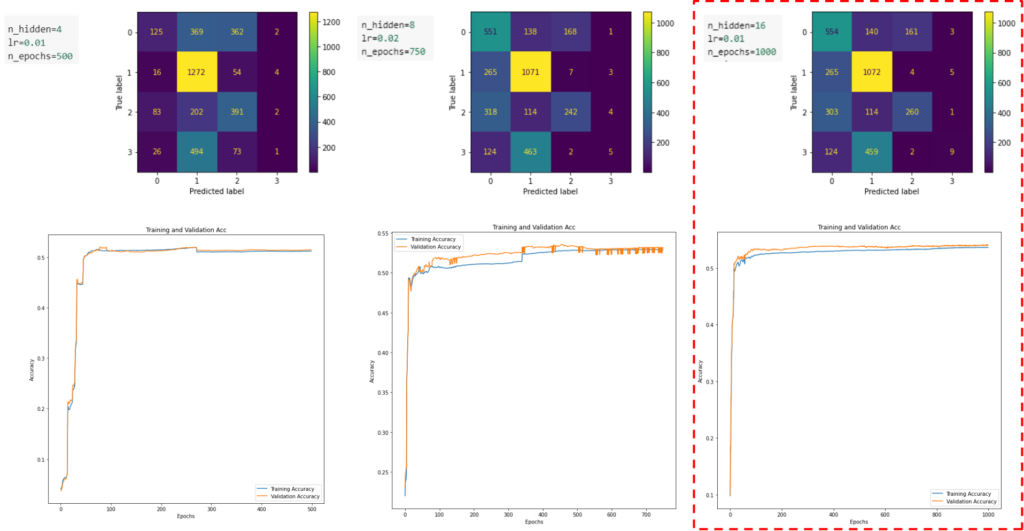
TESTING – 4 CLASSES, VARIED HYPER PARAMETERS
AS CLASSIFICATION FOR 4 NODES WAS BETTER – 3 TESTS WERE RUN CHANGING THE HYPERPARAMETERS. THE MODEL WITH 16 HIDDEN LAYERS AND 1000 EPOCHS PERFORMED THE BEST. BASED ON THE OVERALL DISTRIBUTION OF THE NODES AND THE SMOOTHNESS OF THE CURVE WHICH MEANS LESS VARIANCE AND BETTER ACCURACY.
CONCLUSION
AIRBNB REAL ESTATE:
– We can clearly state that AirBNB pricing is linked to proximity to tourist attractions and amenities, with class 2 concentrated around the CBD, and class 3, in a similar price range, near the beaches, which wasn’t included in our features
GRAPH ML:
- The more distributed the features are the better the prediction
- Balancing the classes, and a well distribution of data among these classes perform better.
- Bigger node bounding box methods will result in better model training.
