
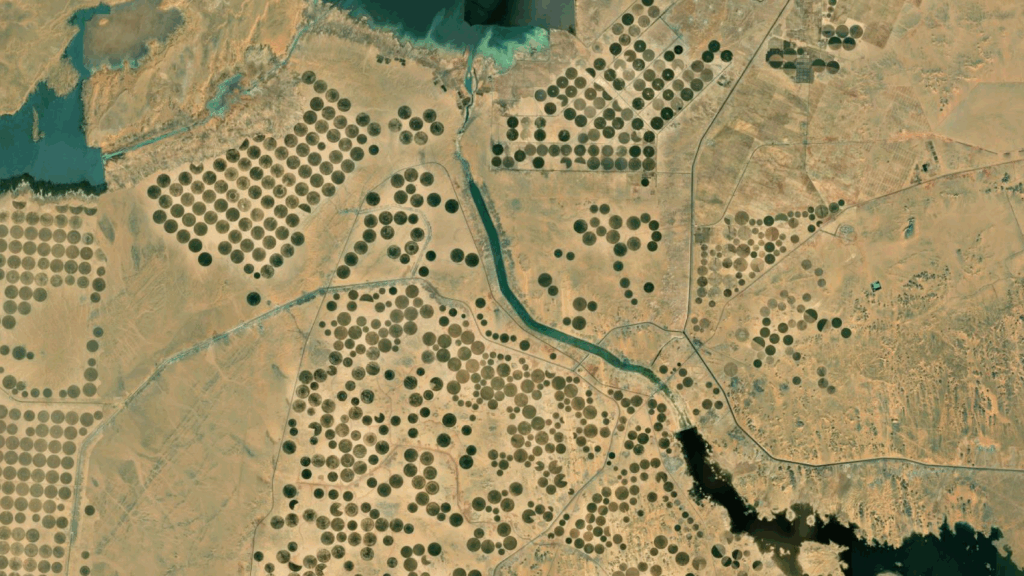
This research began with one of the most basic human motivation: curiosity. Looking at satellite imagery, we noticed strange, perfect green circles along the desert landscape. What are they? Why are they there? And what do they mean?
Along this blogpost, key concepts will be explained , along to the reason of why we choose our region of interest, the methodology created, and finally the insights of the analysis with the final output.
Large Scale Land Acquisition Network
These circular patterns are the result of extensive agricultural practices. Beyond their striking appearance from above, they represent a complex network of power tied to industrial farming and large-scale land acquisitions.
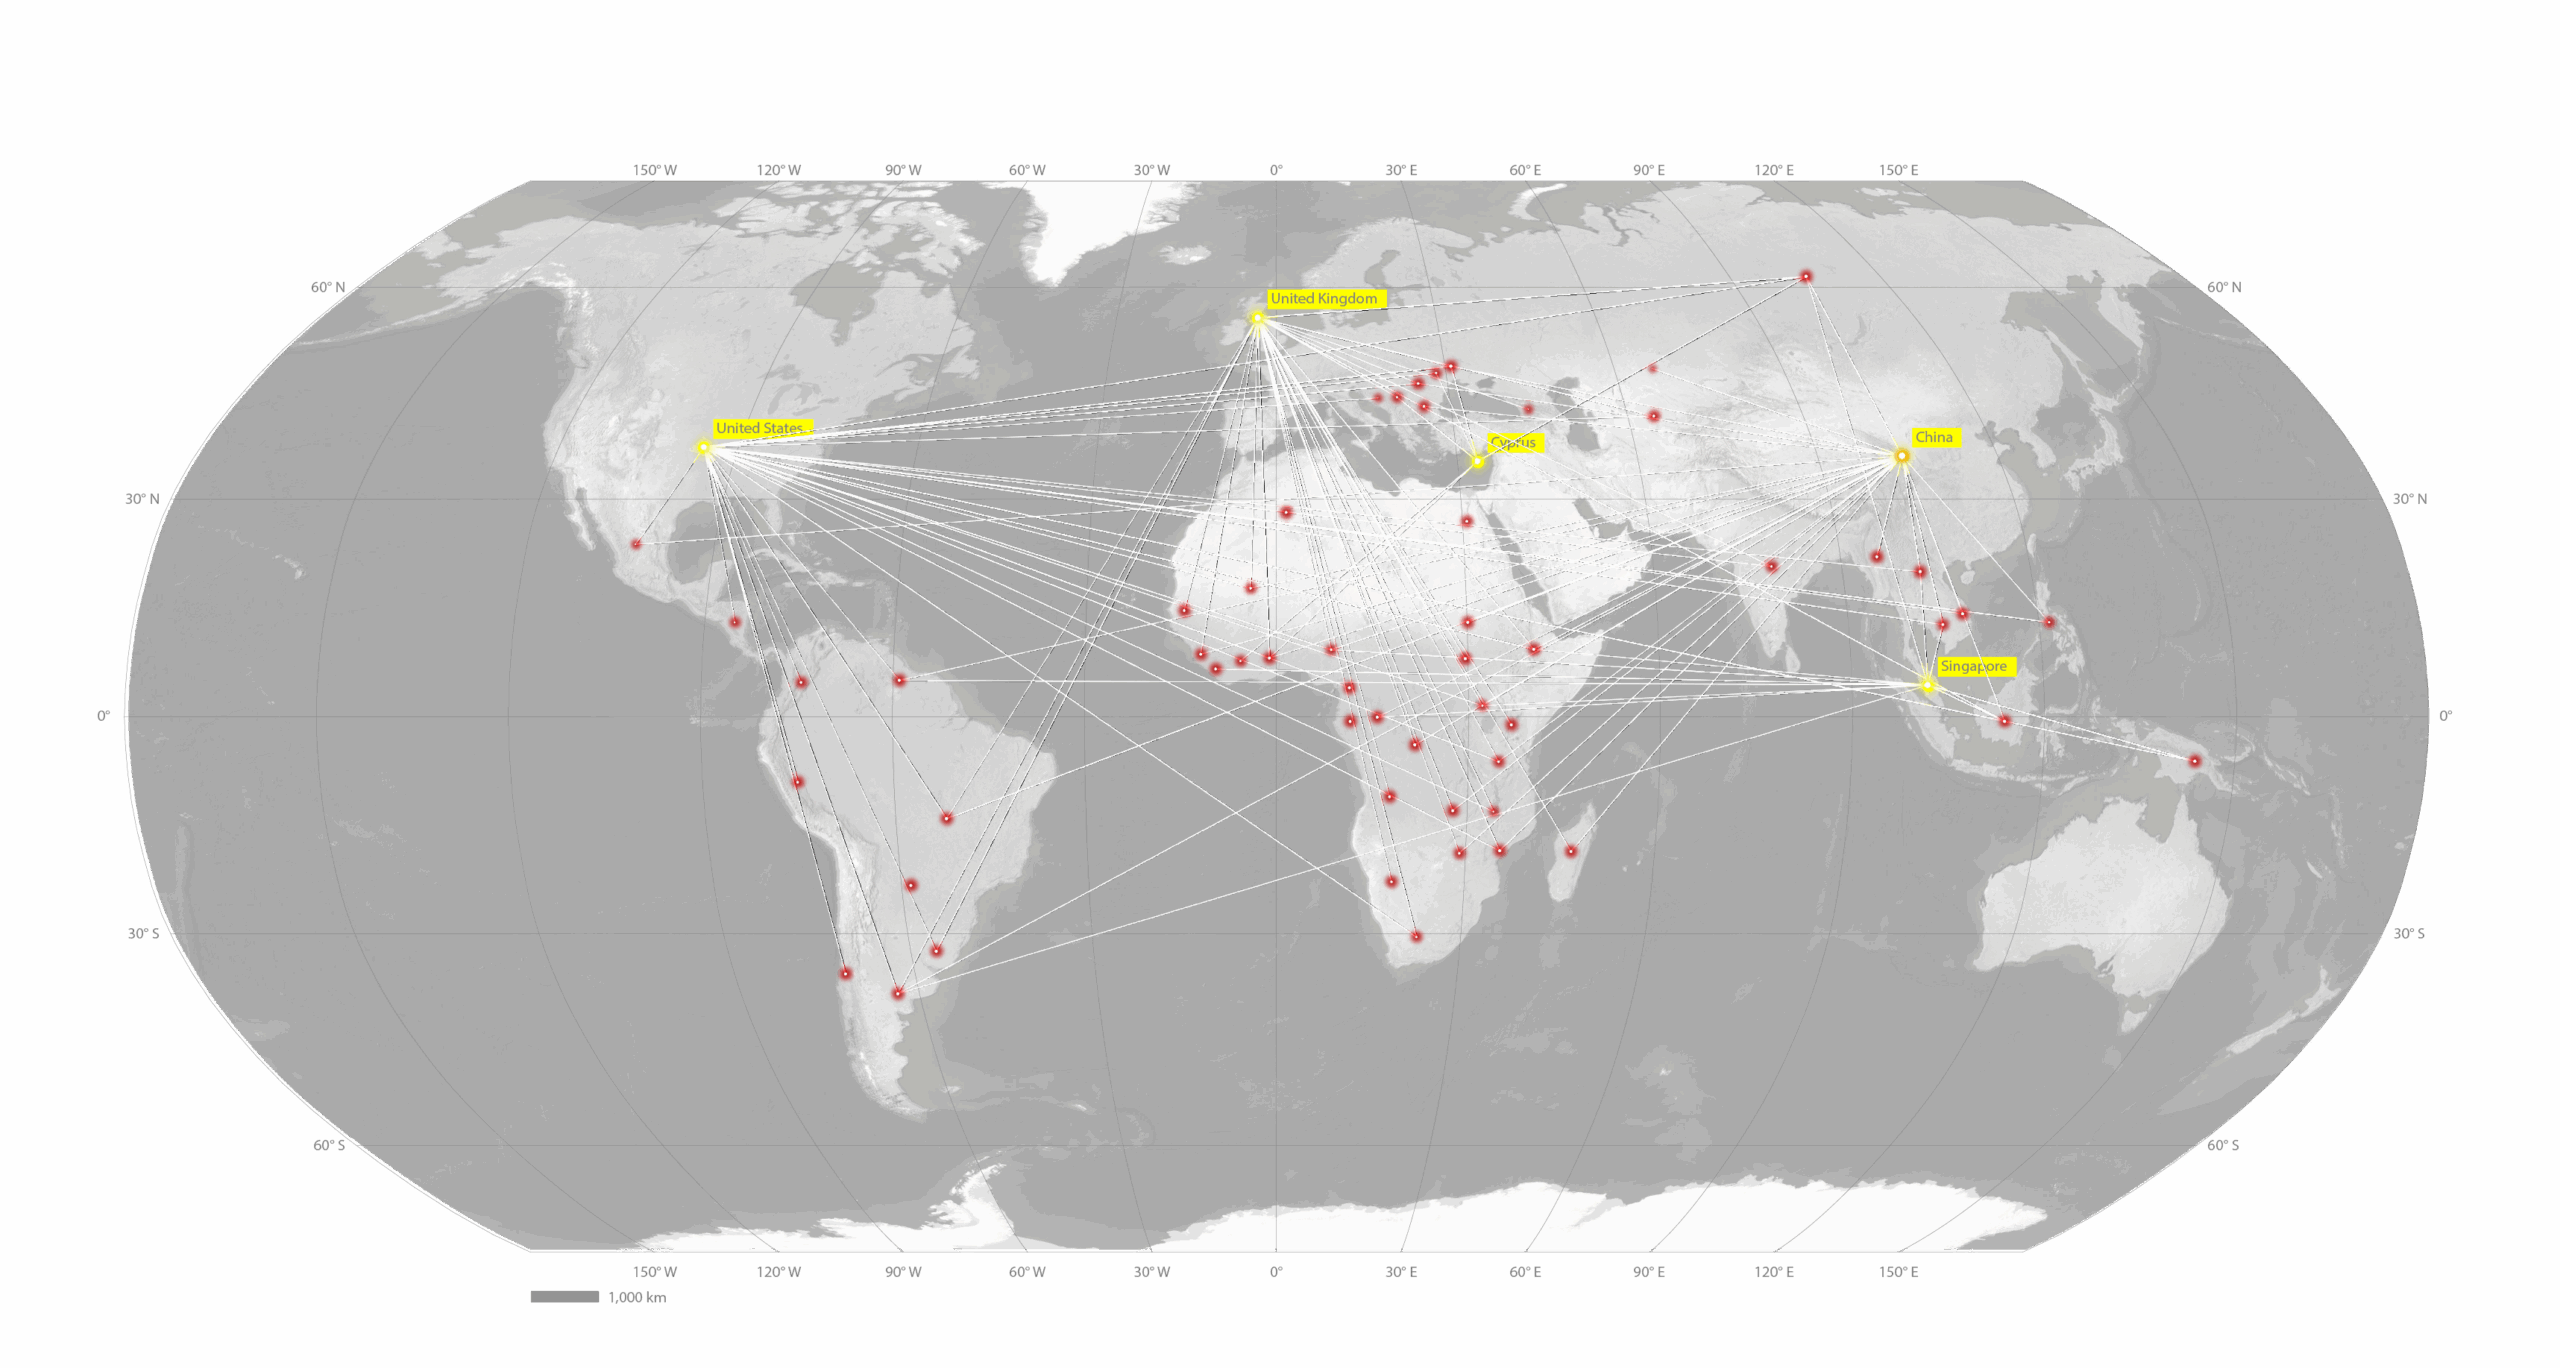
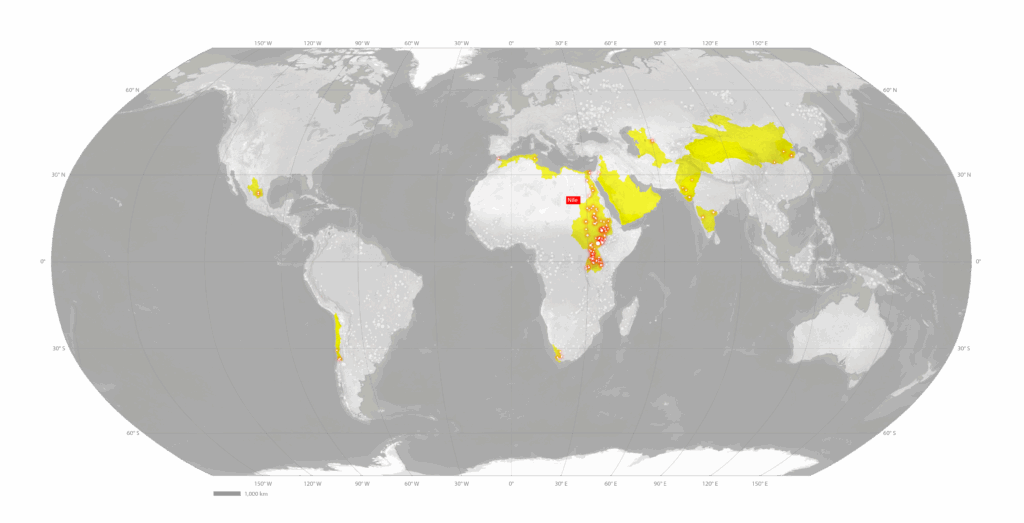
As illustrated in the map below, a clear pattern of power emerges: countries from the Global North [in yellow] are predominantly the buyers of land, while those in the Global South [in red] are primarily the sellers.
This dynamic highlights how control over land and natural resources is increasingly shaped by geopolitical and economic hierarchies.
One particularly noteworthy finding is the presence of Cyprus among the top five land-buying countries. This is largely due to its status as a tax shelter, where many foreign companies [from buyer countries] are registered for financial advantages.
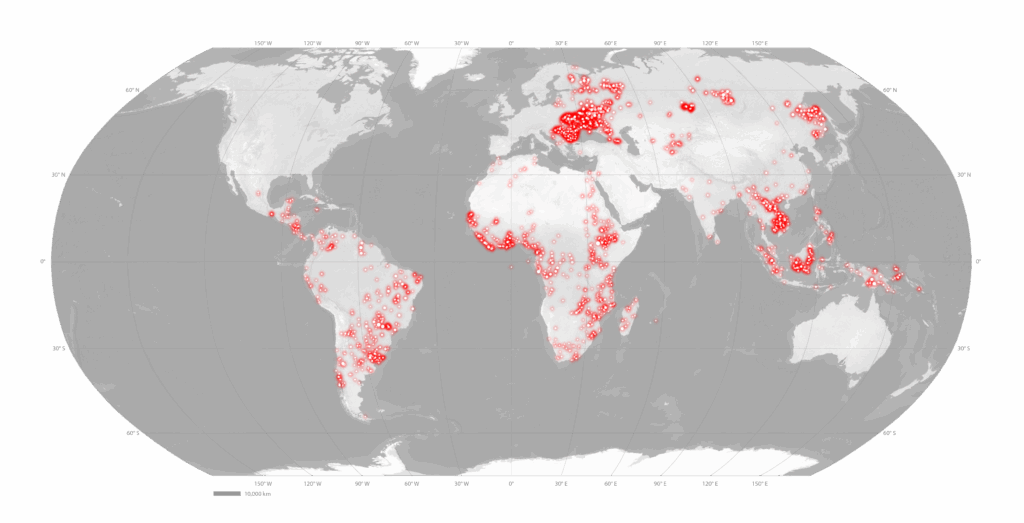
This map reveals where land deals are taking place. These locations are far from arbitrary. They not only reflect global power dynamics but are also strategically concentrated in areas with one vital resource: water.
When we overlaid land acquisition data with maps indicating water stress levels, a strong correlation emerged between the sites of these deals and regions experiencing the highest water risk.
From this analysis, [map below] we identified our Region of Interest (ROI): the Nile River Basin. For approximately 54% of the population in this area, the basin serves as a fundamental resource for survival.
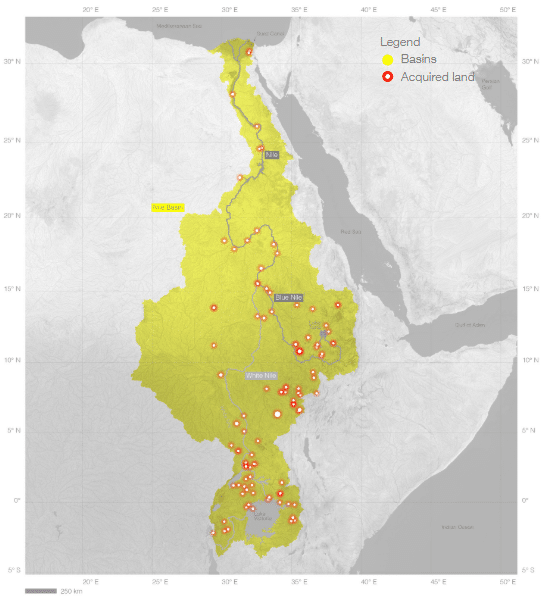
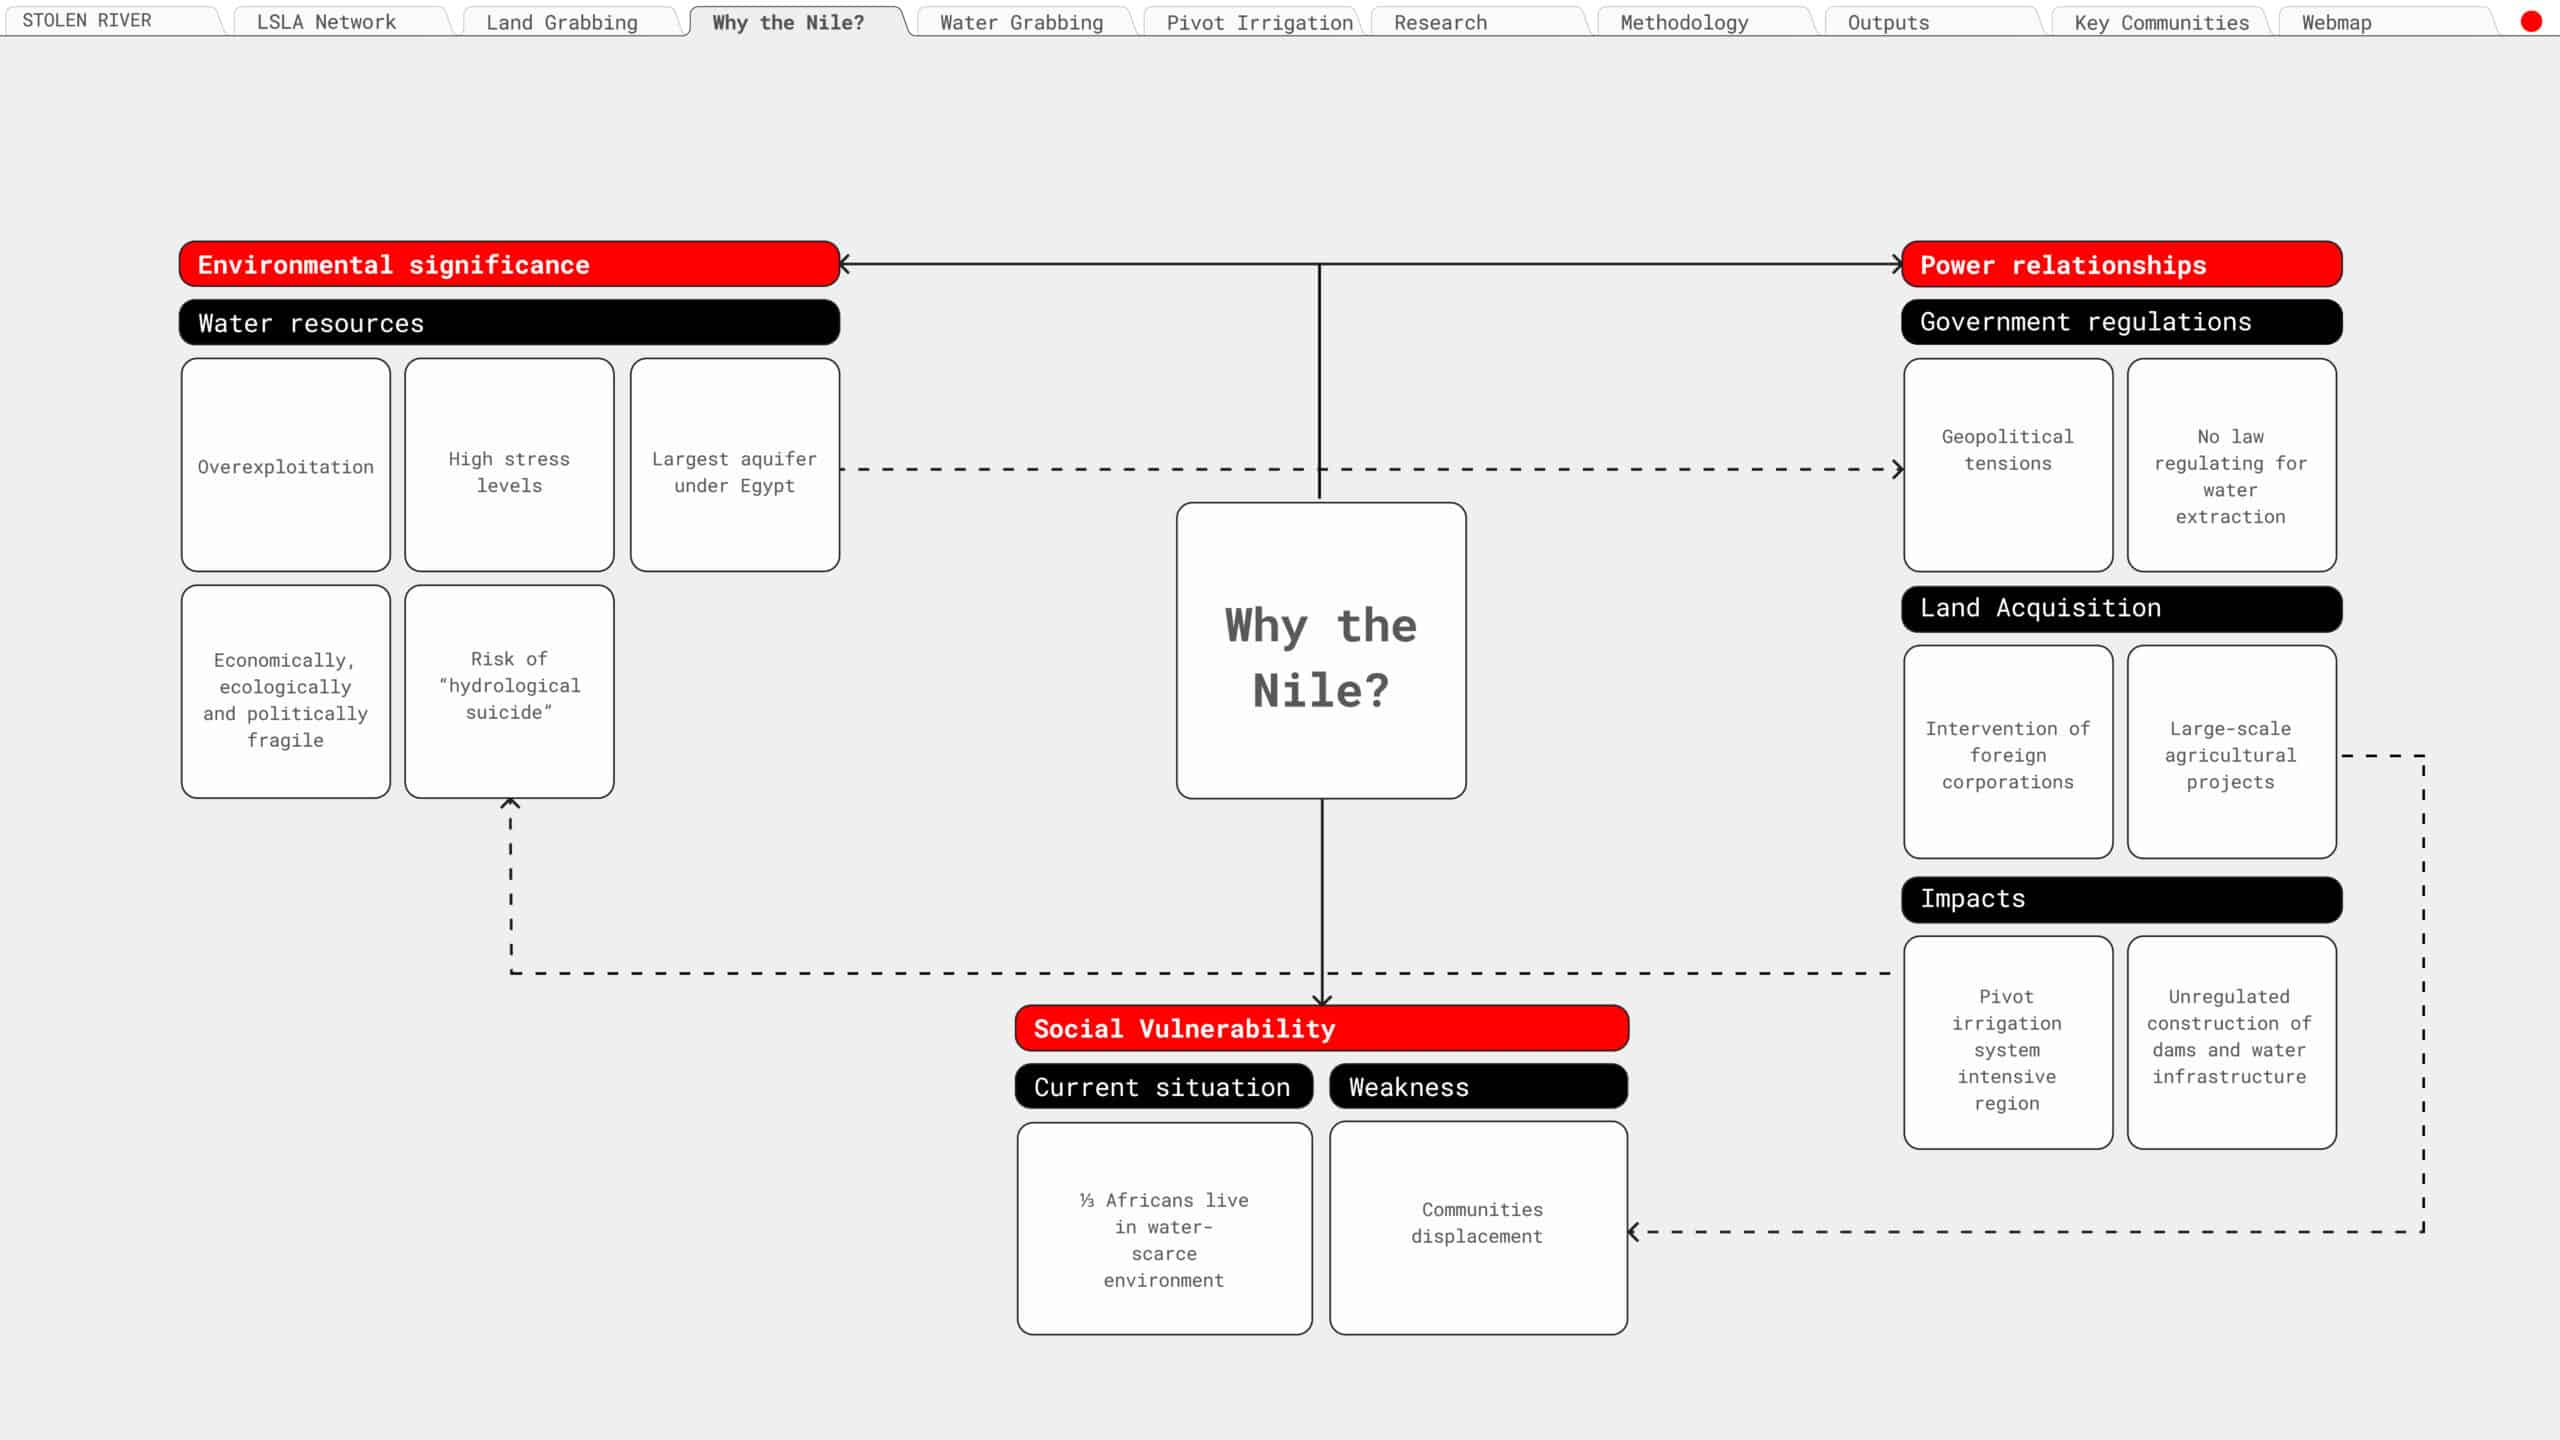
Why the Nile
Eleven countries depend on the Nile for, drinking water, hydroelectric power, and agriculture.
This interests and needs generate significant geopoliticlal tensions on a already politically and economically fragile systems. This vulnerable situation is leverage by corporations who exercise their power by buying large scale land for agricultural projects.
Themain narrative at farmland investor conferences is that water is abundant in Africa, but one-third of Africans already live in water-scarce environments, and climate change is olny increasing these numbers.
This mega land aquisitions displace communities and have high envoromental impacts. The Nile and its aquifer, one of the largest in the world, are ecologically fragile ecosystems and they are being overexploted.
FAO states that irrigating only agricultural lands would require much more water than is available for the total of the ten countries in the Nile basin, for what they are calling as a “hydrological suicide”
Water Grabbing
Land Grabbing
“Refers to the procedure of acquiring land (and freshwater) resources in foreign countries. Most commonly, investors or investing countries are located in the ‘developed’ world, while the ‘grabbed’ land is usually in ‘developing’ countries.”
-European Environment Agency
45% Of Land Grabbed Area is in Africa
83% Of the Land Grabs are for Crop Production
Water Grabbing
“A situation where powerful actors are able to take control of, or reallocate to their own benefits, water resources already used by local communities or feeding aquatic ecosystems on which their livelihoods are based”
– Mehta, S (2012). Introduction to the Special Issue: Water Grabbing? Focus on the (Re)appropriation of Finite Water Resources. Water Alternatives.
60% Of total grabbed water is on Africa
34% Deals take place in dry-land zones
Additionally, land acquisition contracts tend to contain no specific mention of water rights at all, leaving companies free to build dams and irrigation canals at their discretion. In some contracts, a minimum fee is agreed for water use, but with no limitation on the amount of water that can be extracted.
With this in mind, we consider that Land Grabbing and Water Grabbing are synonymous concepts, and it is within this synonymy that our research is situated.
Pivot Irrigation Systems
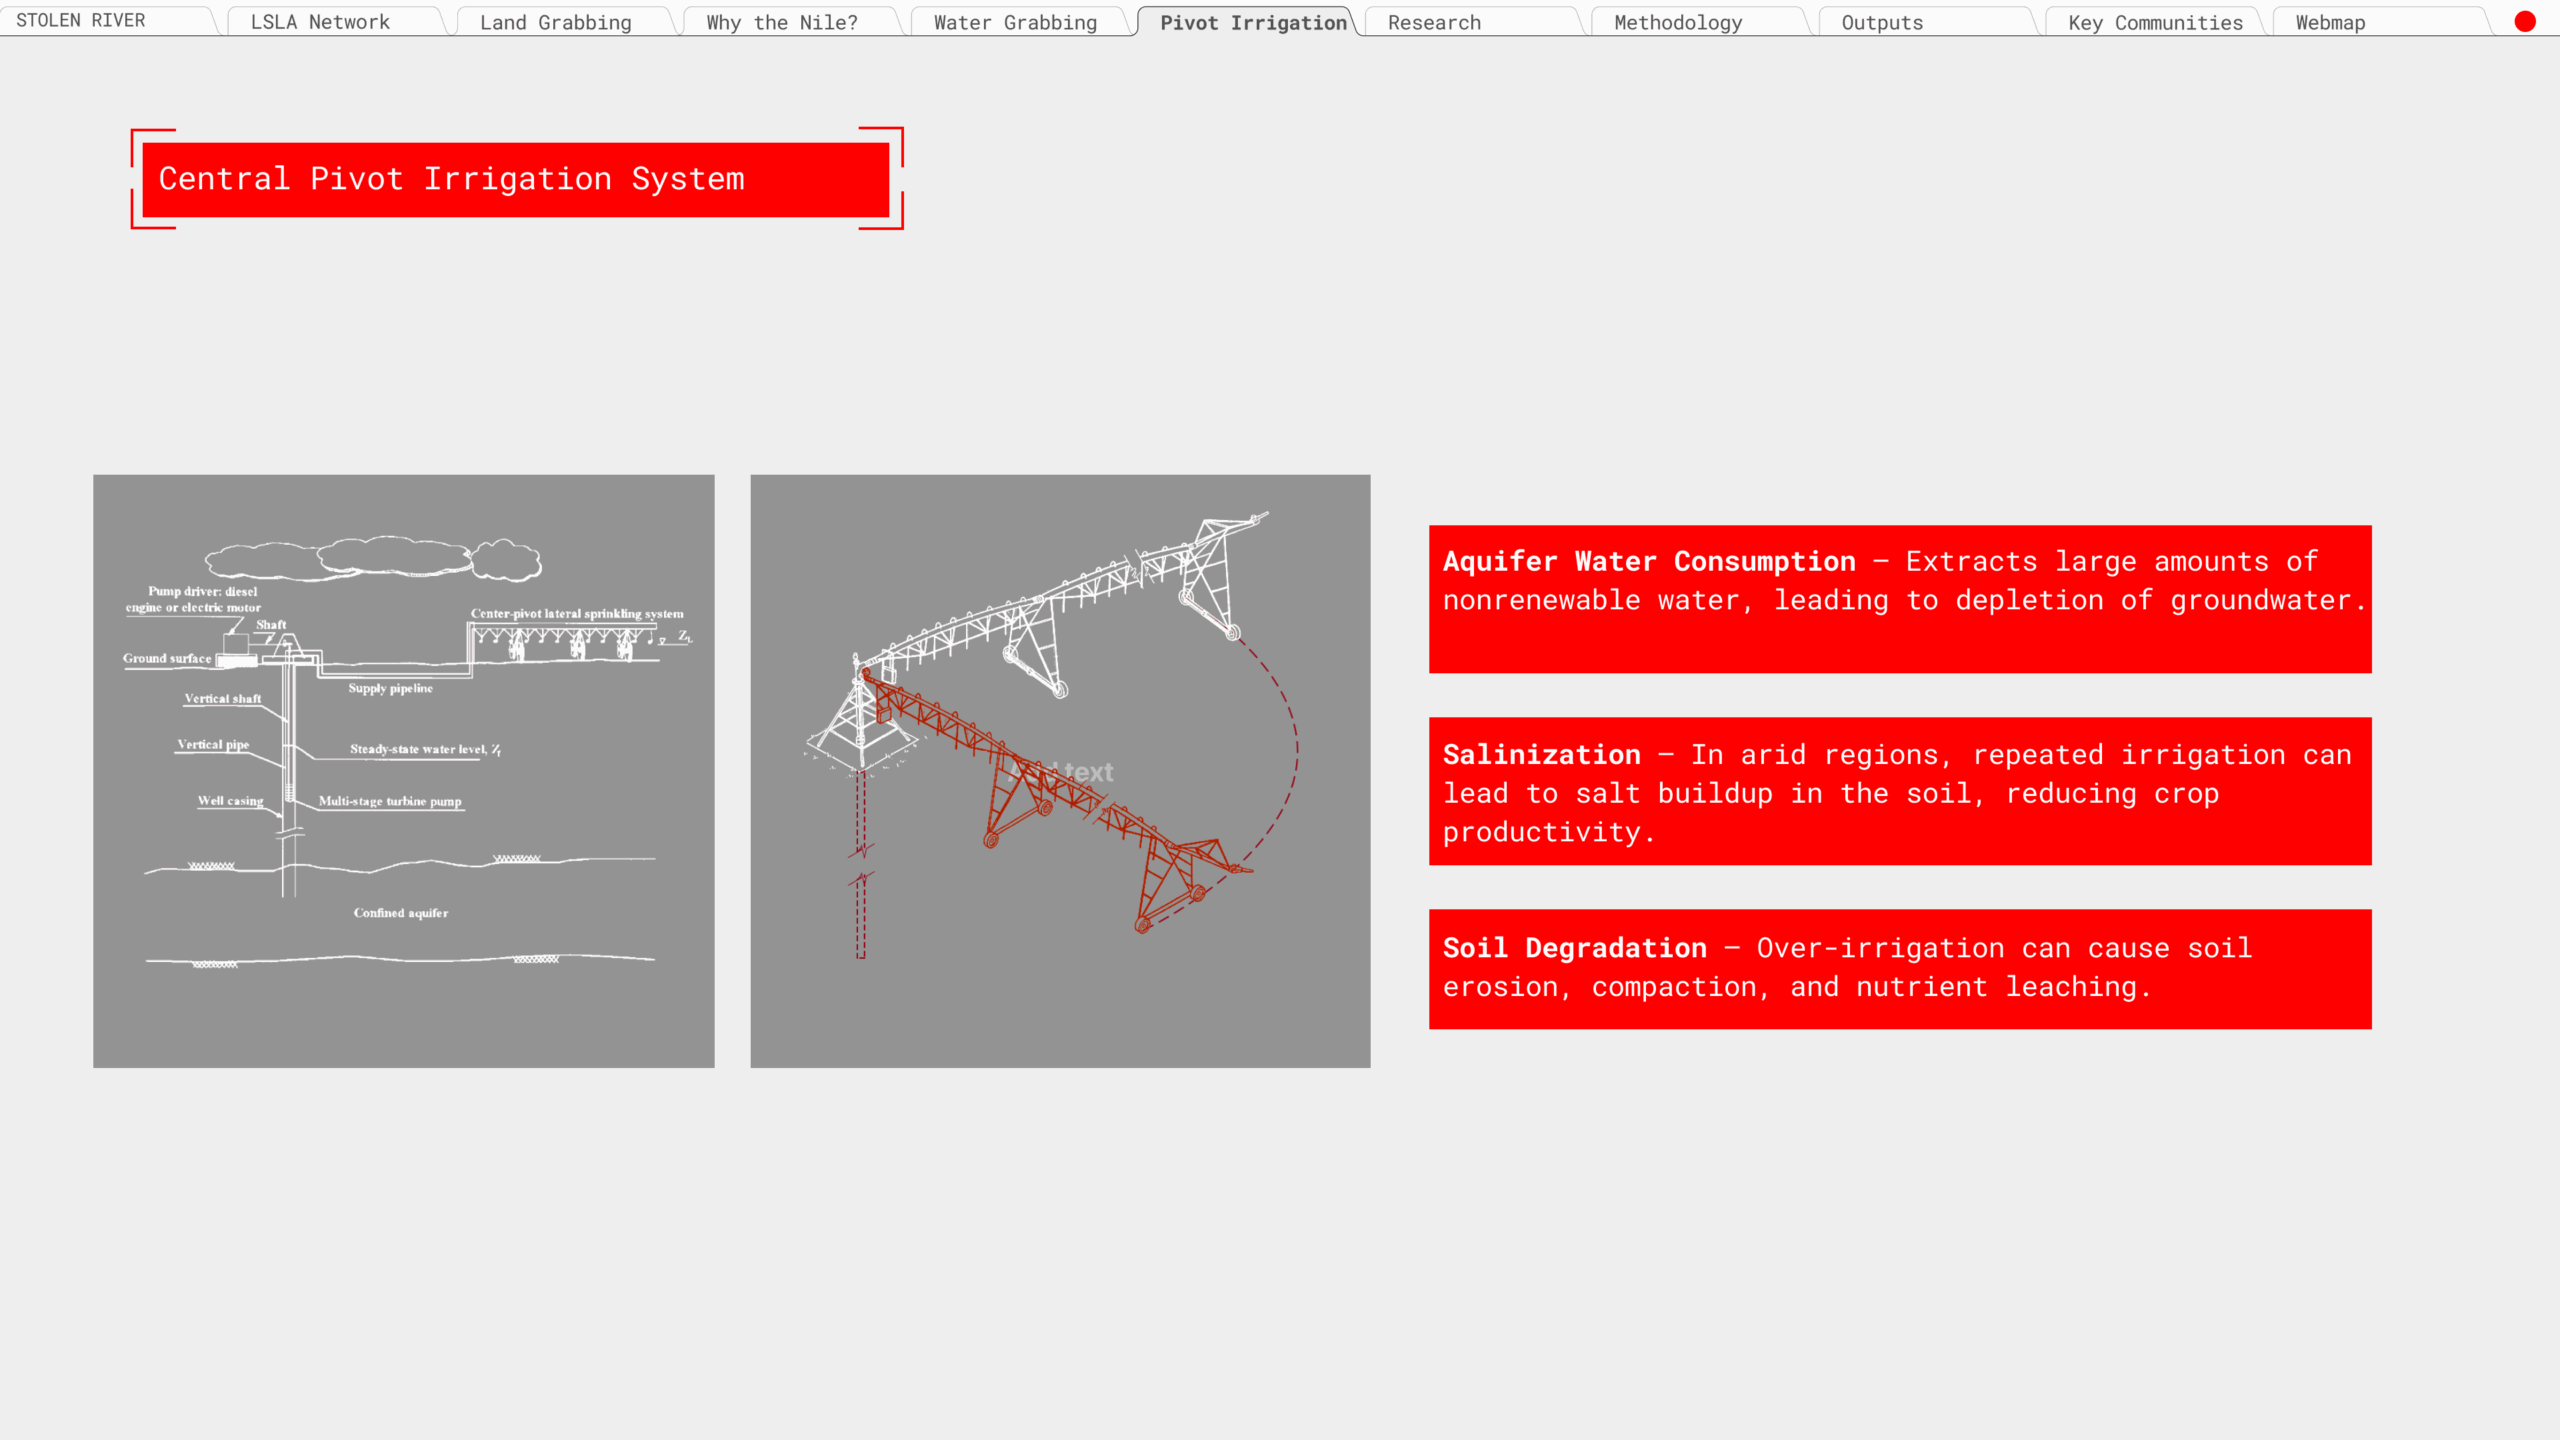
Pivot irrigations systems are eseential to our research – by following their proliferation in the Nile and regions in Middle East we were able to consider them as proxies for land grab and extractive practices. The extractivism is at the very core of Center Pivot Irrigation techniques as their technology relies on pulling water from the underground to the surface of a land. Literature and sources we studied indicated that this form of agriculture could lead to excessive aquifer water consumption, soil salinization as well as over irrigation leading to long-term soil degradation. The discovery and understanding technology of pivot irrigation farms was essential to state that, not only we could use them as proxies for aggresive land consumption and extractive practices, but also as hints of uneven power relations between buyers and sellers of land.
Project’s Research question

Methodology
The process begins with model creation, where 809 satellite images are collected using Python and Leafmap, then annotated semi-automatically in Roboflow. A detection model is trained over 50 epochs to recognize pivot irrigation structures. Once the model is established, large-scale data collection is conducted by defining key regions of interest in QGIS and acquiring a decade’s worth of Sentinel imagery using Python and Geemap. These images are tiled annually with Rasterio to facilitate further processing.
In the inference stage, the detection model is tested in QGIS Deepness, running object detection on Sentinel images. The results are fine-tuned through iterative testing. This leads to the refinement phase, where Python scripts filter out large, irrelevant objects and remove isolated detections, ensuring a more precise dataset.
The final stage of this pipeline is analysis, where Python quantifies detections per grid cell, and QGIS visualizes hotspots of irrigation activity. This structured methodology provides a foundation for further investigation into agricultural expansion and its environmental implications, setting the stage for broader spatial and ecological assessments.
From the detection phase (see image above), we observed a significant increase in the number of circular agricultural fields along the Nile over the past nine years. Since 2024, a major hotspot of this expansion has emerged in the Toshka Project, an ambitious initiative launched by the Egyptian government aimed at managing water resources and boosting food production.
Given the striking features of this area, we decided to narrow our Region of Interest (ROI) to the Toshka Project in order to better understand the implications of this agricultural transformation.
Much like the broader region, the Toshka Project has seen a notable rise in circular fields, particularly following land acquisitions by foreign companies such as Al Dahra (UAE) and Al Rajhi (Saudi Arabia).
We also examined the deal specifications provided by Land Matrix and found several critical insights. These companies extract water from multiple sources, including Lake Nasser, the Nile River, and underground aquifers.
A major concern is the predominance of alfalfa cultivation, a highly water-intensive crop. According to the contracts, only 5% of the land is permitted for alfalfa due to its high water demand, yet evidence suggests this limit is being exceeded.
Additionally, the investors are acquiring land at prices below market value, raising further concerns about the fairness and transparency of these deals.
Finally, we found records of legal procedures initiated against Al Dahra; however, these proceedings were never followed through, indicating a potential lack of enforcement or accountability
In this second part of the methodology, environmental effects were visualized using three spectral indices as surface-level proxies: the Normalized Difference Salinity Index (NDSI), calculated as the ratio B11/B12 to indicate soil salinity; the Normalized Difference Vegetation Index (NDVI), calculated as (B8 − B4)/(B8 + B4) to reflect vegetation health; and the Normalized Difference Water Index (NDWI), calculated as (B8 − B11)/(B8 + B11) to indicate surface water content. Subsurface effects were assessed by analyzing groundwater data.
The detection shapefiles were converted to GeoJSON and then into an Earth Engine FeatureCollection (fc_gee). This allowed the analysis to be restricted to the detected circular features. Sentinel-2 (SR Harmonized) imagery was used, filtered for less than 10% cloud cover, and a per-band median was applied to reduce the impact of outliers and better represent the typical crop condition. Finally, the results were exported as raster files for further analysis in QGIS
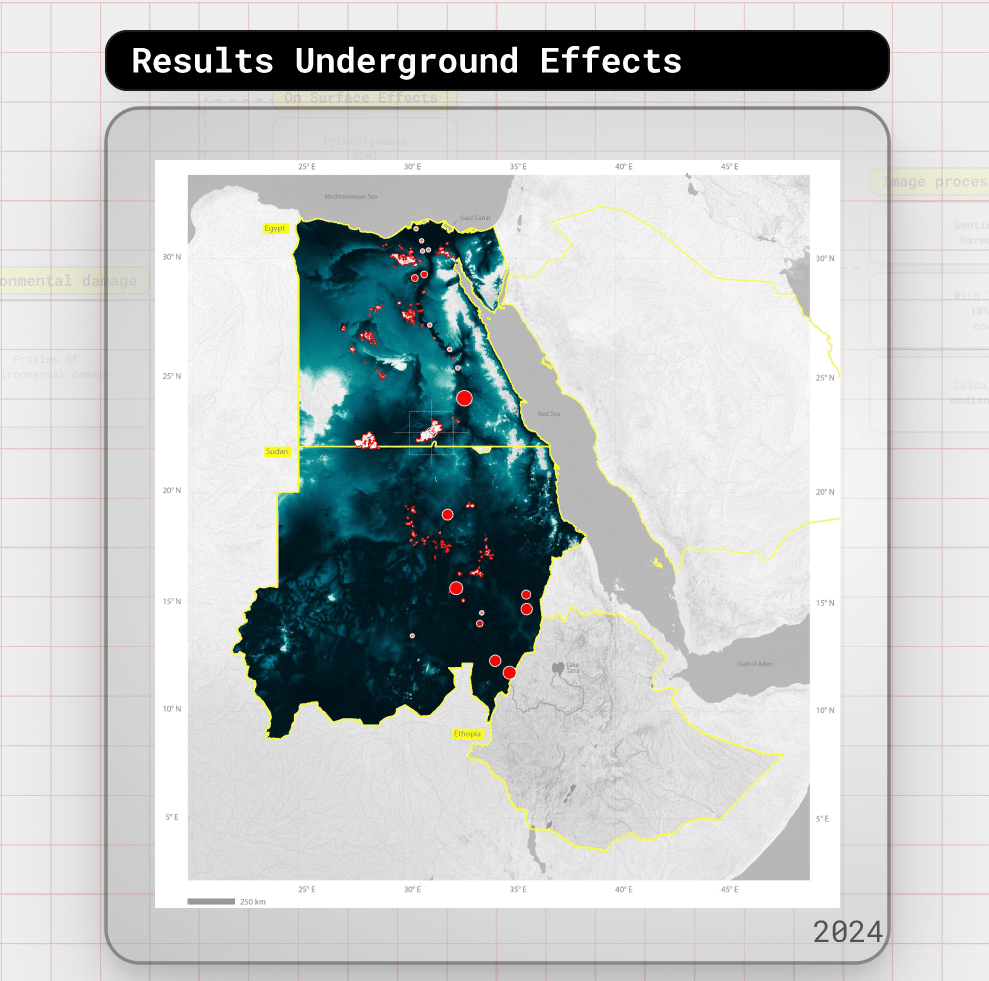
As shown in this image, the agricultural practice in Toshka are situated above one of Egypt’s largest reserves of underground water.
Because the Toshka project is relatively new, it is not yet fully represented in existing water datasets.
However, similar agricultural zones [same type of crops and agricultural practices] reveal a clear correlation between intensive farming, groundwater depletion, and the proximity of circular fields to key water sources.
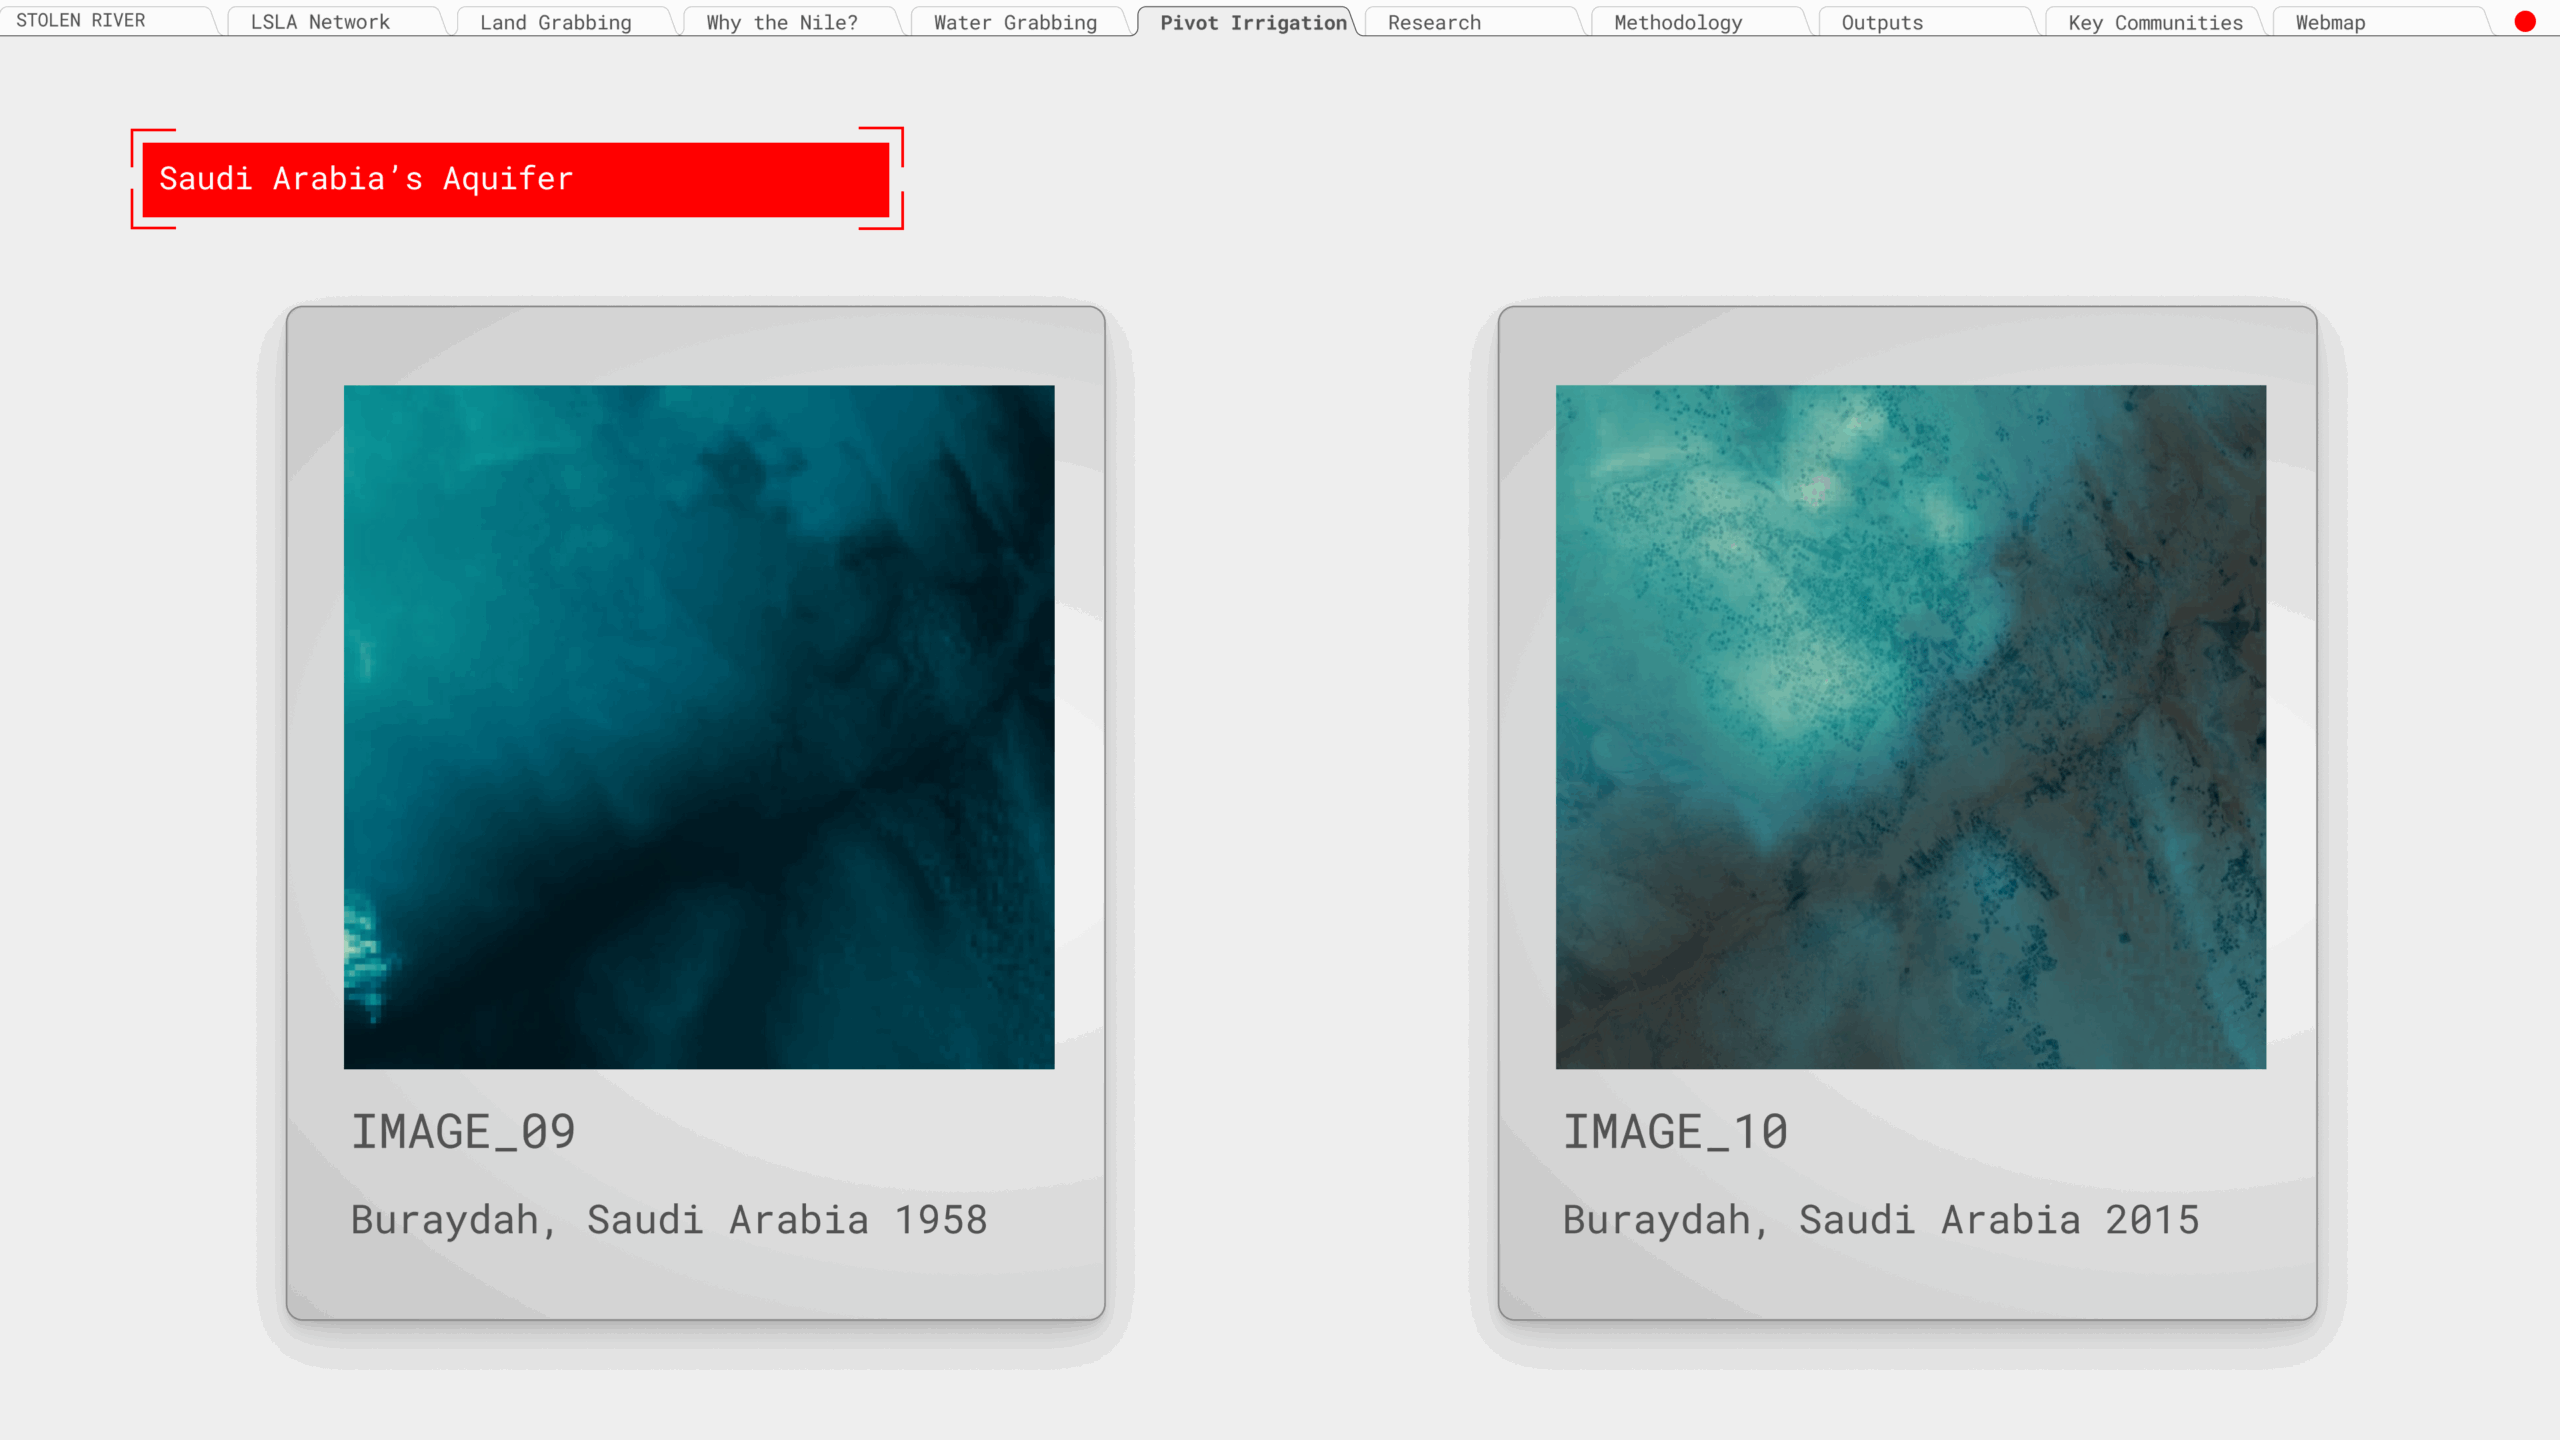
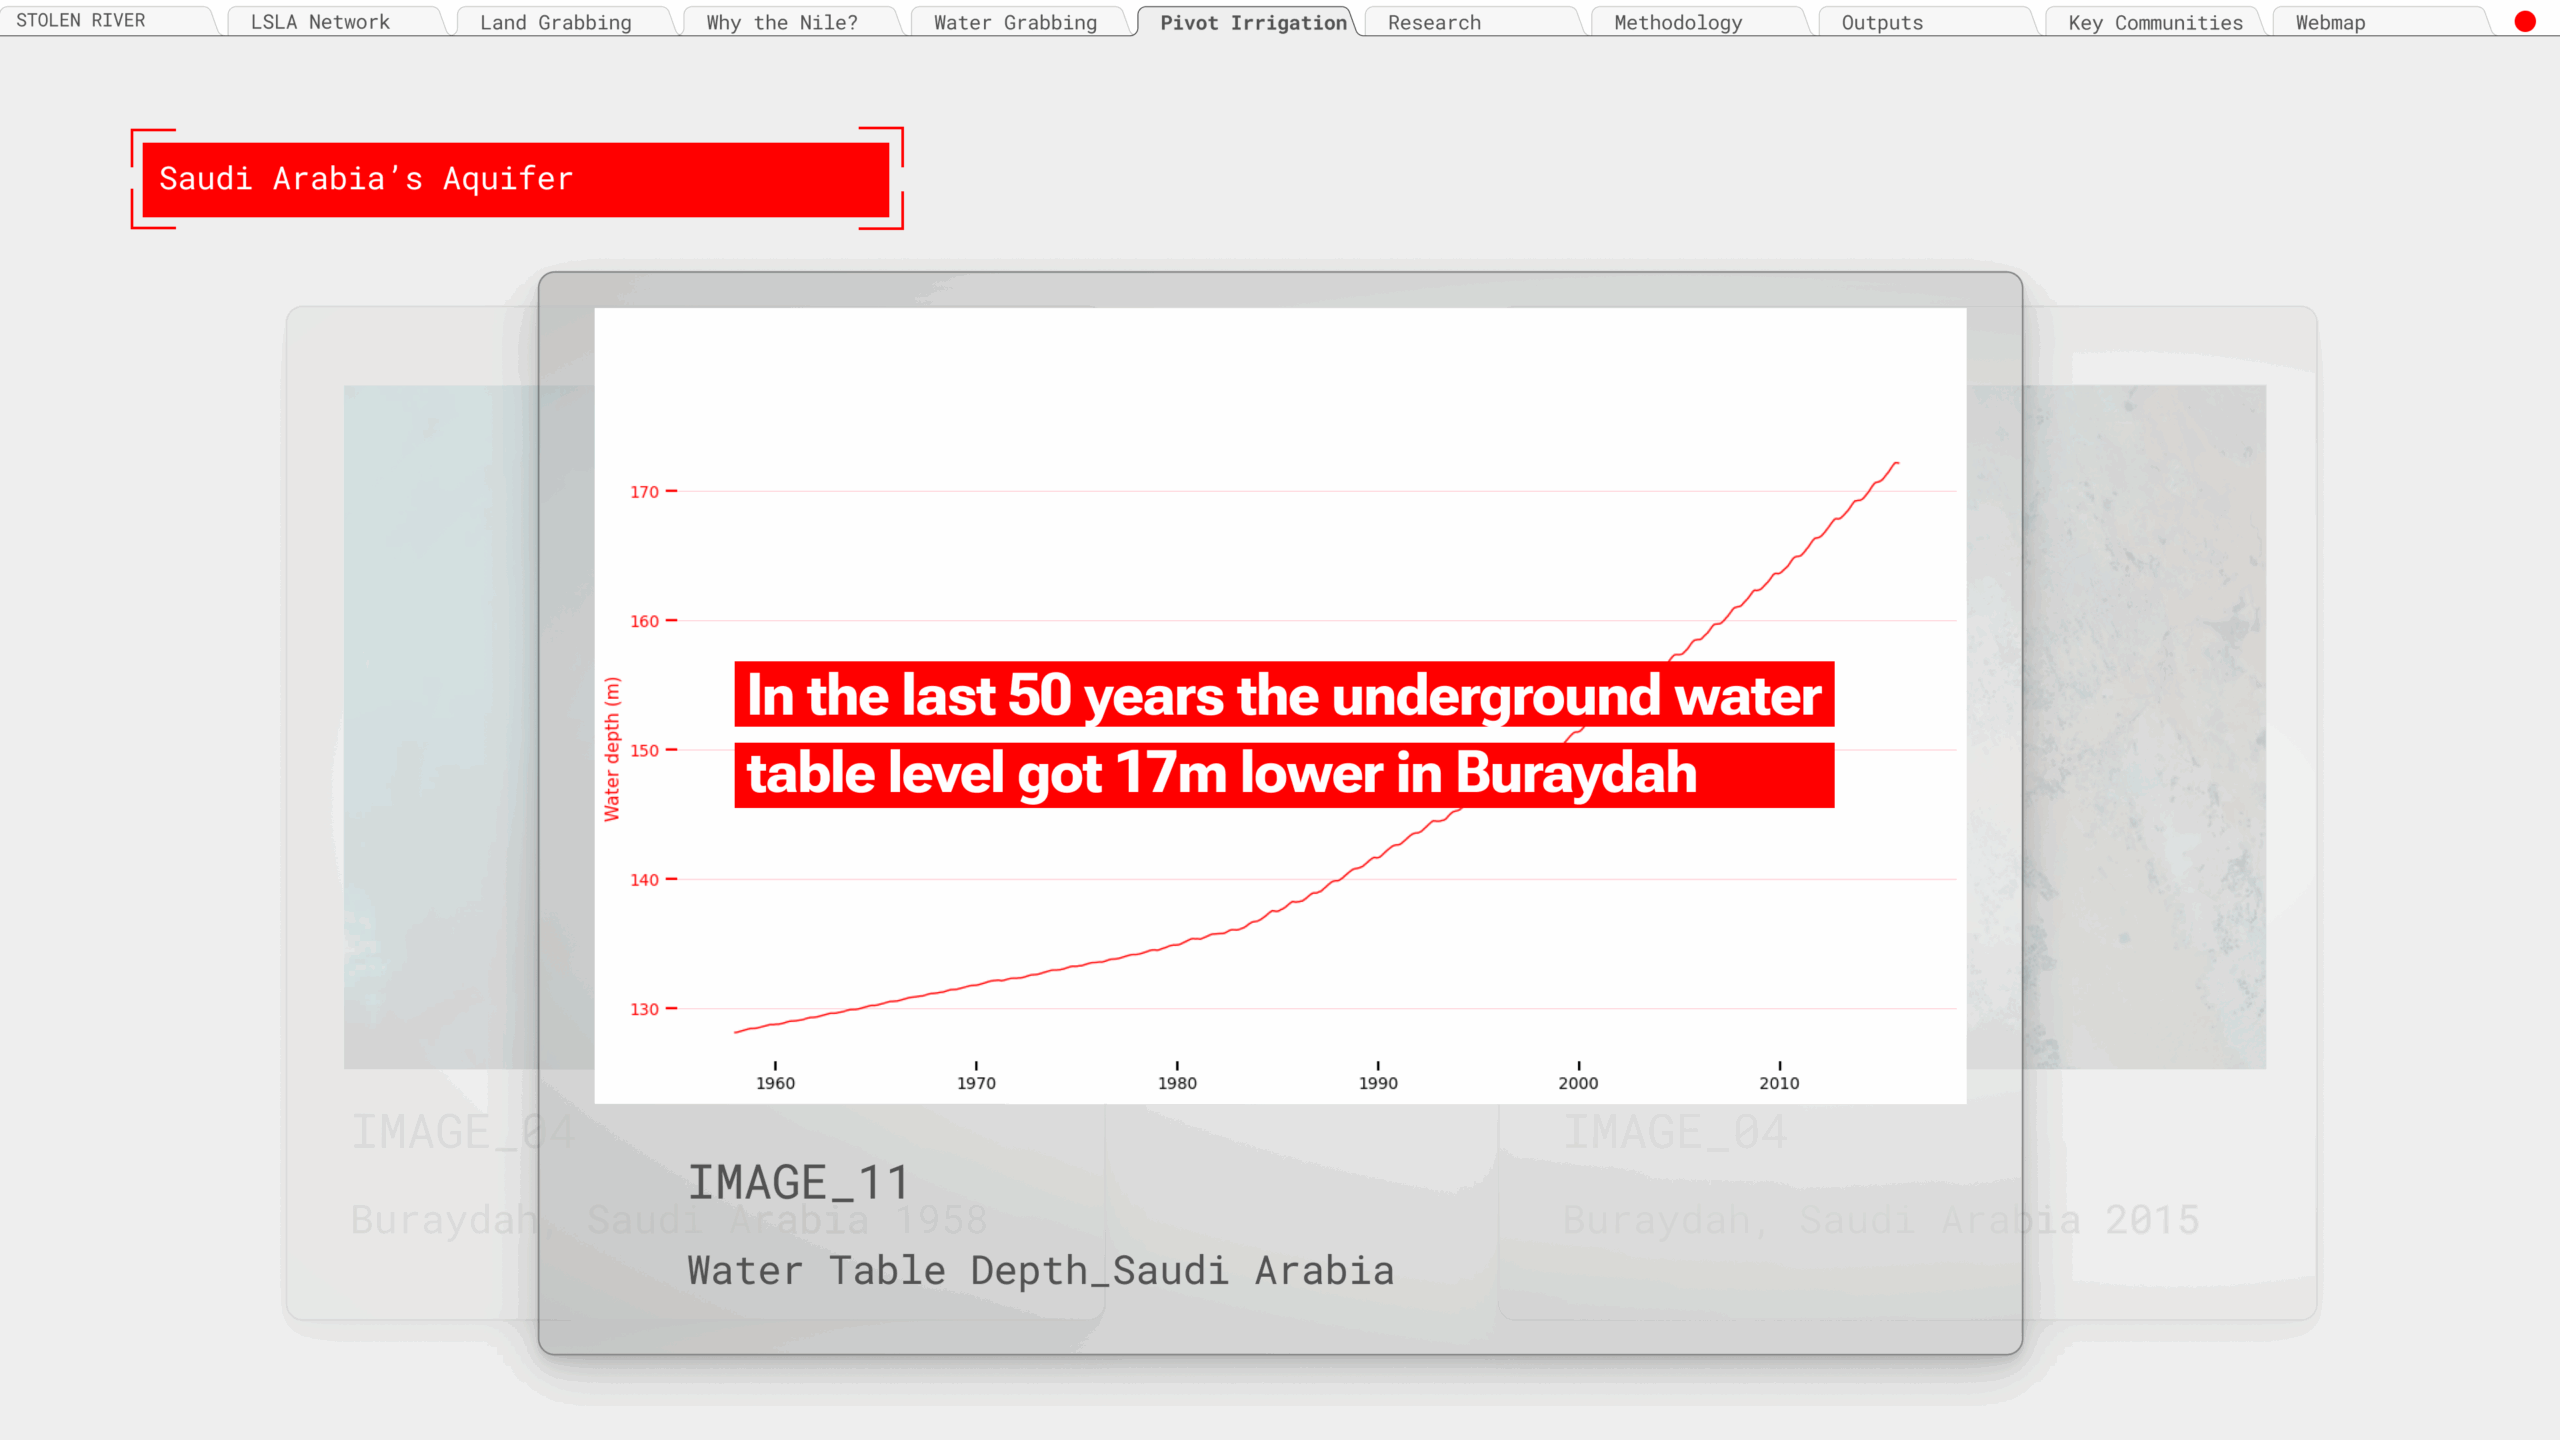
A relevant example is Saudi Arabia, where, after 50 years of pivot irrigation, a significant depletion of underground aquifers has been observed directly beneath the circular farming systems.
Insights
It must be noted that correlation does not imply causation. The team who developed this project are not scientists, but it is important to point out that some patterns can be observed. Charts show that the more circles are detected, the higher the NDWI, NDVI, and NDSI values tend to be. On the map, it is clearly visible that a high amount of water correlates with higher salinity levels; however, vegetation health does not appear to be high in those areas. This is definitely something that someone with a scientific background could investigate further.
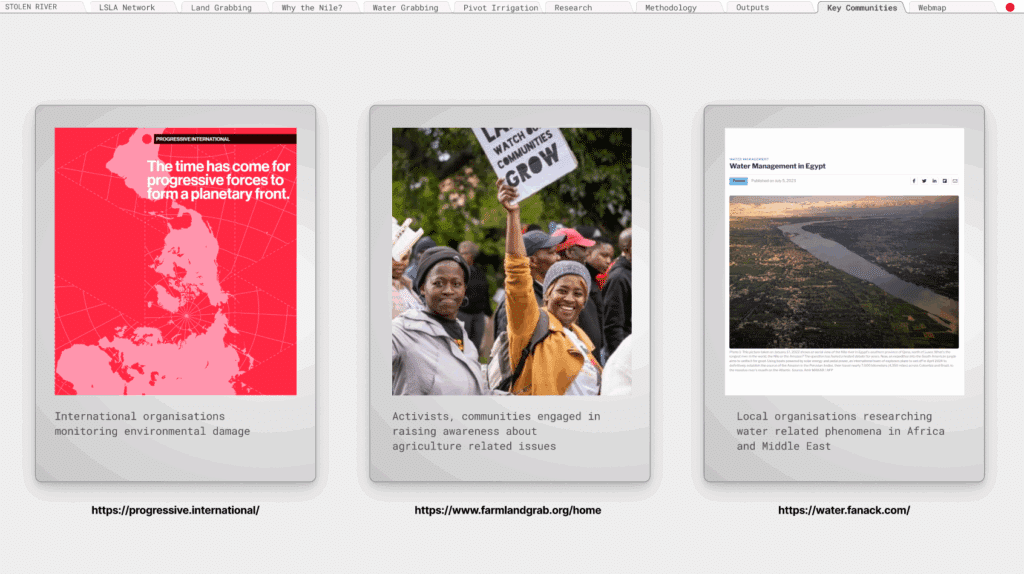
This project brings together the work and vision of several key organizations dedicated to land rights, environmental justice, and the transparency of agricultural expansion.
All of them have all contributed through research, advocacy, and public engagement around land grabbing and food sovereignty. Their insights have helped frame our understanding of how industrial farming intersects with environmental degradation and political power.
We propose the creation of a participatory, international platform—a space where NGOs, researchers, affected communities, and public institutions can come together to share knowledge, align strategies, and advocate for transparency and accountability in land and water use.
Our goal is not only to reveal patterns of extraction, but to build the infrastructure of resistance—grounded in cooperation, knowledge, and solidarity across borders.
Stolen River Platform Prototype
The final output and a “public facing” part of our research is a prototype of a Stolen River Platform. The platform consists of a summary of the developed research, a webmap with highlighted land buyer/seller network as well as environmental layers of NDVI, NDWI and NDSI allowing users to follow our team’s thought process, methodology and analysis. Platform’s goals set around the need for raising awareness of the issue of langrabbing in general. We aimed to simplify the complexity for audiences that are not working in the field. However, we also understand that the investigation of a complex issue like this calls for more data and insights, that’s why we proposed a feedback address for broader audience to submit their discoveries of problem occurences. We aimed for the platform to be engaging and educative, hence the high interactivity factor.
By prioritizing openness and ethical responsibility, we hope this project can contribute to a more informed and collaborative conversation about land, water, and justice along the Nile and beyond. For more information about the project, please visit our website and don’t hesitate to contact us.
