– 00–
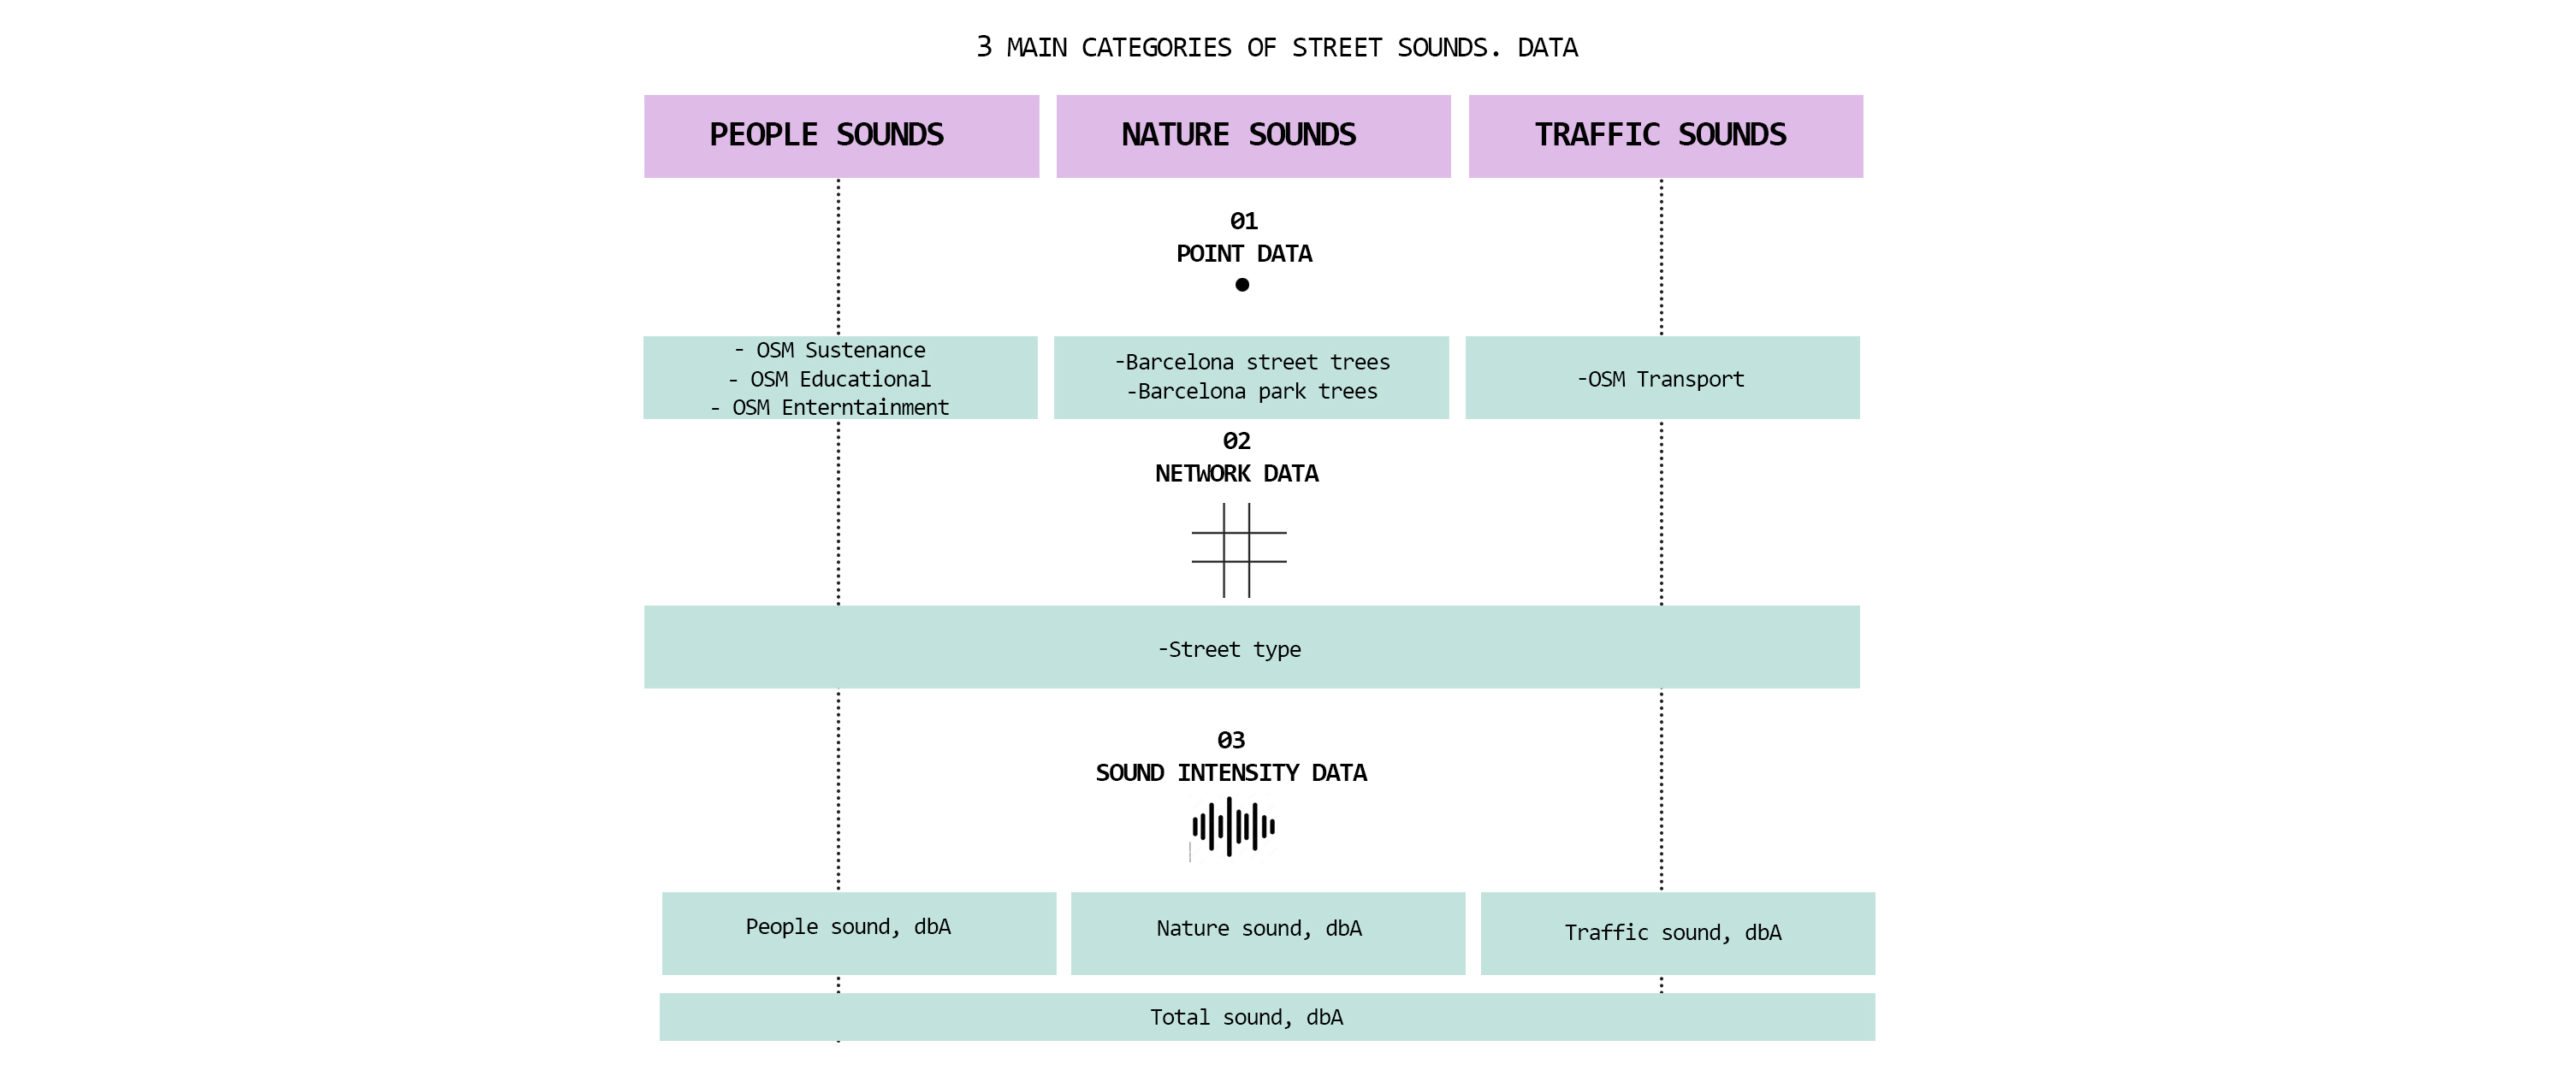
The project aims to analyze the sounds of streets in Barcelona, cluster them and compare. Firstly, a table of sound types evaluation is created. It consists of point data, network data and sound intensity data.
– 01–
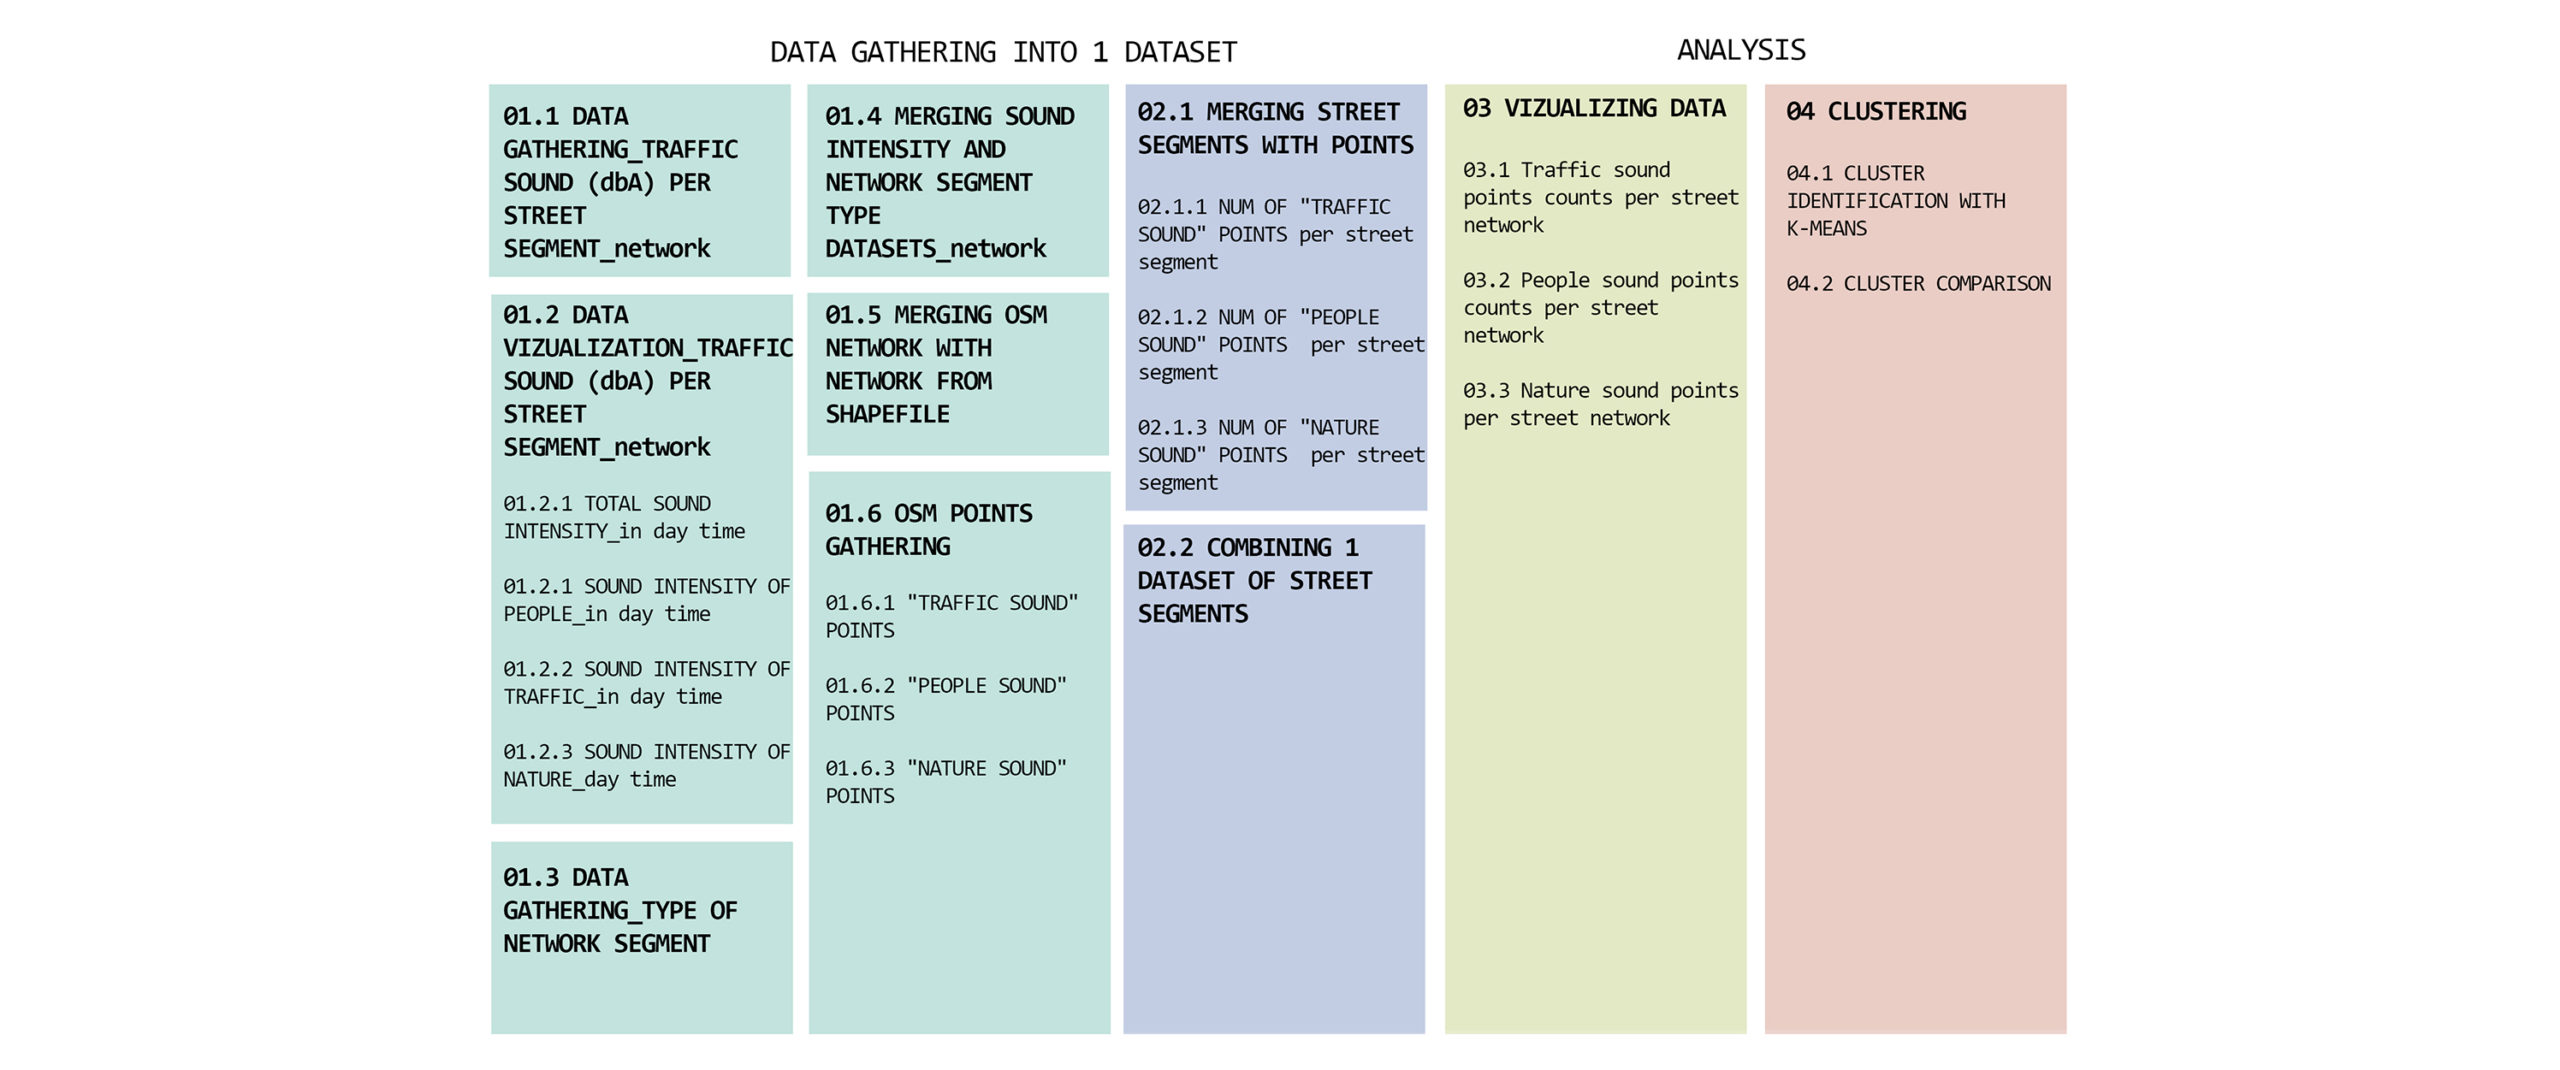
The methodology and analysis of street segments is based on 1 dataset, that was combined using the data above.
– 02–
Firstly, total, traffic, people and nature sound intensities and their distribution in city is compared
– 03–
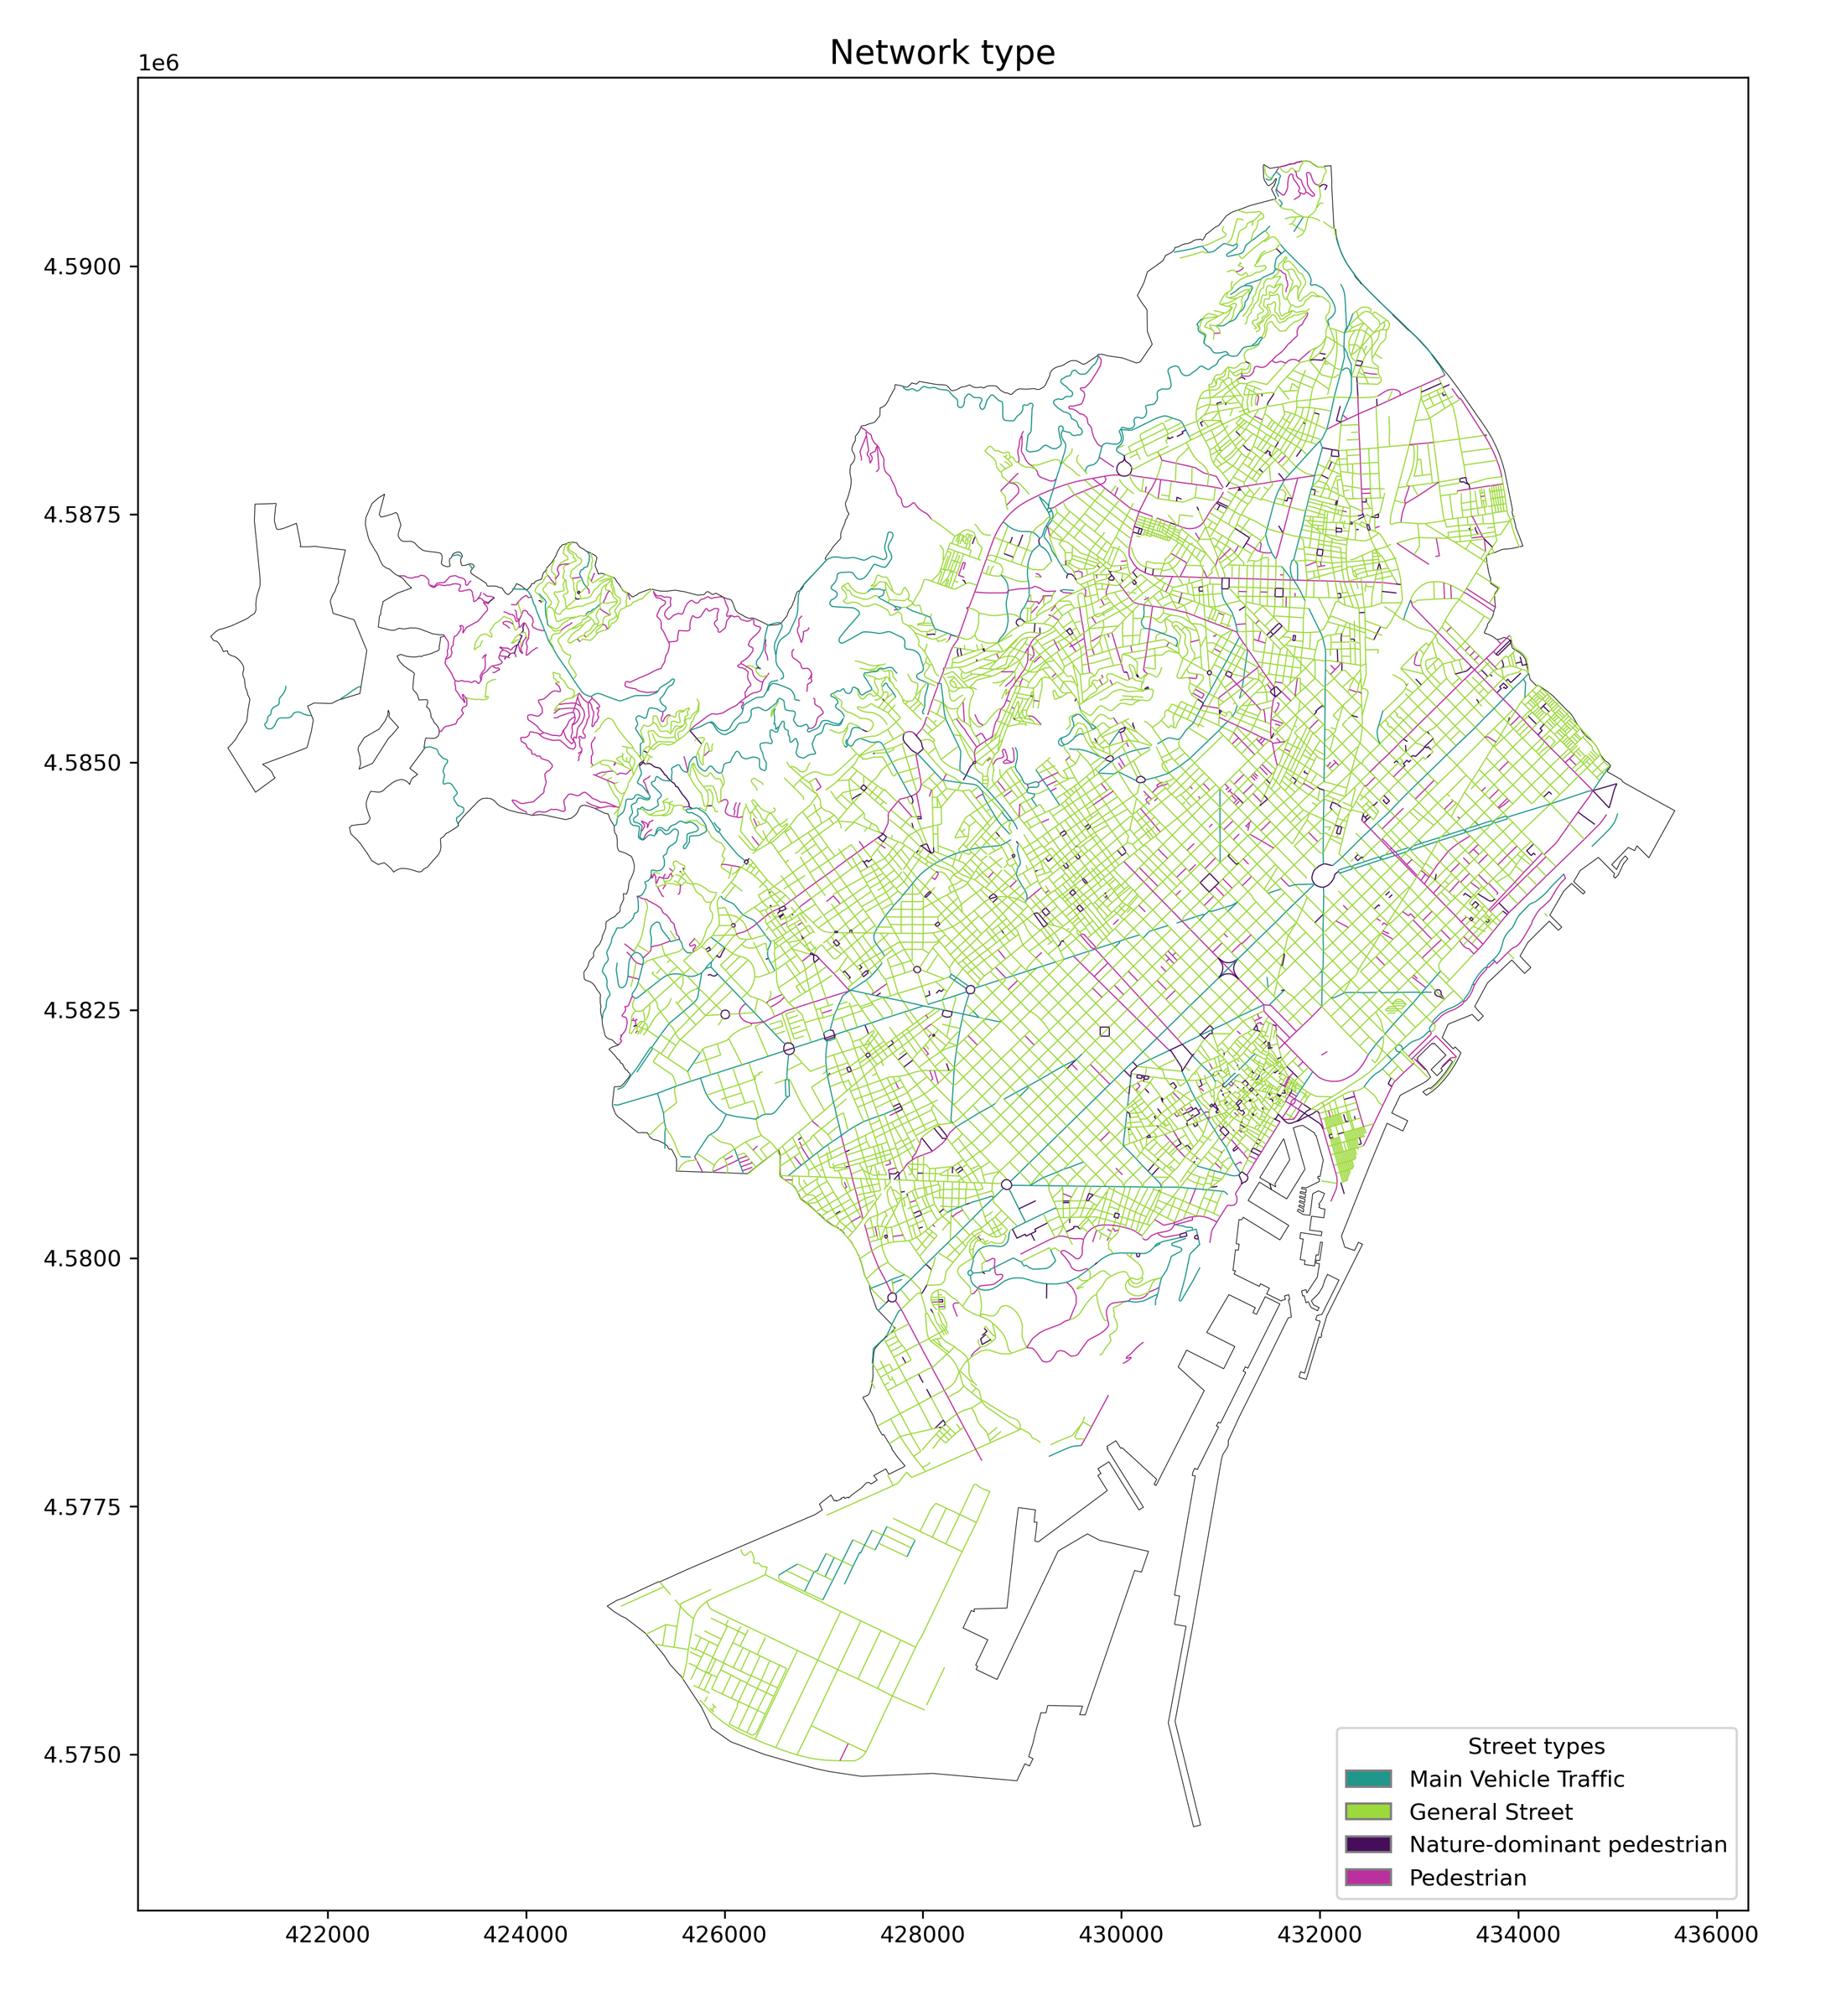
As a second step, 4 main street categories are created, reflecting the sound types of the analysis. They are grouped using Barcelona’s street network data.
– 04–
After combining above mentioned data into 1 dataset, point data is also calculated for each sound type. A full dataset is generated.
– 05–
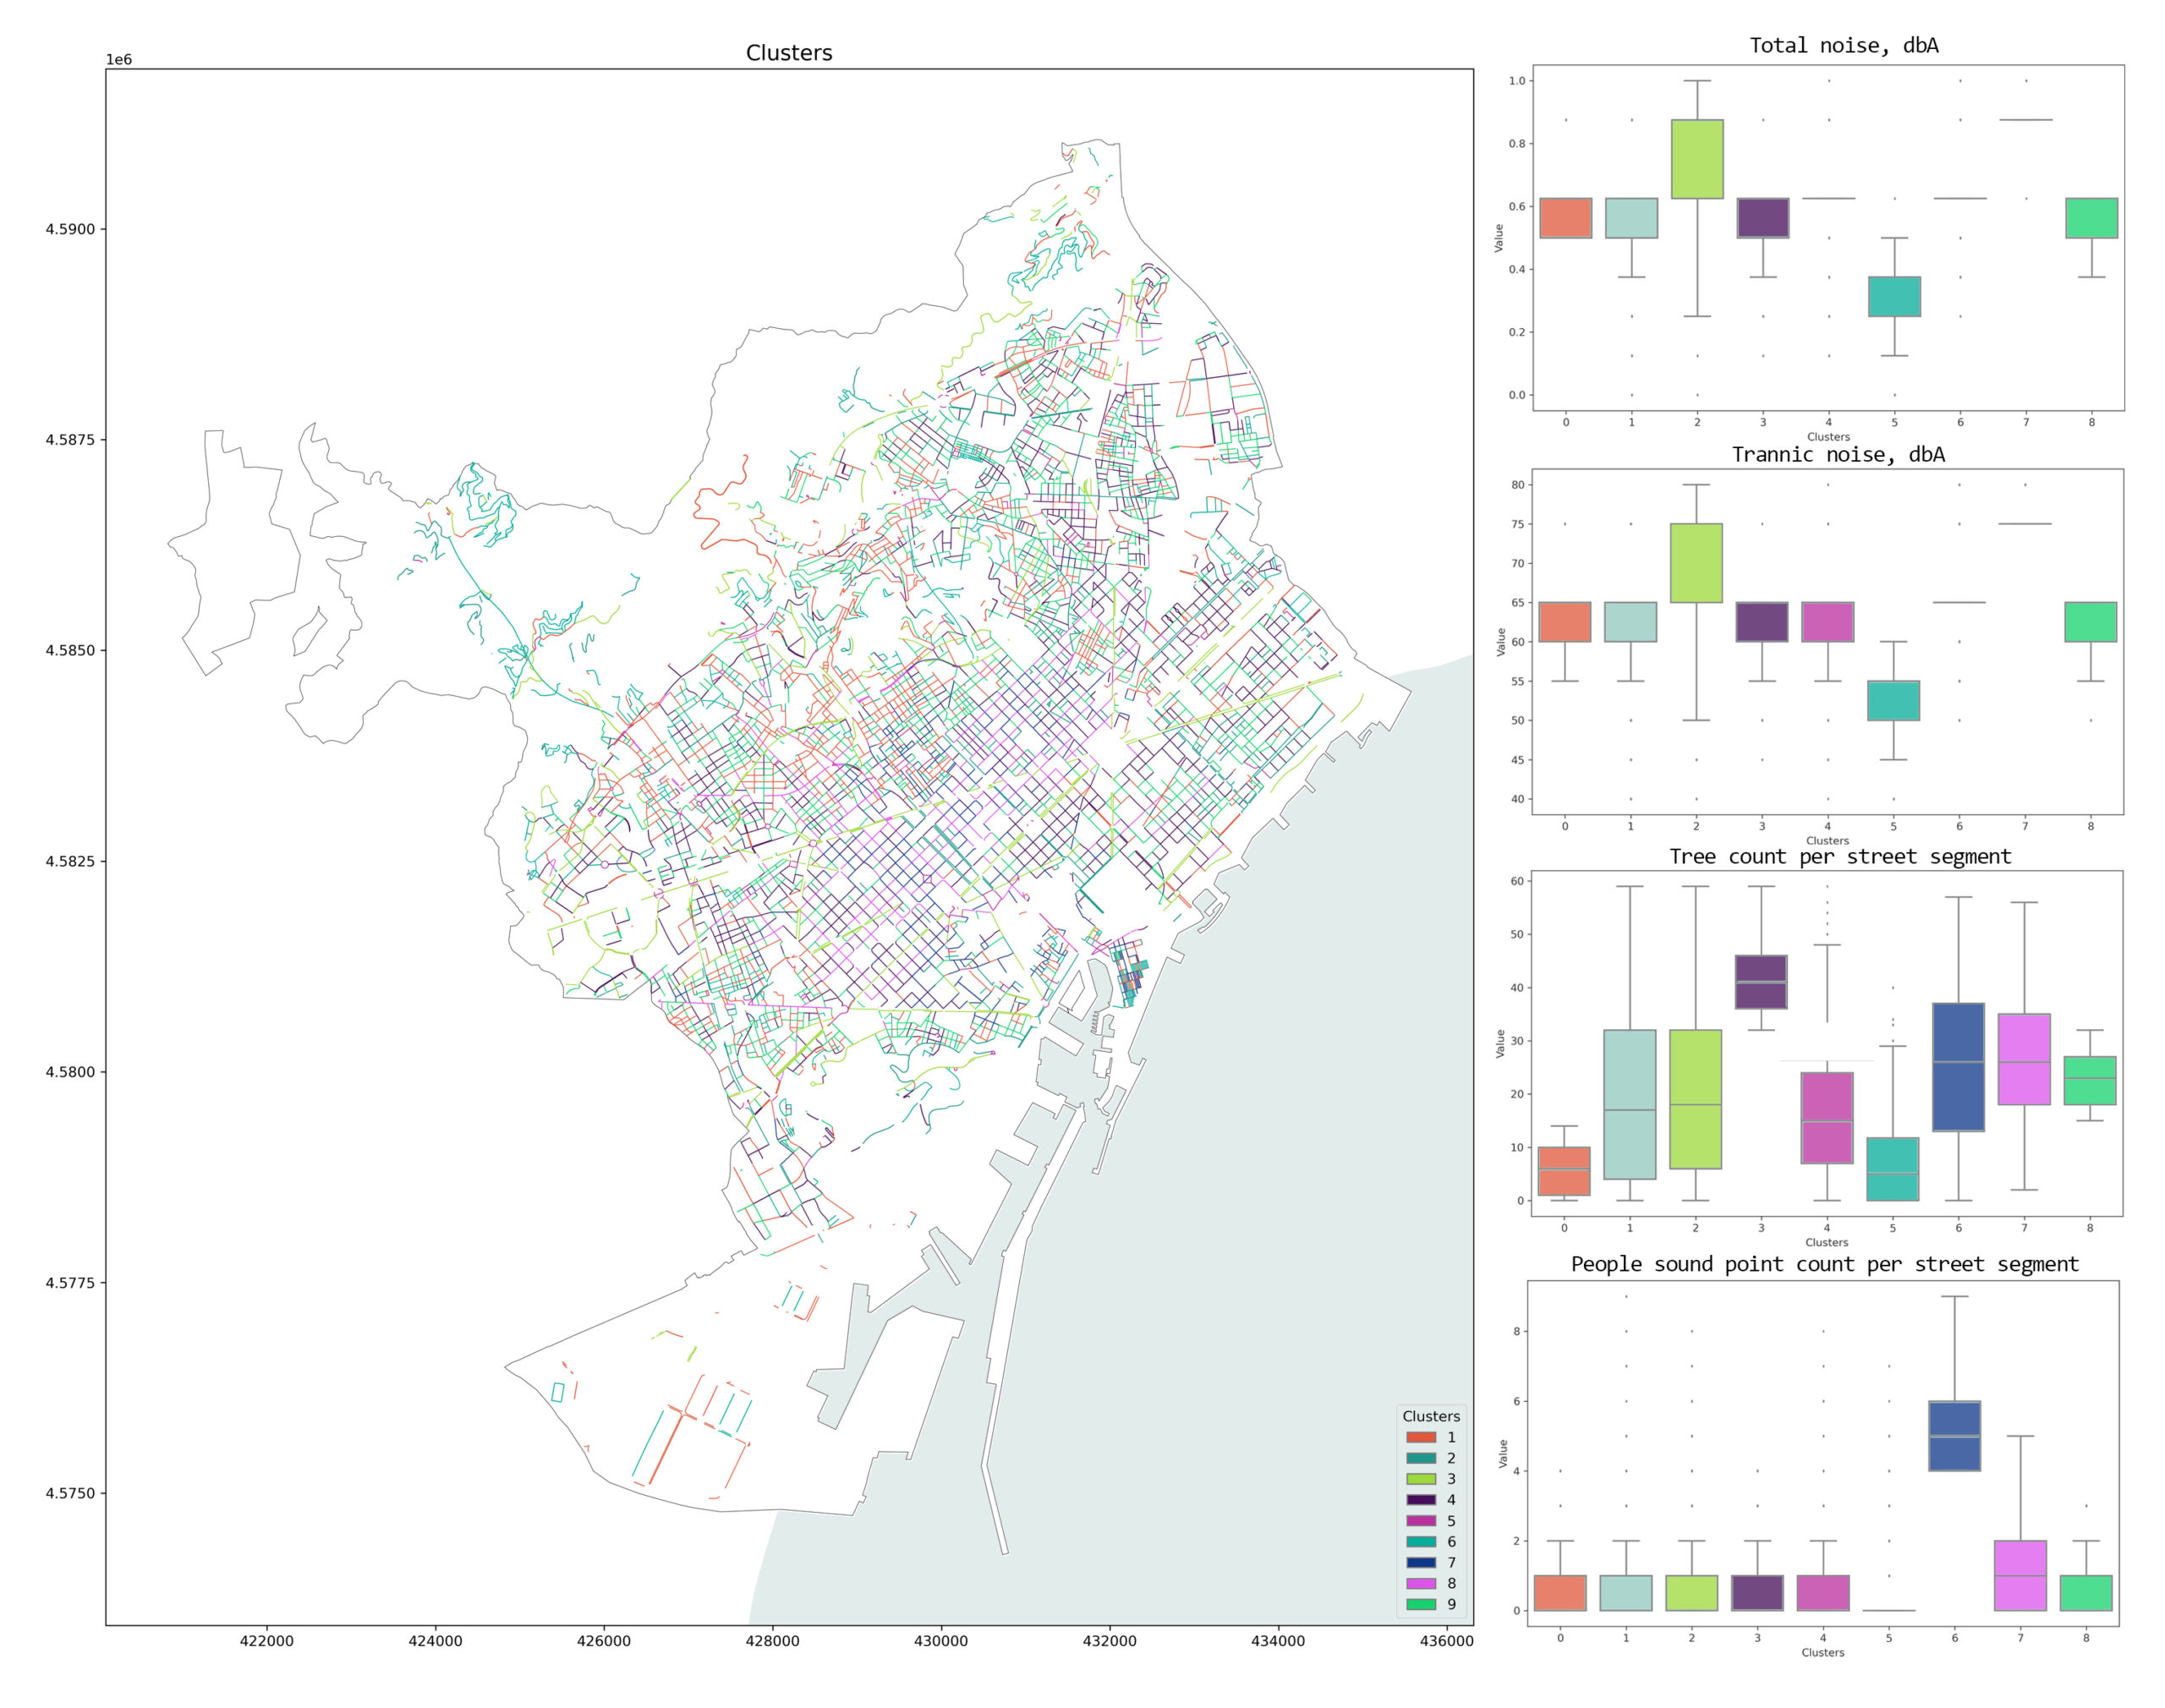
As a last step, street segments are clustered with K-means method. 9 clusters are created. They are based on the values, that makes the strongest impact on sound categorization- total noise, traffic noise, tree count per street segment, people sound point per street segment. We can see that cluster 6 has one of the most pleasant qualities- vibrant people and nature sounds. Cluster 2 is the noisiest. Cluster 5 would be the most silent one, not having a lot of people noise.