
“Unlocking New Horizons in Immersive Acoustic Environments!”

Traditional methods of predicting sound acoustics in domes require extensive manual calculations and simulations, leading to time-consuming and resource-intensive processes. The idea is to develop a machine learning model that could calculate the complex acoustic properties of dome structures.
This model can help us to predict the sound quality for different dome typologies. Architects and sound engineers can leverage these predictions to optimize speaker placement, select appropriate acoustic treatments, and adjust other parameters to enhance the sound experience within the dome.
l WORKFLOW
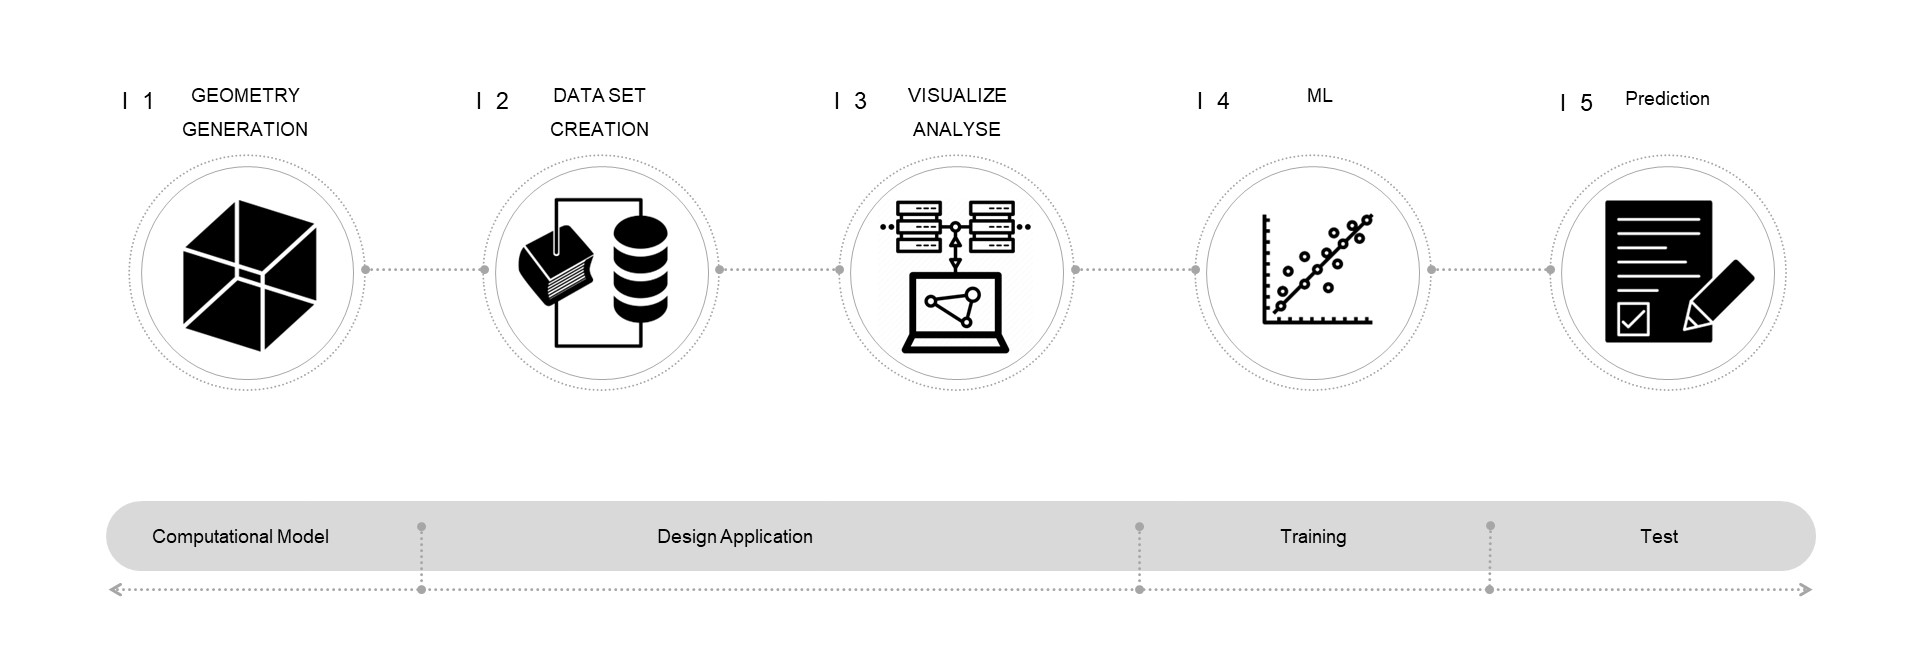
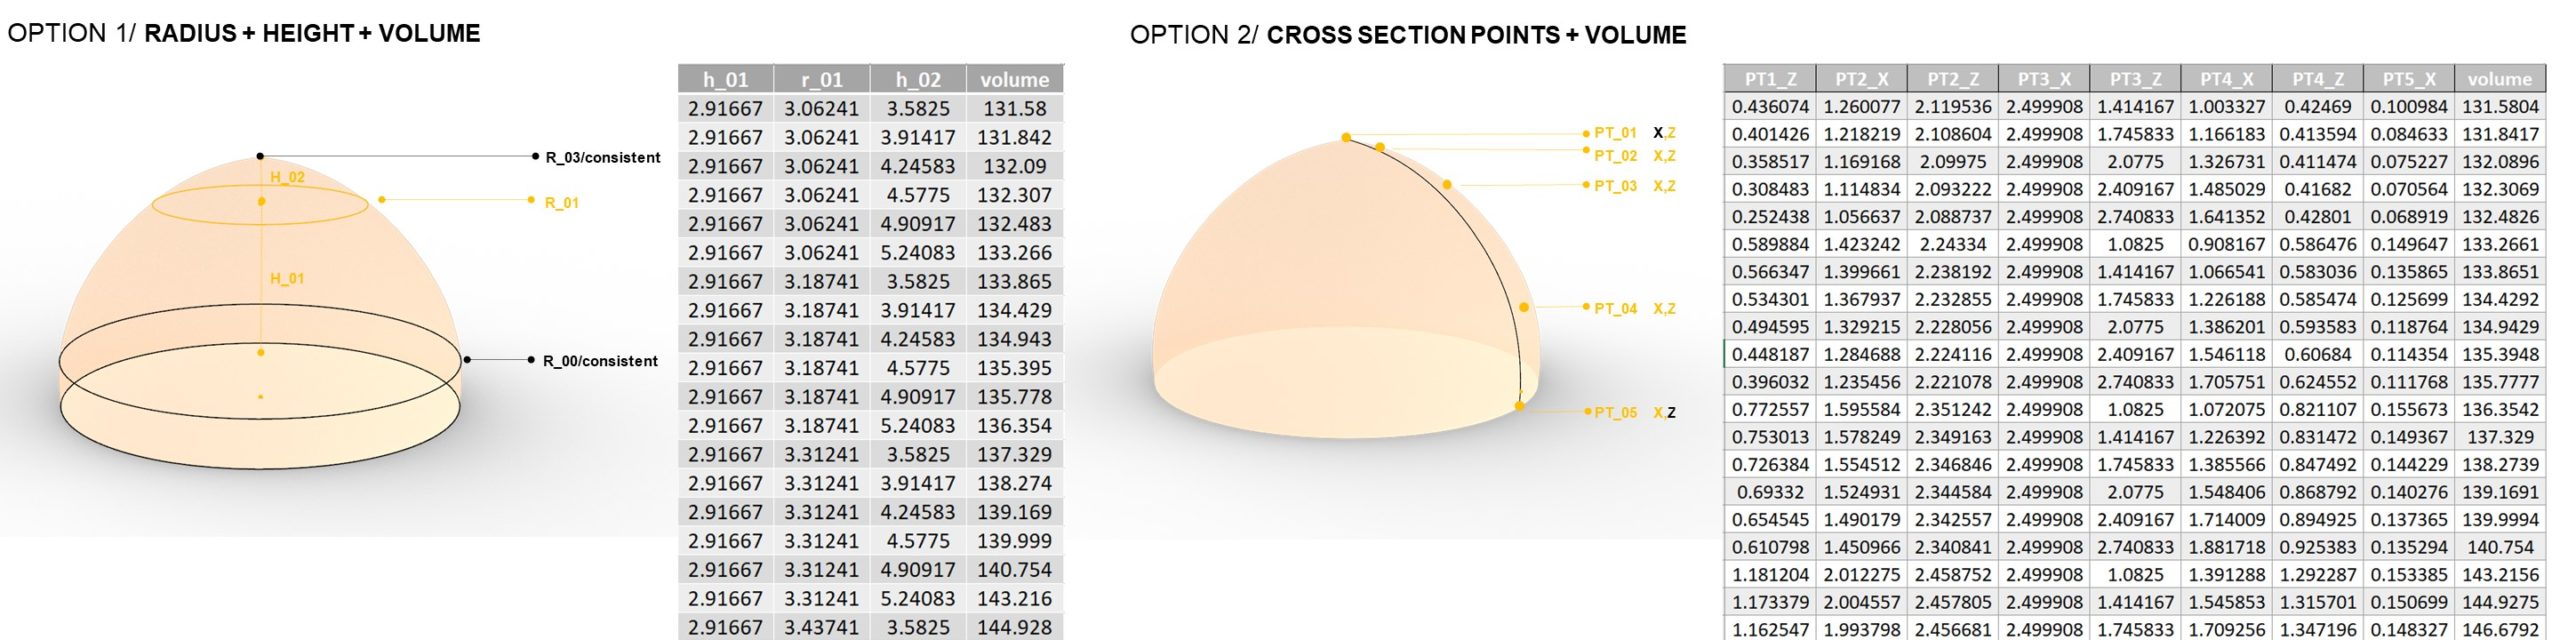
l GEOMETRY GENERATION
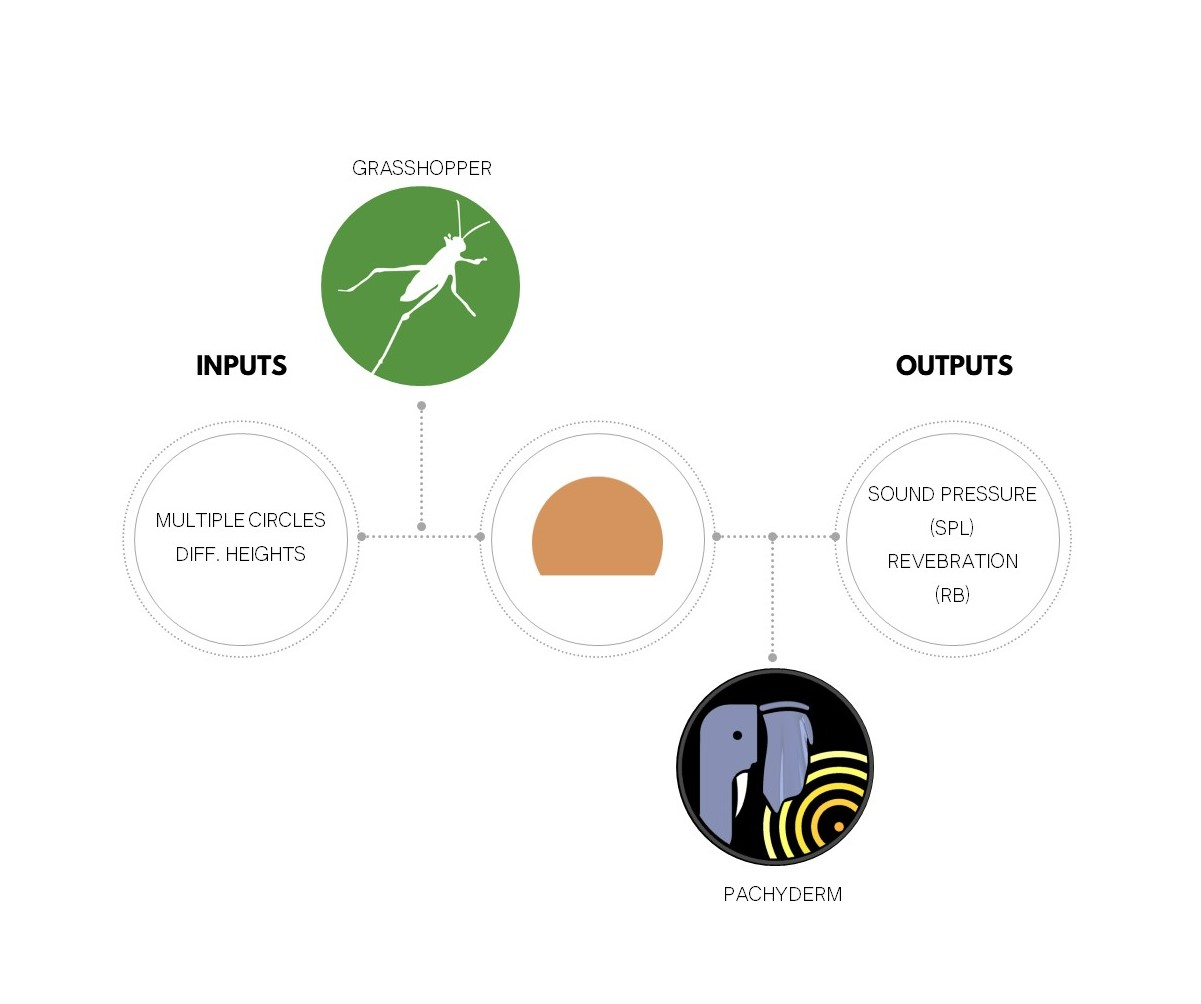
1. The domes are generated in a grasshopper with multiple circles placed at different heights.
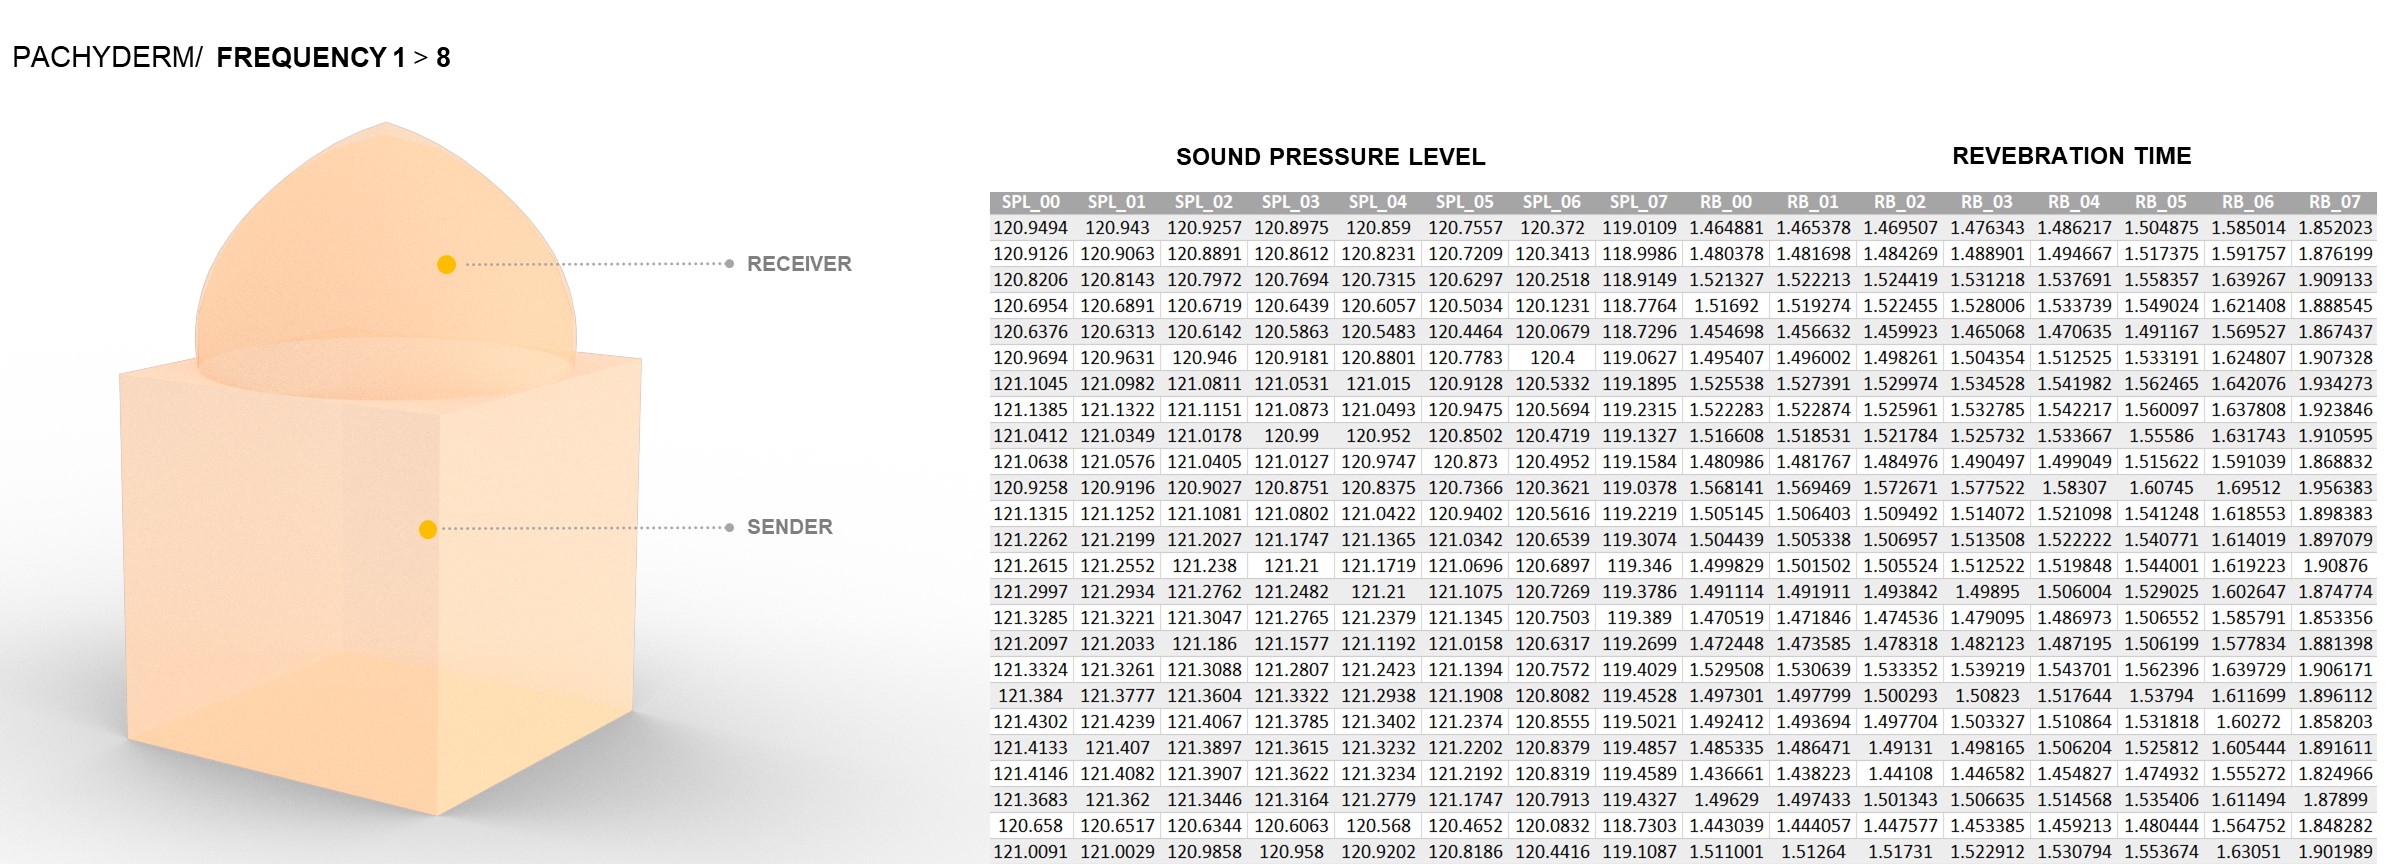
2. The acoustic parameters of the domes are simulated in the pachyderm plugin in Grasshopper.
3. After the simulation on the pachyderm. We can get the simulated values for Sound Pressure Level(SPL), Reverberation Time(RB)
l DATASET GENERATION
1000 DOME SAMPLE

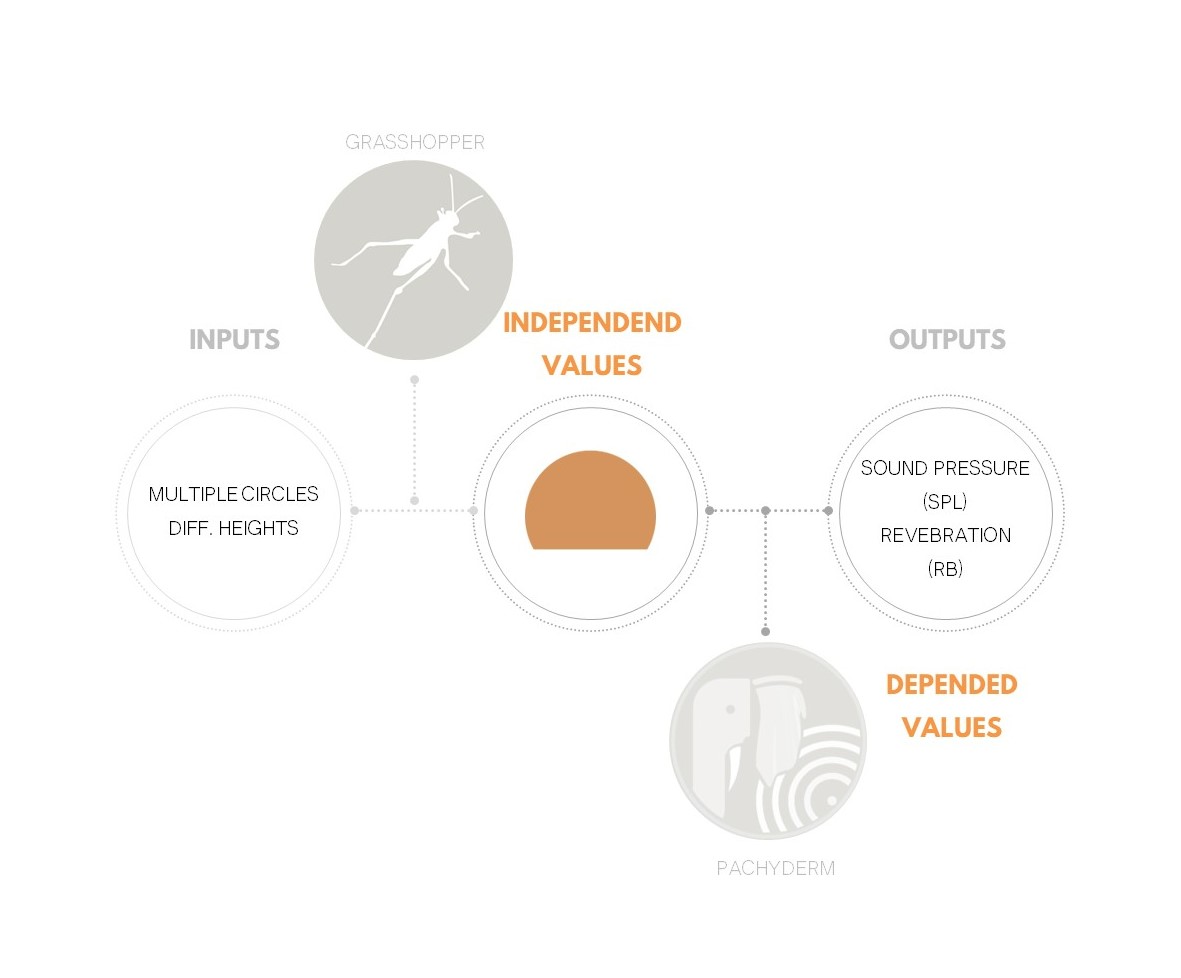
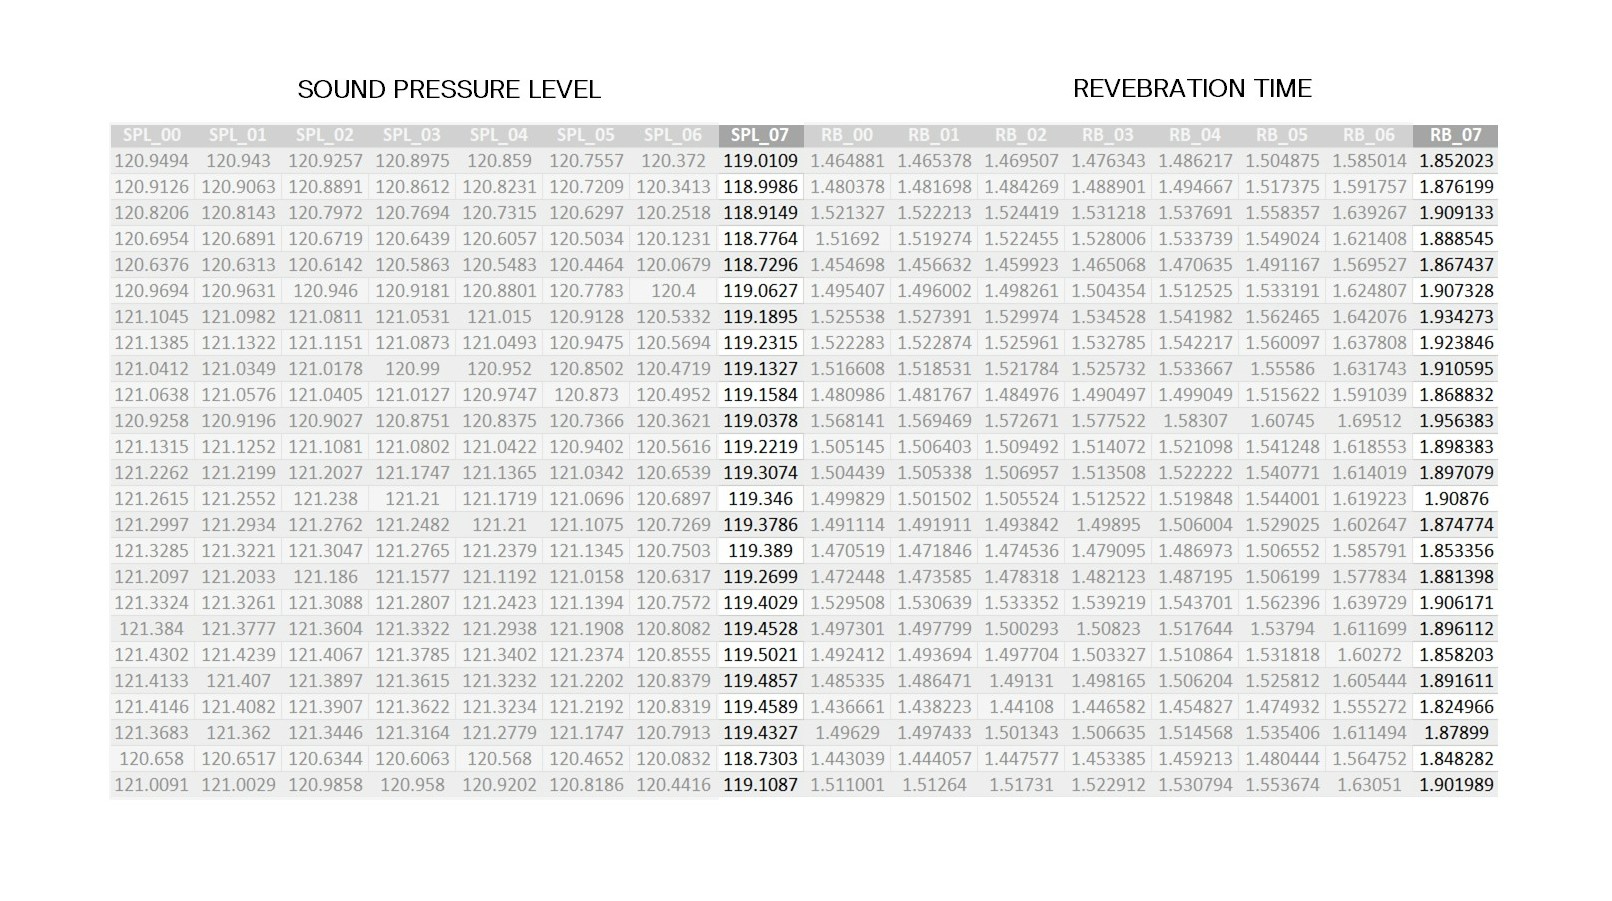
DATASET/INDEPENDENT VALUES
DATASET/DEPENDENT VALUES
l FEATURES/RELATIONS

GEO
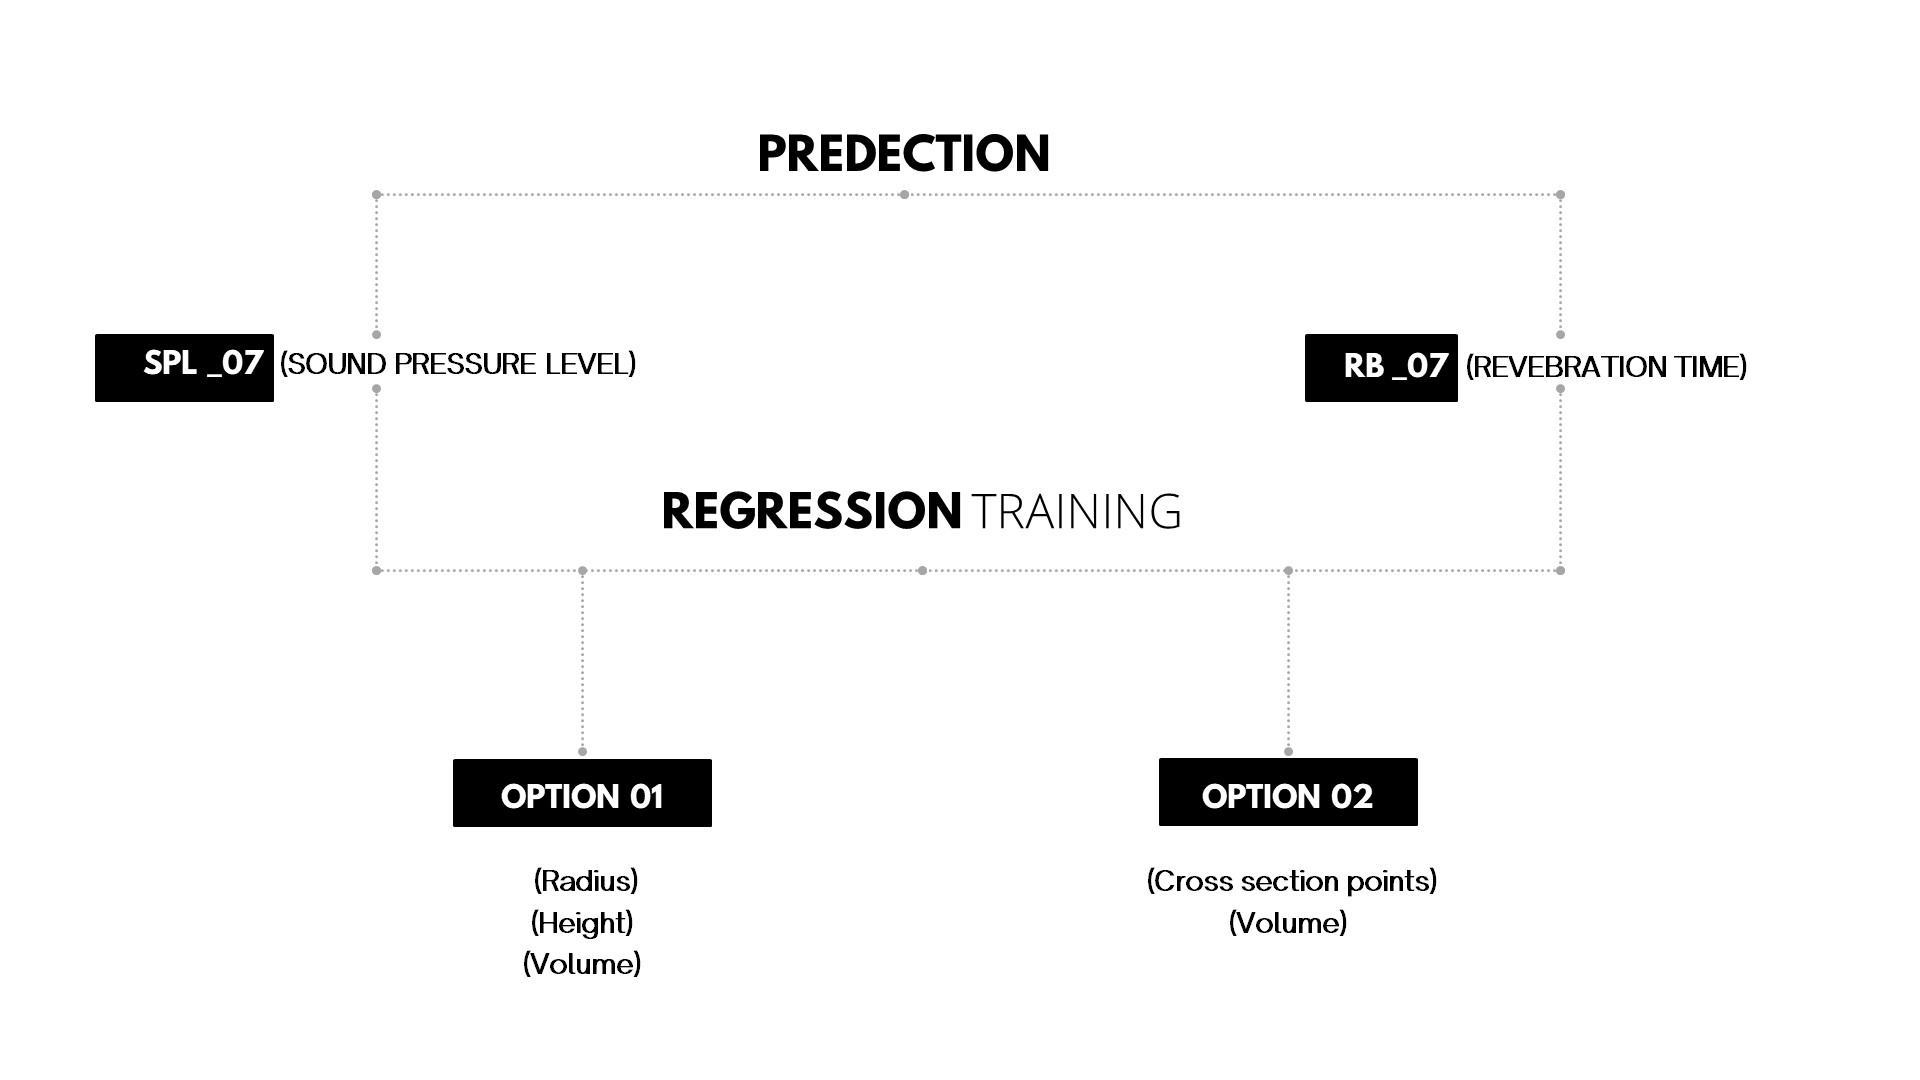
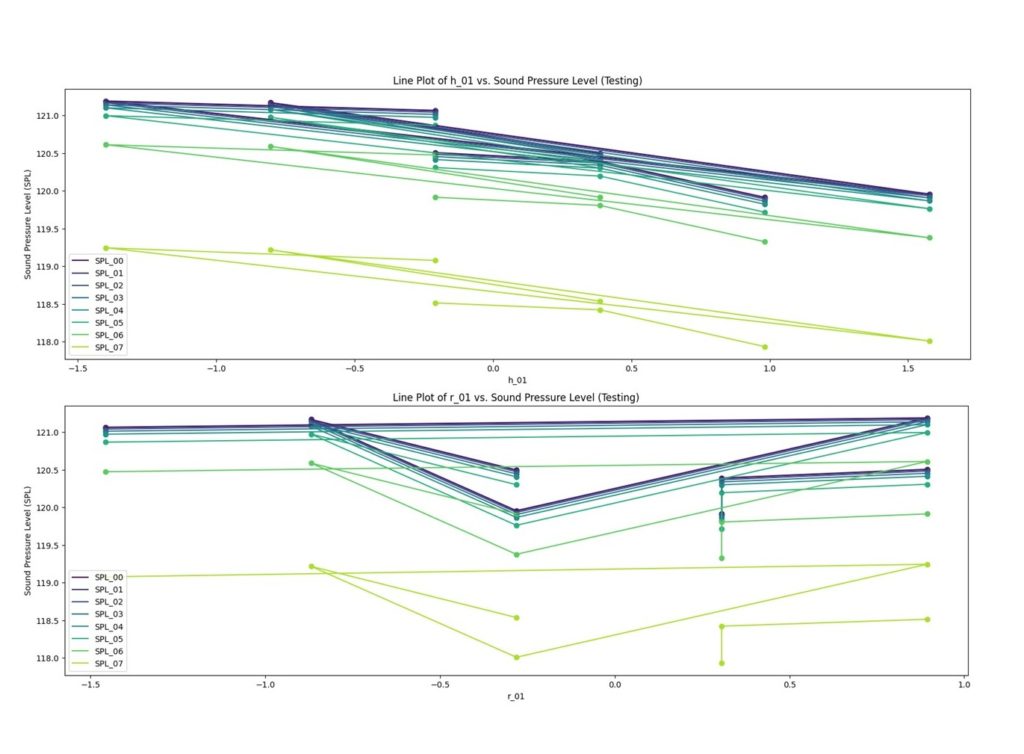
By plotting the SPL and the RB values. We can conclude that SPL07 and RB07 have the most variance whose values can be taken further for the machine learning model.
METRY vs. SPL
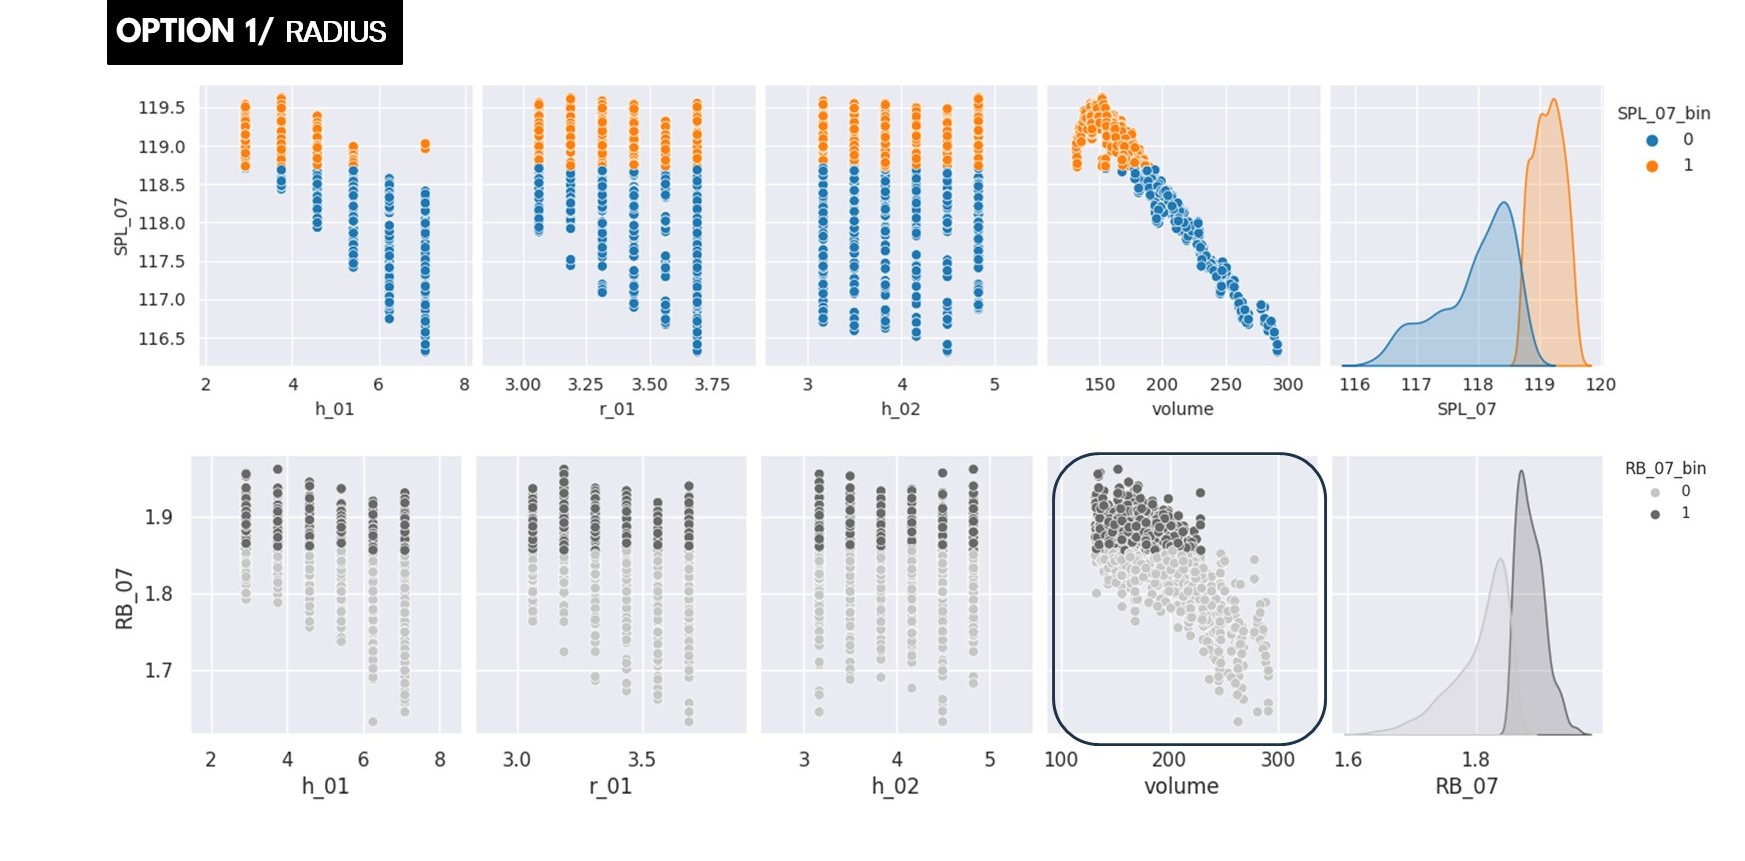
Frequency most variance to the geometry variables is: SPL_07
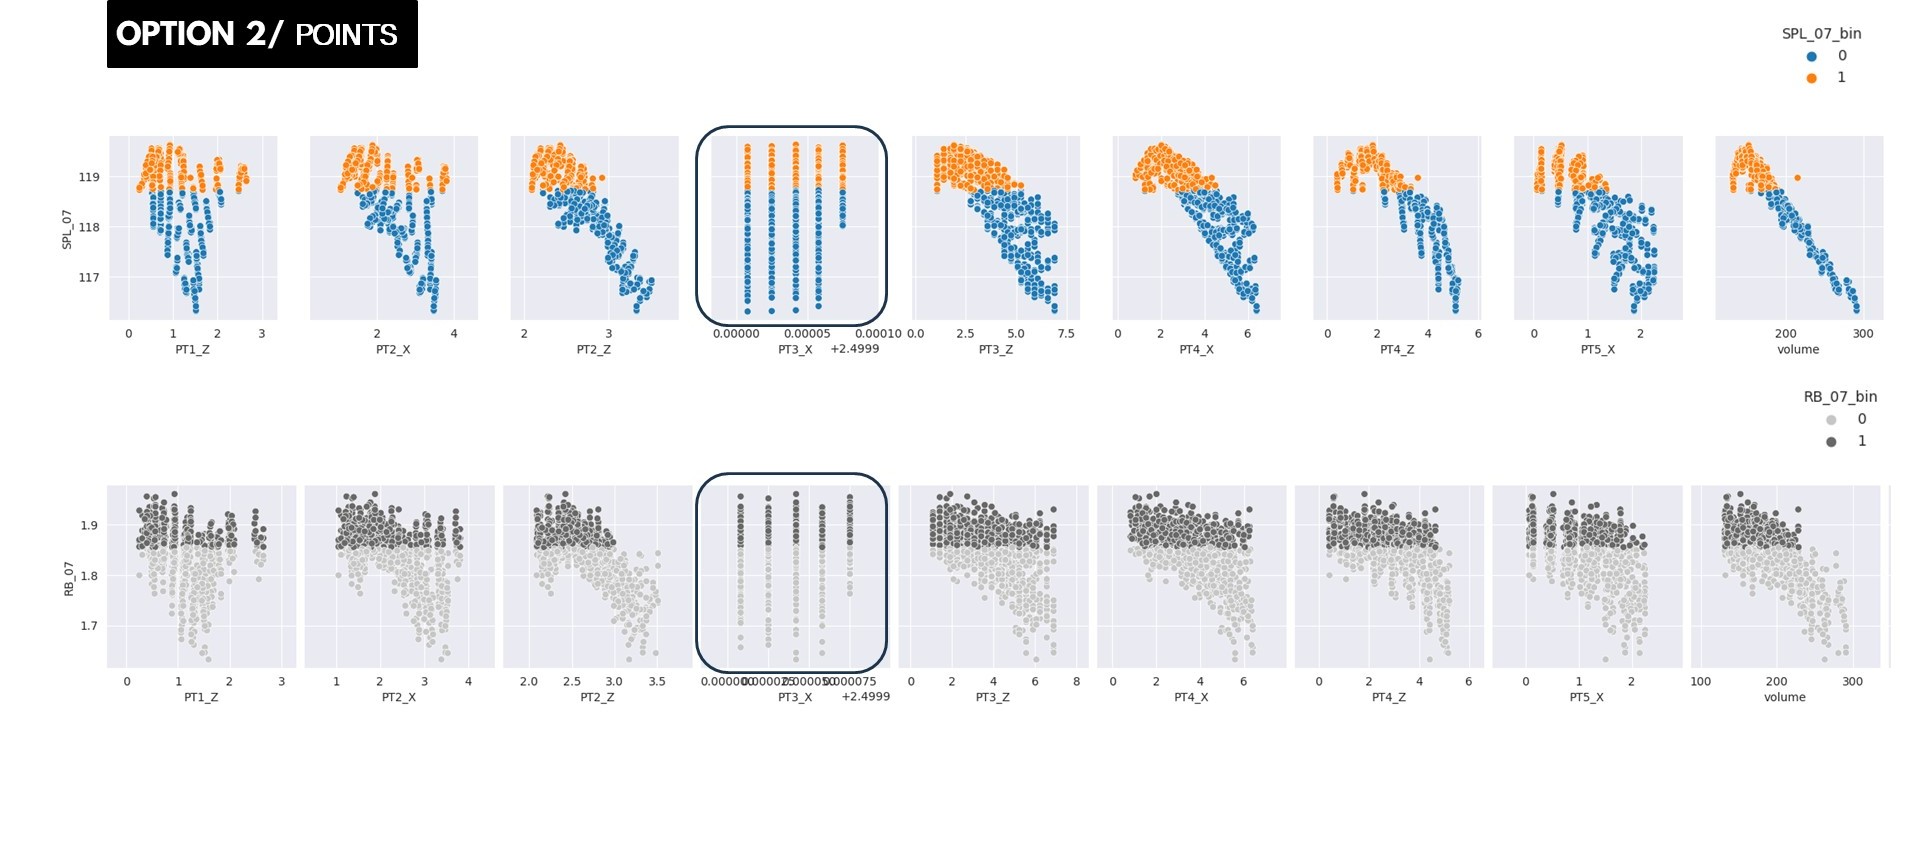
Using only SPL_07 & RB_07

Option 1 has more variance in the dataset while option 2 has a smaller range of variance. Therefore option 1 can give a better prediction,
l FEATURES/PCA
Option 1 : The values of SPL means and RB means as a bin for visualization. There is a negative correlation for the volume for both SPL and RB but the RB is more noisy.
Option 2 : The values of SPL means and RB means as a bin for visualization. There is a negative correlation for both SPL and RB but the RB is more noisy. We can conclude that the RB values will not give a meaningful prediction.
Option 1 : r_01 is the most dominant feature.

Option 2 : PT3_X is the least dominant feature.

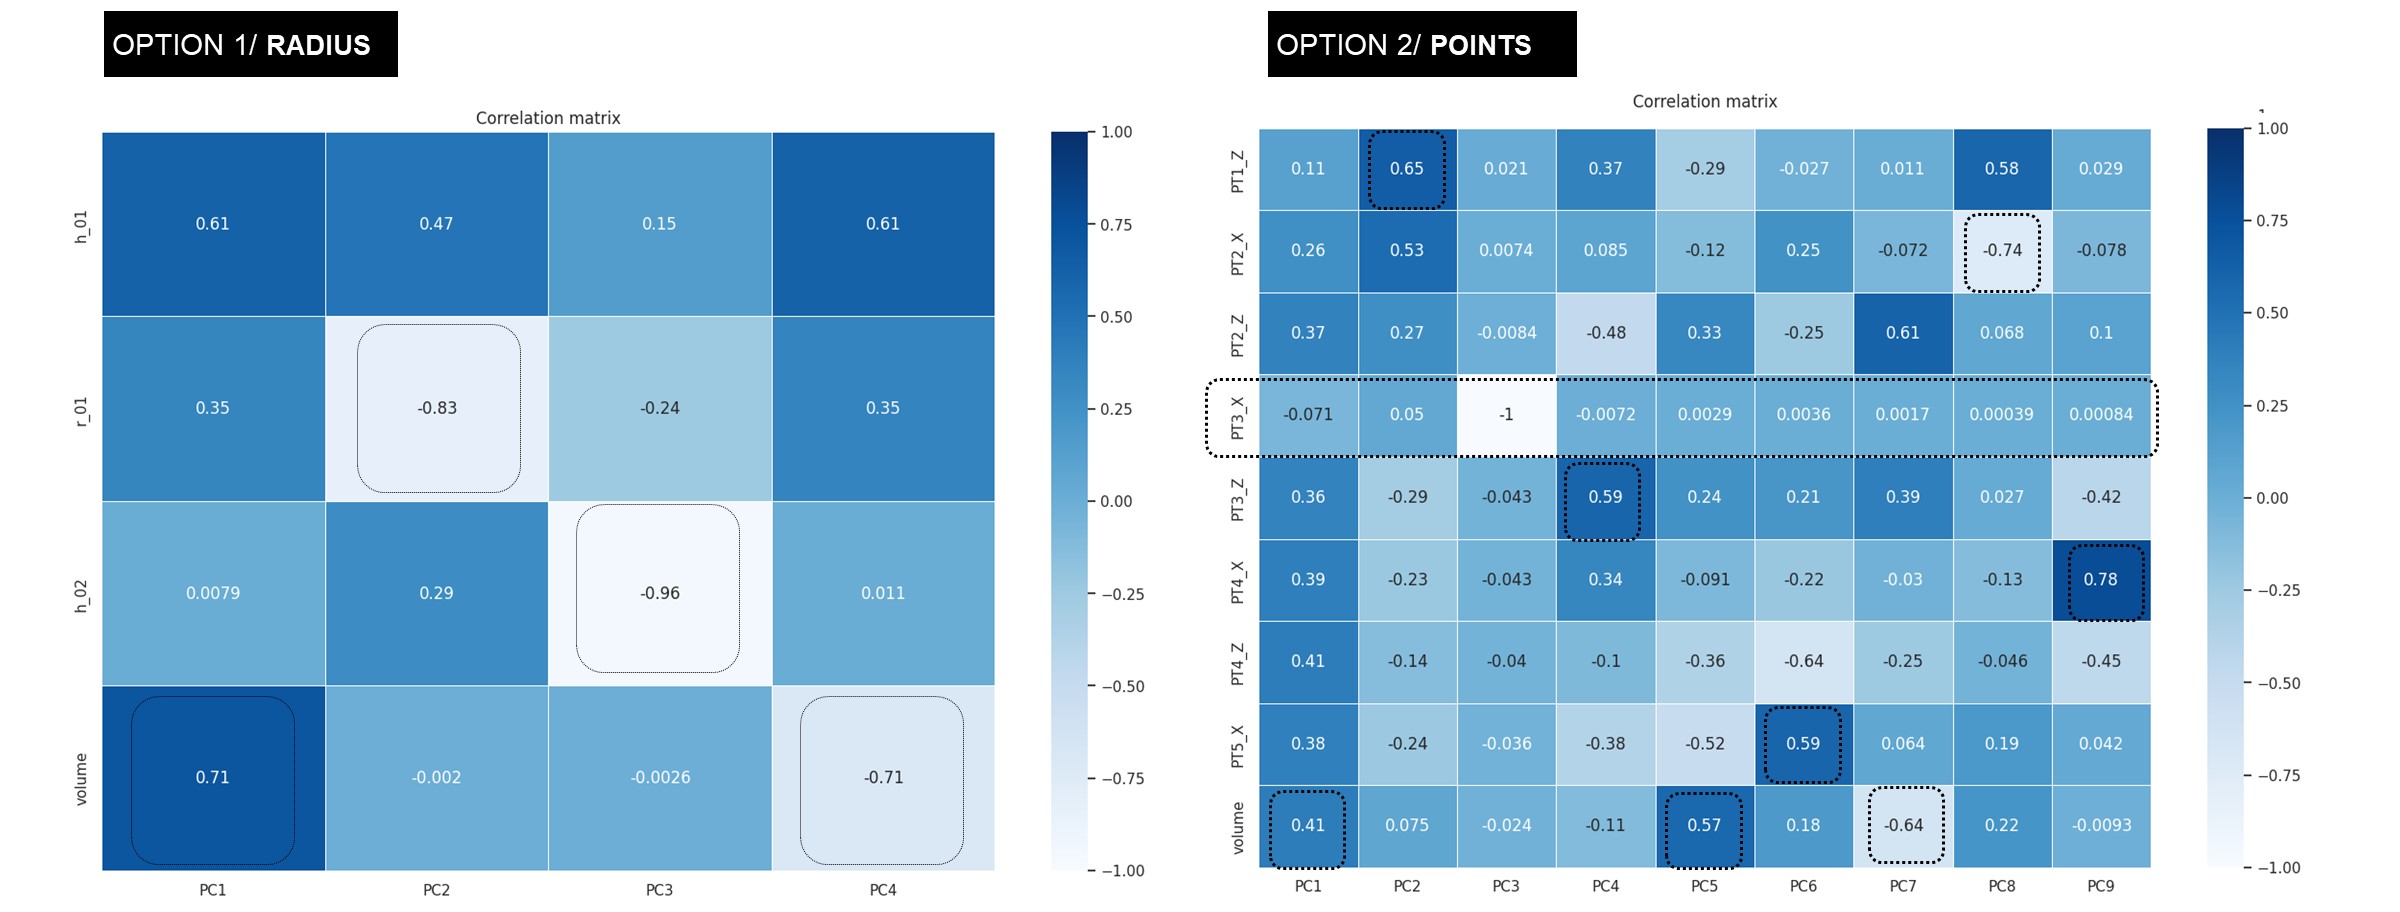
Dropping PT3_X from OPTION2/POINTS
l TRAINING SPL
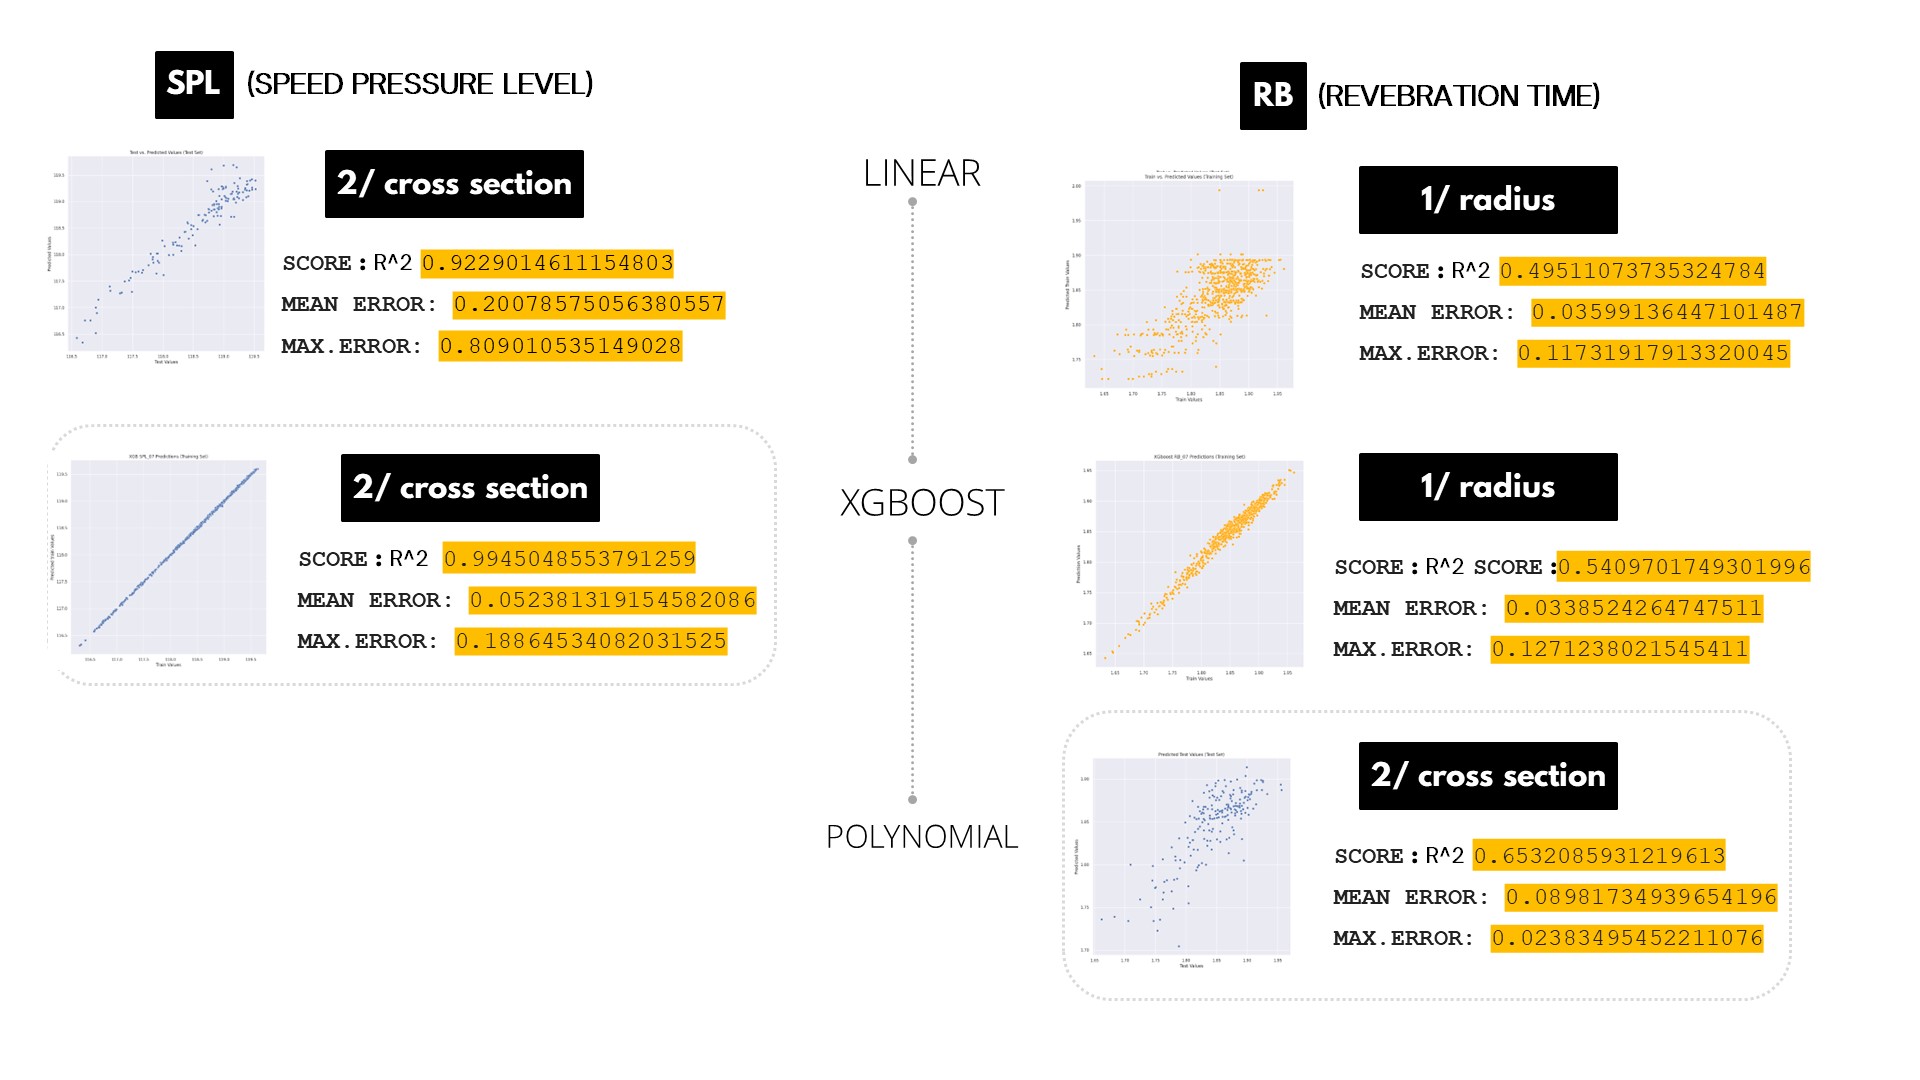
LINEAR REGRESSION MODEL

XGBoost MODEL

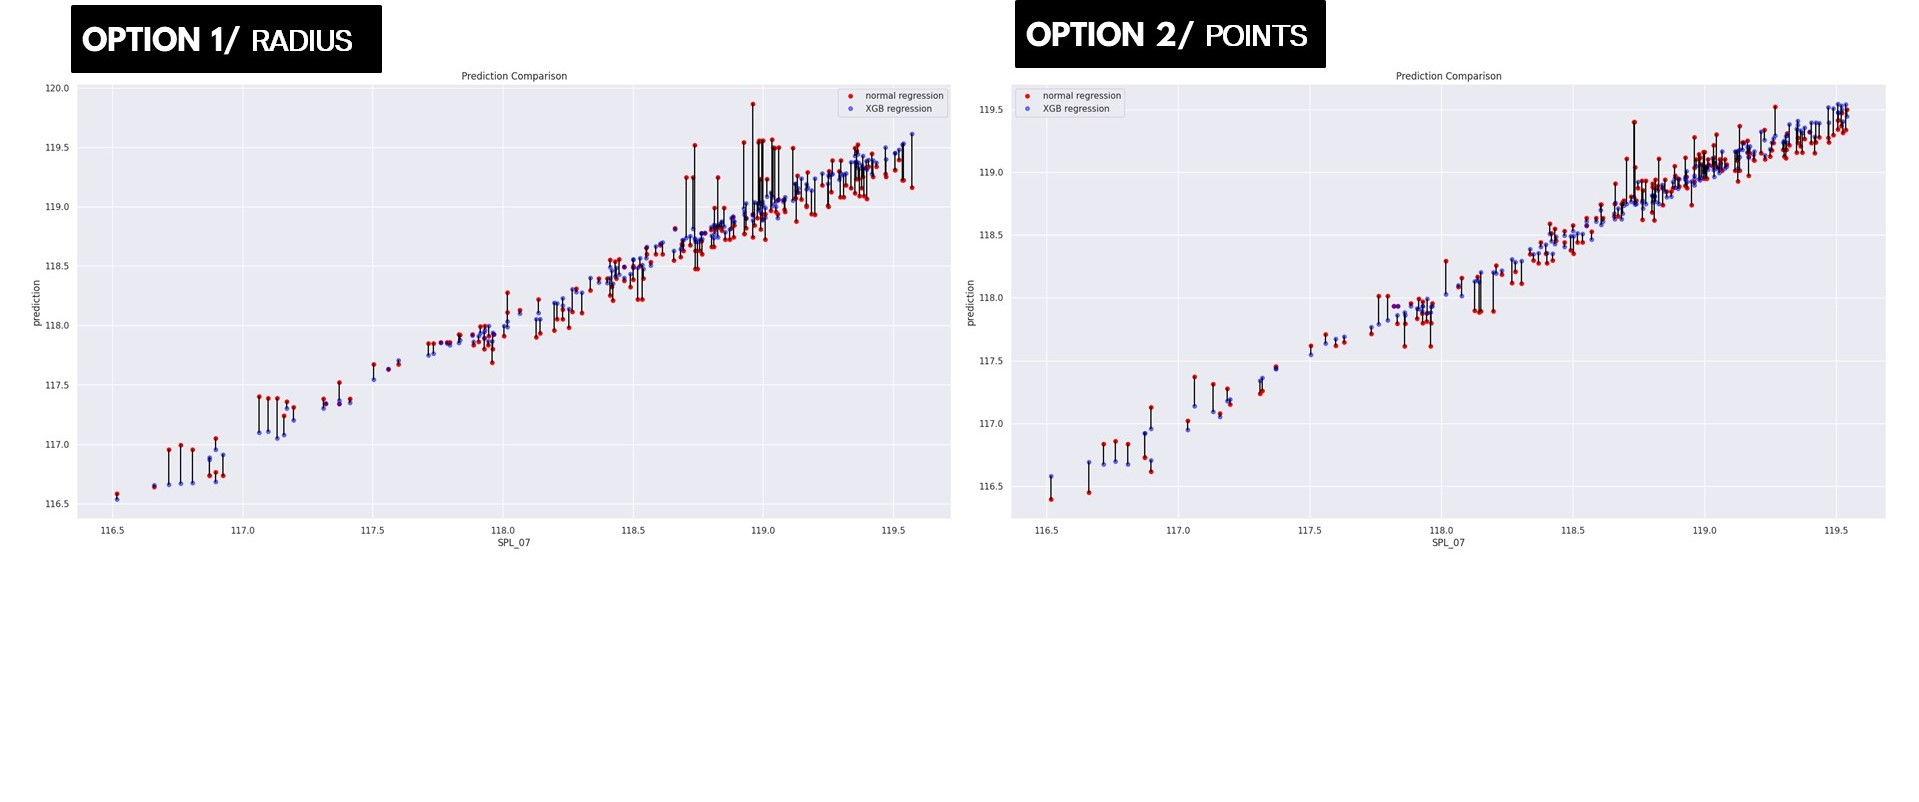
LINEAR REGRESSION VS XGBoost
l TRAINING REVERBERATION TIME
LINEAR REGRESSION MODEL

XGBoost MODEL

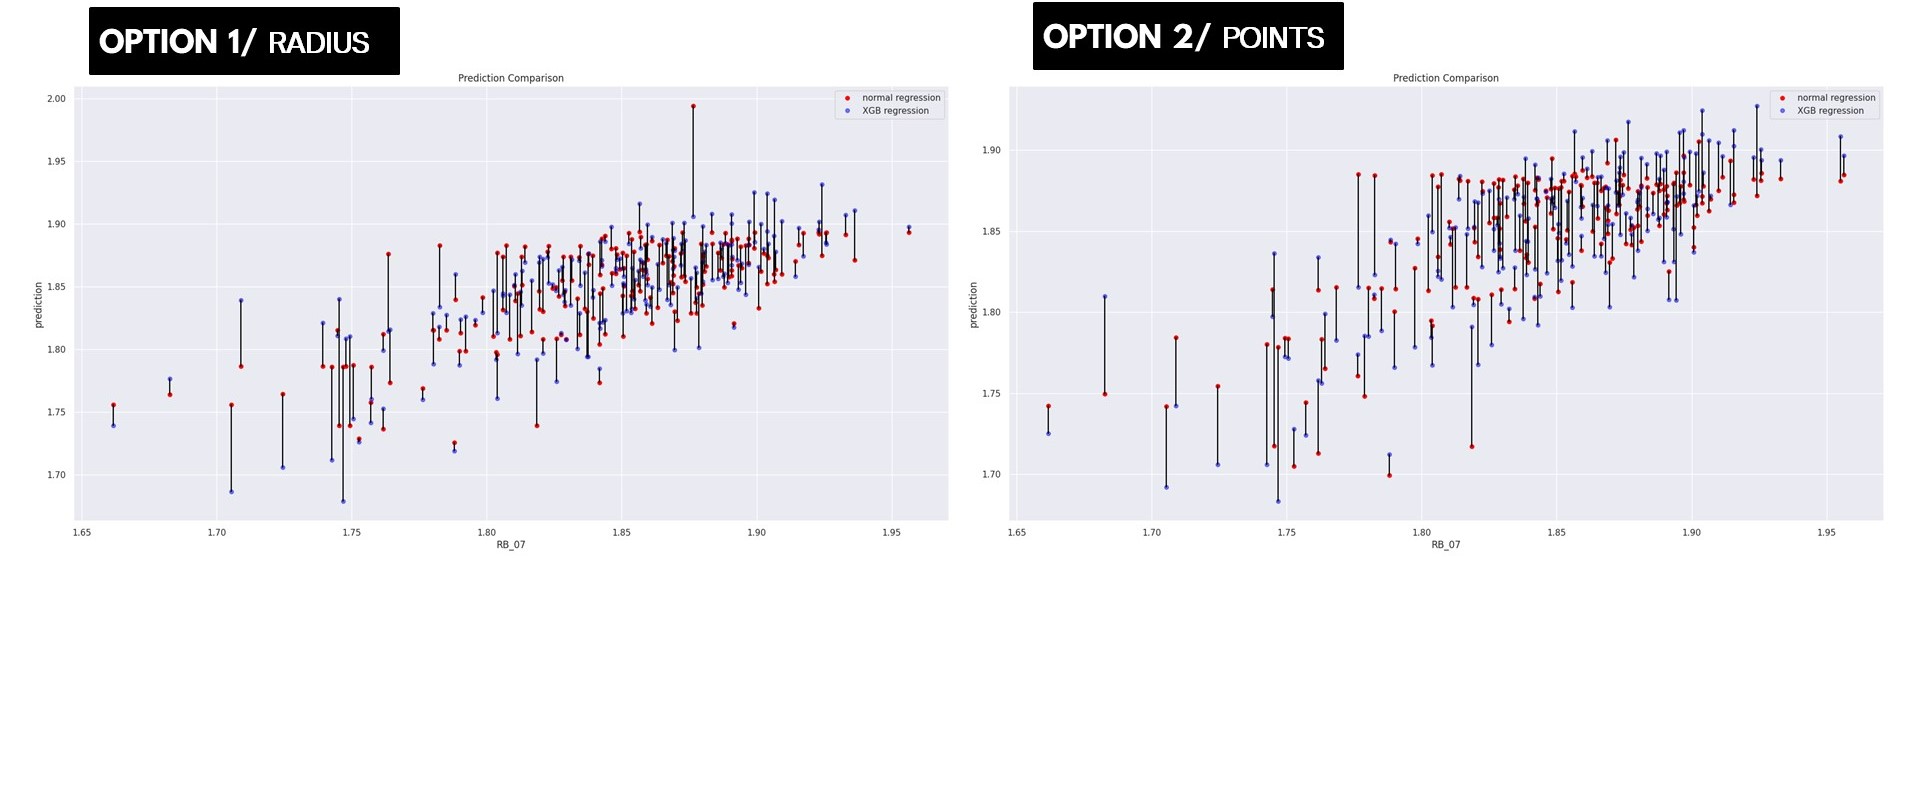
LINEAR REGRESSION VS XGBoost
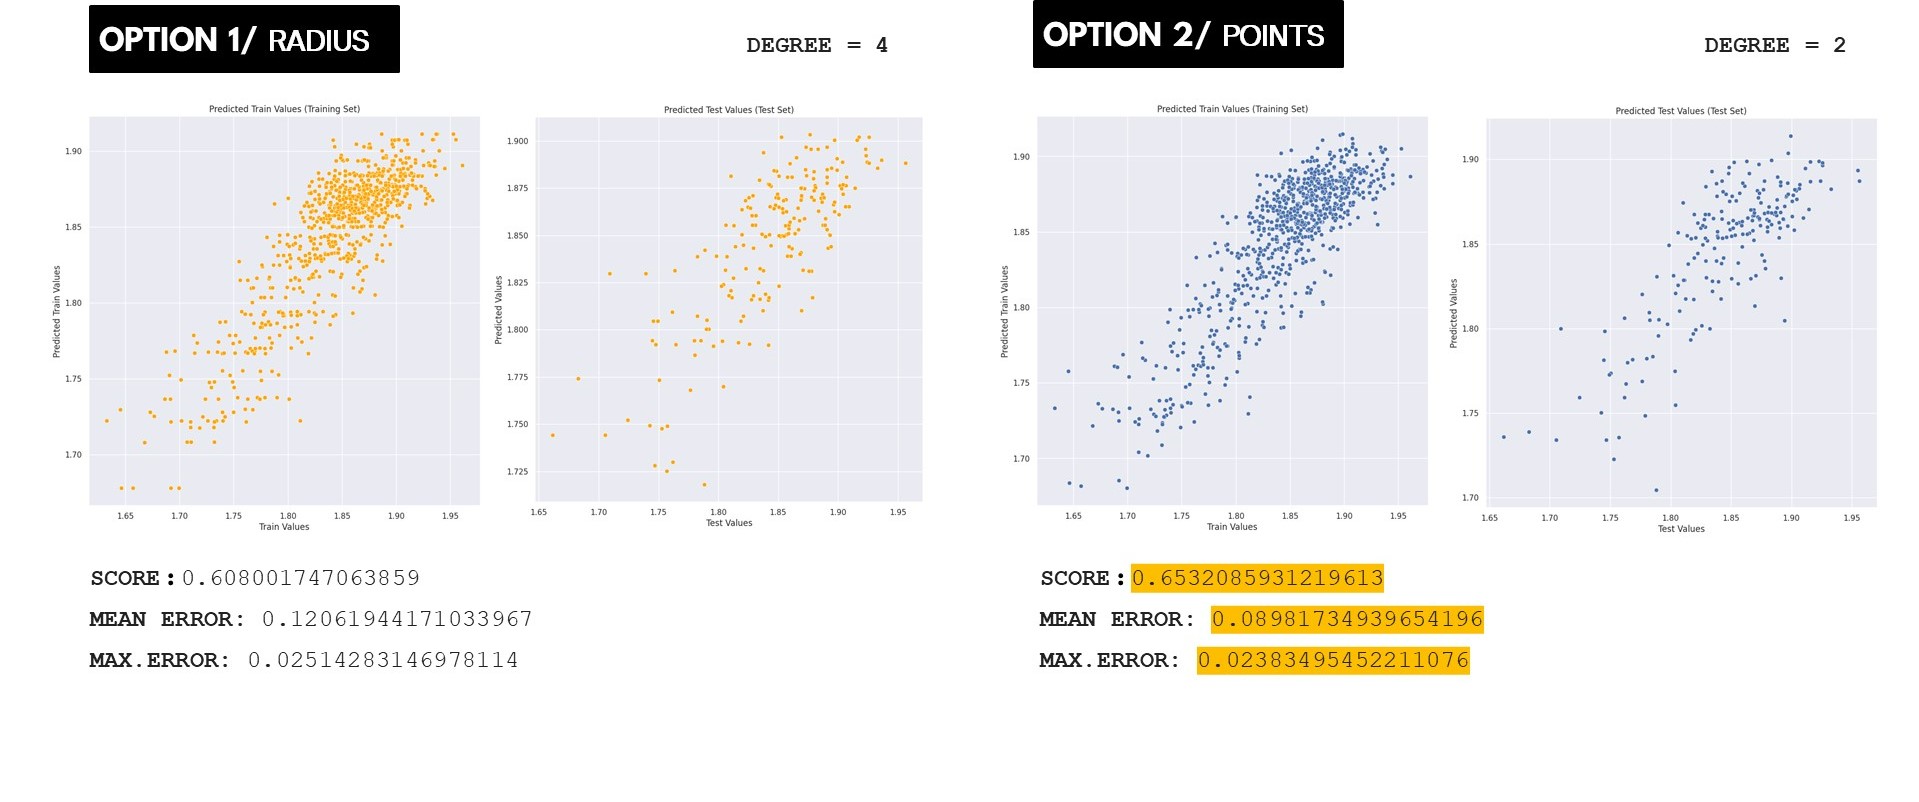
POLYNOMIAL REGRESSION MODEL
CONCLUSION
ORIGINAL vs. XGBoost PREDICTION


Visualizing the relationship between Dome Features and original SPL values
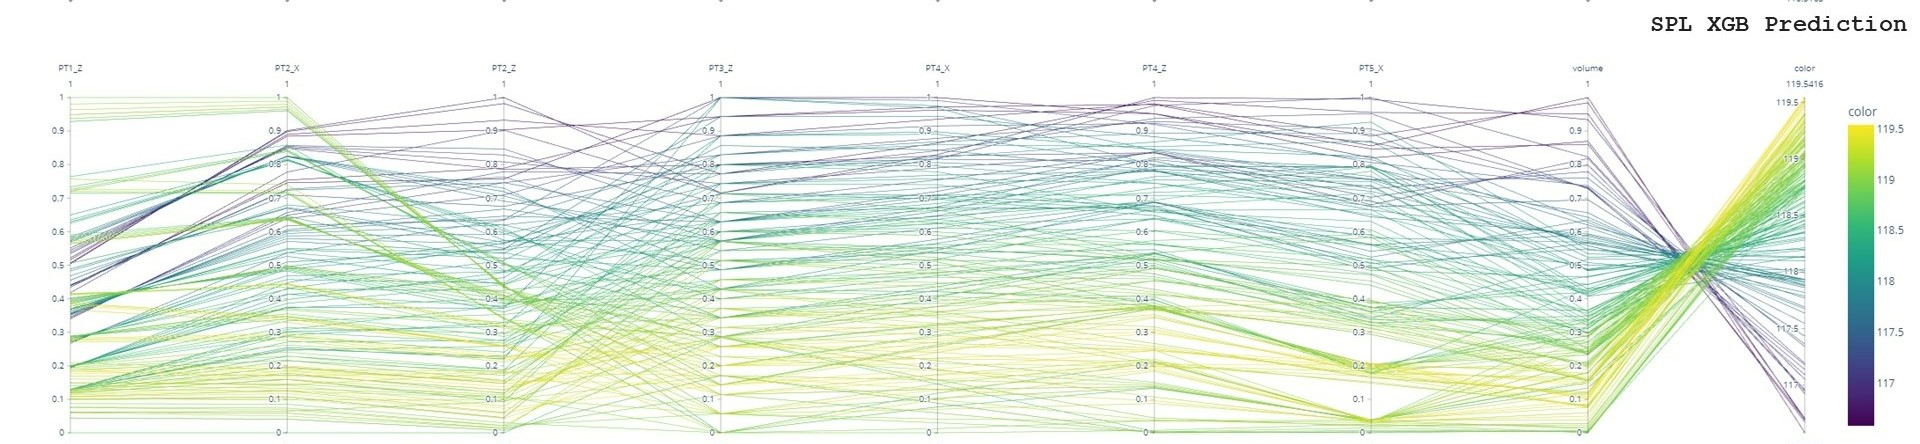
Visualizing the relationship between Dome Features and predicted SPL values
