
Miami cannot pay for its affordable housing without additional funding. Since 2020, the market has been scorching hot – with average rent rising at quadruple the pace of median income (Zillow, U.S. Census). New opportunities at the federal, state, and local levels will open budget to spend. But, conflicting federal and state geographies of interest create confusion around funding priorities (HUD, FHFC). The questions to answer are what do those priorities cost and are those costs worth the opportunity they create. This research introduces the trends driving the need for funds and explores challenges with set priorities.
The Problem
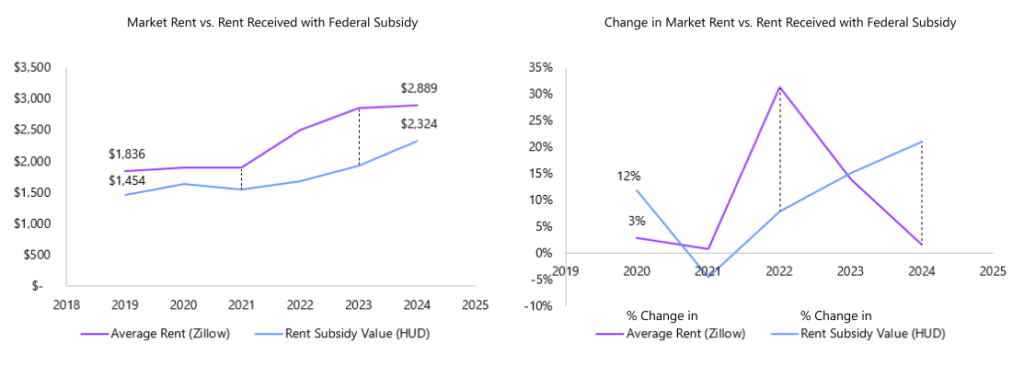
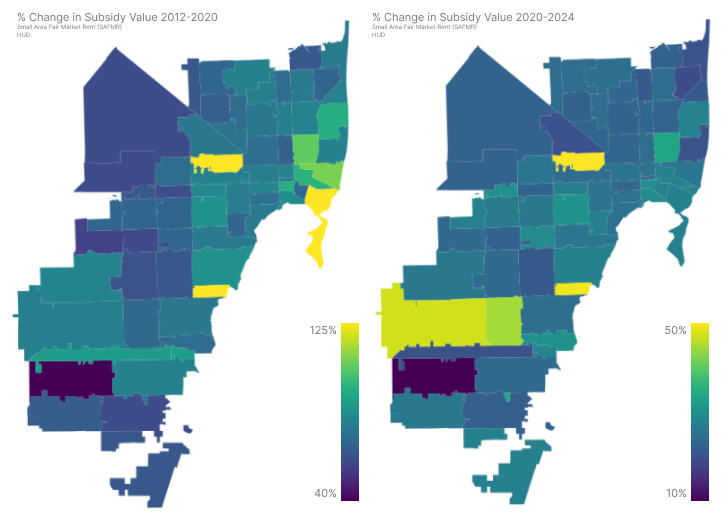
The government cannot, by law, catch the market | Miami’s housing market was the hottest in the nation last year. The average home price grew 11% and average rent grew 11.5% (Zillow). Market-rate rental property owners can respond to the temperature increase but owners of subsidized property depend on the far less dynamic federal and state governments for premiums on rent. Ceilings on annual increases in rent payments from programs place a burden on affordable housing developers working to meet rising insurance, tax, and service costs.
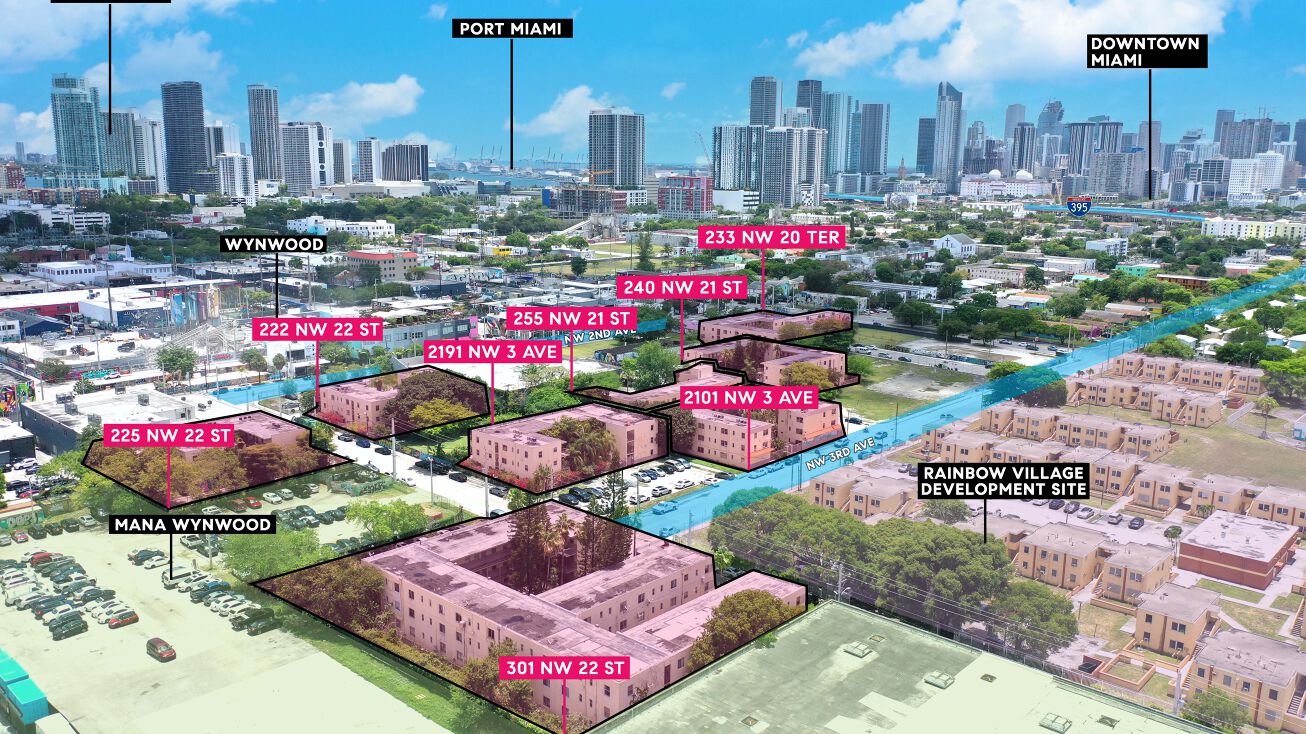
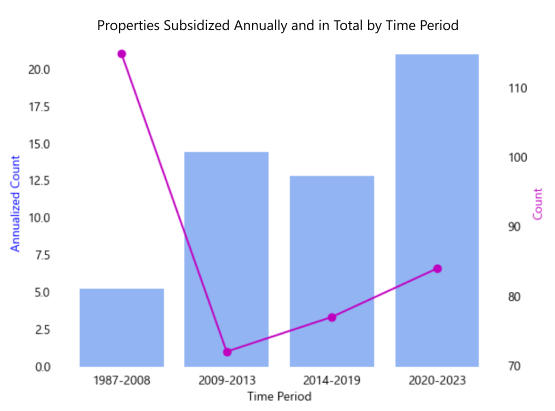
This affordable housing was concentrated where rent growth is the lowest. | In 2008, the Global Financial Crisis was localized in Miami as large-scale defaults. Developers with cash-on-hand were able to not only buy foreclosed property but also the remaining industrial parcels in between. In 2010, Miami’s land was forever altered by the change to a Form-Based Code, allowing for higher density development with new building fit to the allowable form rather than use. Formerly industrial Wynwood and Design District and formerly condominium Brickell and Edgewater were transformed into playgrounds and havens for young adult and snowbird consumption. Returns to this strategy were realized as the market recovered and reach unanticipated levels with the start of COVID-19. Since March 2020, market rent in the City of Miami has risen 53%.
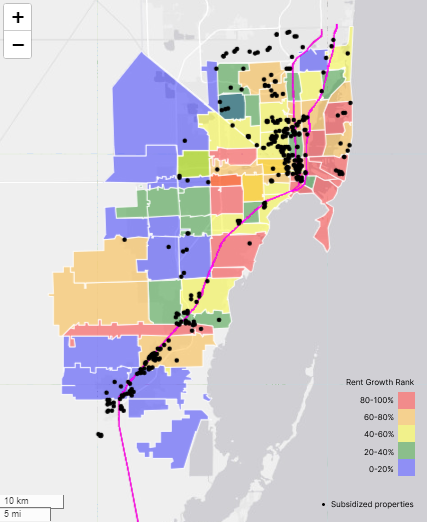
Consistency in strategy concentrates poverty and public risk | Subsidized housing is concentrated where rent growth is low and opportunity
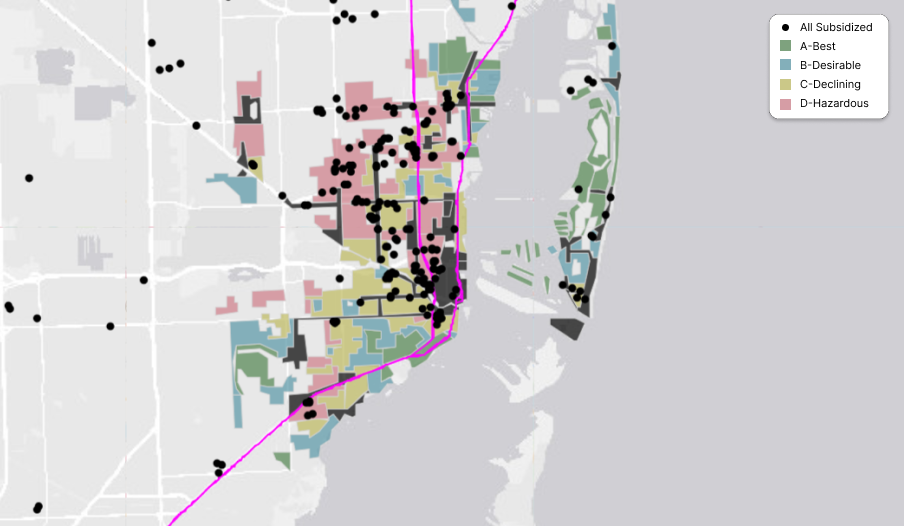
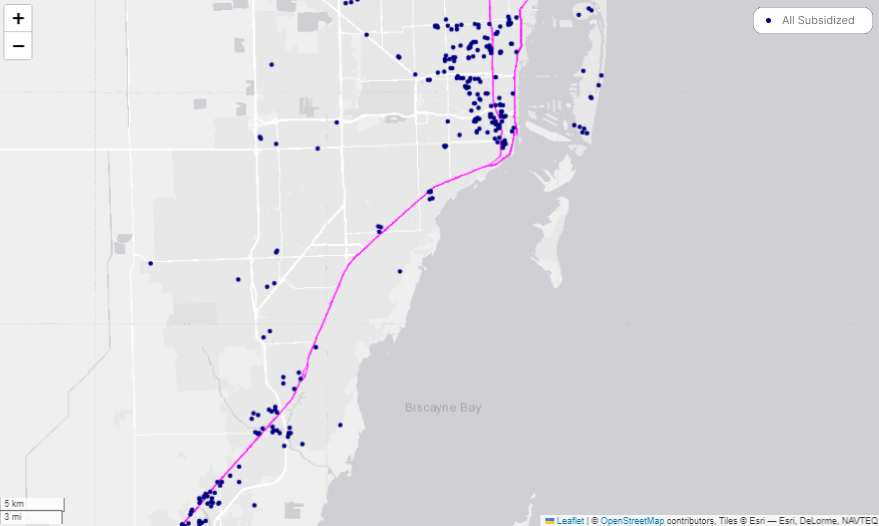
- Miami’s placement of affordable housing development and new development is tied to US1 which turns into Interstate 95 (I95).
- Affordable housing developers place properties where they gain boosts in financing from the federal government. The I95 corridor has low drive-times, a metric typically used to measure opportunity.
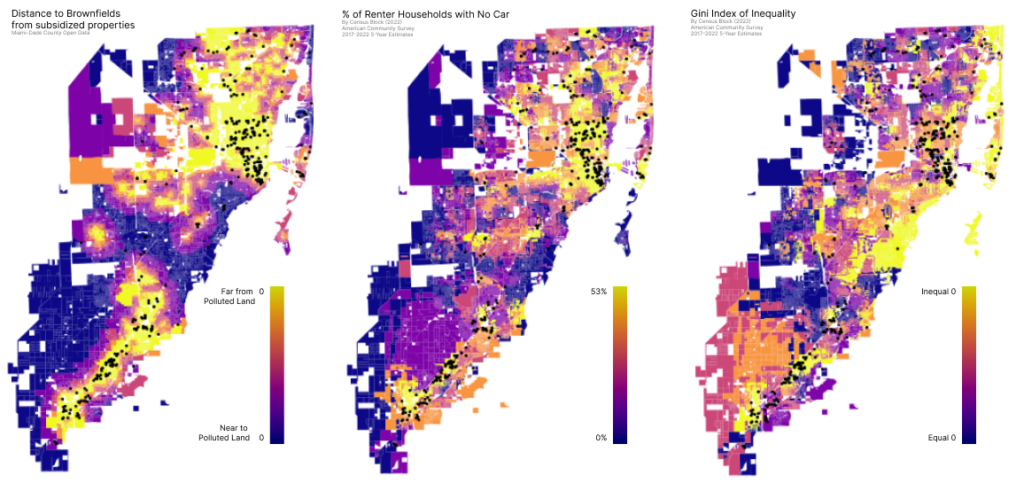
- The start of I95 runs along Little Havana and Overtown, where land was marked as hazardous in 1938 and served as the attractor for affordable development (University of Richmond). The North-South corridor is also where Miami clustered industrial development, polluted land today. Federal incentives support the transition of areas of high opportunity and past industrial pollution, brownfields, through the qualification of census tracts and designation of areas as Superfund sites. This allowed affordability to pencil without much City aid only within the bounds of structured incentives.
The Current State
The ecosystem for affordability is richer | The United States, Florida, and Miami-Dade are all working to increase affordability through the establishment and revision of subsidy programs.
- Lowering the minimum funding for 4% LIHTC | A lower floor for private participation in affordable housing projects opens the door for new developer interest. If the new tax package allows for the 50% bond test to lower to 30% on 4% projects, non-affordable housing developers will be enticed to proforma subsidized units. With this induced demand, states like Florida, with available bond cap, can build more units or spend more on opportunity.
- The Live Local Act opens the door for mixed-income strategies | In 2023, Florida welcomed new and rich subsidy programs to support households earning 60-140% of the Area Median Income. These programs will not run forever, afforded by COVID-response allocations, and are competitive at the state level. They bring variety to the world of subsidized housing and interest from previously solely market-rate developers.
- Miami-Dade County may dedicate $800M, a third of new Miami-Dade County bond funding to affordable housing.
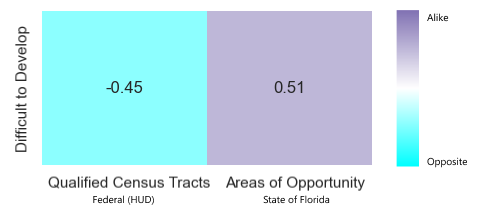
The State and Federal government have conflicting geographic interests | The State increases funding allocations for properties in “Areas of Opportunity” and Federal government increases the relative value of subsidies 30% where property in areas of high opportunity (AOO), qualified census tracts (QCTs) and areas which are difficult to develop (DDAs). AOOs match DDAs, defining opportunity as that for the developers and QCTs match historic development locations, where drive times are low and affordable properties fail to collect rent due to rapid cost escalation.
Without new funds, deeply affordable properties are sitting ducks.
With the County taking on new debt, the questions of for who and where persist.
Conclusion
Stability is threatened by degrading affordability near Downtown and in West Kendall.
The definition of opportunity should be segregated by target population to maximize the value of new funding.
- As expected, I95 and U.S. tract to historic placement of tax credit properties.
- Unsurprisingly, so do brownfields, areas previously contaminated due to industrial use.
- The areas where affordable housing was placed were but are no longer considered opportune for the state but are for the federal government, creating a conflict of interest when investing in tax credit properties.
- Rent is rising fastest where rent is lowest reducing the possibility for naturally-occurring affordable housing (NOAH).
- What do I think about the placement of future subsidy allocations?
- The qualification of Florida’s census tracts may change.
- The inverse correlation between Florida and federal priorities bifucates FHFC funding decisions in Miami-Dade.
- Federal priorities are where affordable housing has been placed historically and are where incomes are growing.
- Federal priorities trump FHFC when utilizing 9% tax credits.
- State priorities with a lowered 4% bond test will need to fill a larger gap if placed in state-priority area.
Questions without answers:
- For who?
- Are good schools where family housing is placed?
- Are good healthcare facilities where elderly housing is placed?
- Are special needs units where parks are near?
- Where?
- Is drive-time made a priority for people who do not drive?
- Should touristic green spaces be considered as accessible to residents?
- Should brownfields be considered attractions or deterrents for new development?
This data will be collated and mapped for decision-makers to economically act on behalf of target populations.
Methodology
Analysis
import pandas as pd
import numpy as np
import geopandas as gpdfrom shapely.ops import nearest_points
from geopandas import GeoDataFrame
import osmnx as ox
import networkx as nx
from shapely.ops import nearest_points
Visualization
import matplotlib.pyplot as plt
from matplotlib.ticker import FuncFormatter
import seaborn as sns
from shapely.geometry import Point
import pyreadr
from tkinter import Tk, font
import folium
from folium.plugins import MarkerCluster
from branca.colormap import LinearColormap
from PIL import Image
Properties of Interest
Create one dataset with all subsidized properties and their relevant funding programs.
- Merge the GeoDataFrames based on proximity (within 100 feet) using a left spatial join.
- Match columns with common information (Geographic, Property, Funding)
- Create boolean flags for subsidy programs and target populations.
- Condense matching flags.
Understand development trends by year of allocation and location.
- Define boolean masks for outlier conditions of relevant factors (ZIP Codes, Funding Year, Market Rate %).
- Plot normalized gradient maps by zip code.
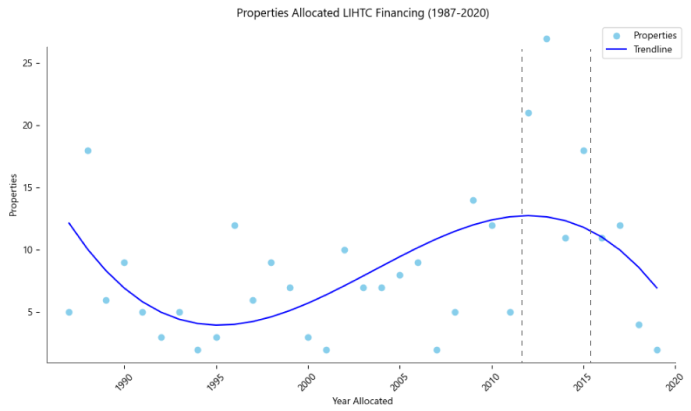
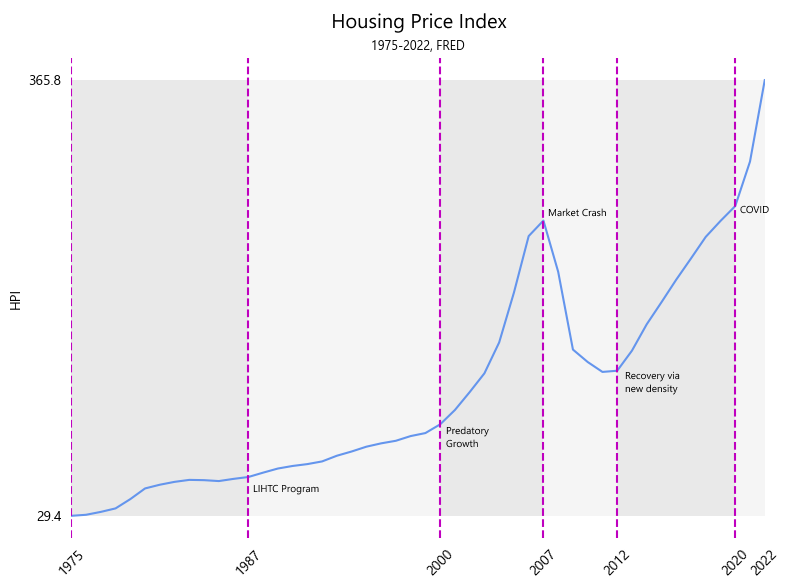
Assign time periods based on points of inflection in the Housing Price Index (HPI).
- Locate time periods of interest.
- Calculate annualized unit allocations.
- Assign relevant time periods by year:
lihtc_yr_alloc['time_period'] = pd.cut(years, bins=[1987, 2010, 2015, 2020], labels=['1987-2010', '2011-2015', '2016-2020'], include_lowest=True)
Context of Interest
Create one dataset at the census block centroids with stored parcel geometries.
- Find the centroid of the census block.
- Store the polygon geometry of the census block.
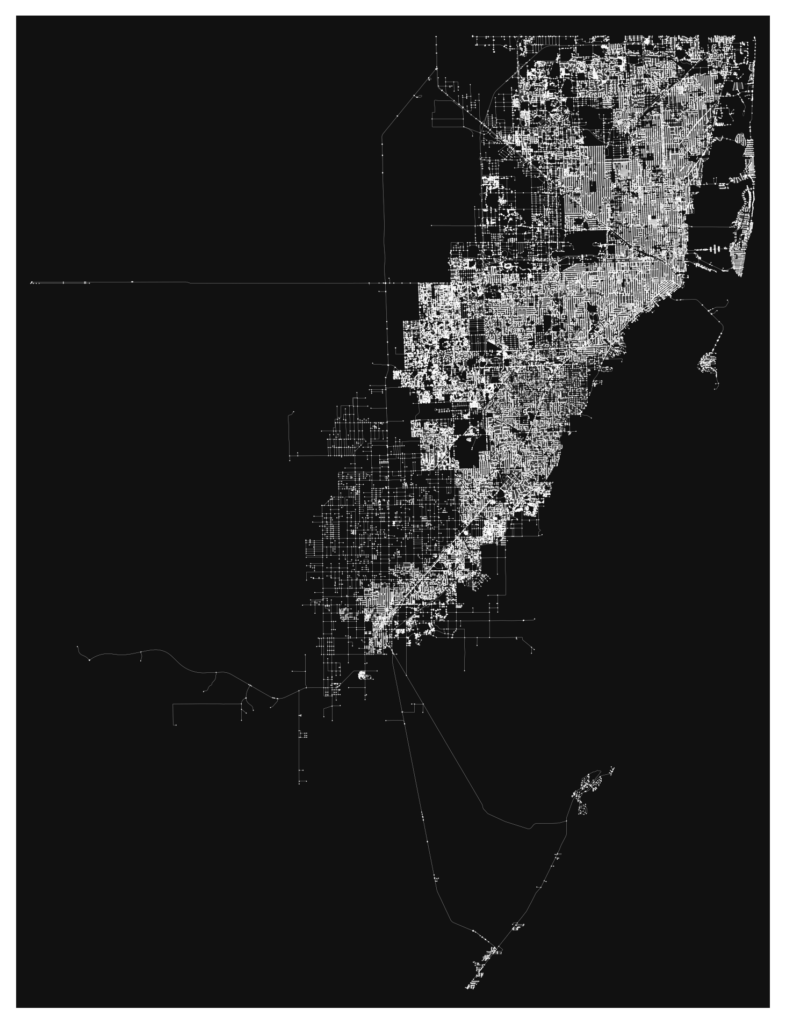
Create the OpenStreetMap drive network.
- Download the drive street network for the place.
- Alternatively, for a smaller area, download the drive street network within a bounding box and exclude isolated nodes and edges.
- Graph the roads (edges) and their connections (nodes).
- Apply an 100 meter buffer to the edges and convert from a linestring to polygon geometry.
Clean contextual information.
- Census Tracts
- Calculate the % of large multifamily units (> 50 units per property)
- Calculate the % of renter households without vehicular access
- Calculate the % of renter households who did not live in the same house one year ago
['Renter-Occupied Housing Units: 2', 'Gini Index', 'Renter-Occupied Housing Units.1', 'Area (Land)', 'Renter-Occupied Housing Units: 10 to 19', 'Renter-Occupied Housing Units: 5 to 9', 'Occupied Housing Units: 5 or More Vehicles Available', 'Renter-Occupied Housing Units: 5 or More Vehicles Available', 'Median Year Structue Built', 'Population 1 Year and Over in Households in the United States', 'Occupied Housing Units: 2 Vehicles Available', 'Occupied Housing Units: 3 Vehicles Available', 'Total Population', 'Occupied Housing Units: 1 Vehicle Available', 'Renter-Occupied Housing Units: No Vehicle Available', 'Renter-Occupied Housing Units', 'Occupied Housing Units: No Vehicle Available', 'FIPS', 'Population 1 Year and Over in Households in the United States: Householder Lived in Renter-Occupied Housing Units: Moved From Abroad', 'Renter-Occupied Housing Units: 1 Vehicle Available', 'Occupied Housing Units: 4 Vehicles Available', 'Population 1 Year and Over in Households in the United States: Householder Lived in Renter-Occupied Housing Units: Moved From Different State', 'Housing Units', 'Occupied Housing Units:', 'Population Density (Per Sq. Mile)', 'Population 1 Year and Over in Households in the United States: Householder Lived in Renter-Occupied Housing Units: Same House 1 Year Ago', 'Renter-Occupied Housing Units: 1, Detached', 'Renter-Occupied Housing Units: Mobile Home', 'Median Value', 'Renter-Occupied Housing Units: 1, Attached', 'Renter-Occupied Housing Units: 50 or More', 'Renter-Occupied Housing Units: 3 or 4', 'Renter-Occupied Housing Units: 4 Vehicles Available', 'Occupied Housing Units: Renter Occupied', 'Renter-Occupied Housing Units: 3 Vehicles Available', 'Population 1 Year and Over in Households in the United States: Householder Lived in Renter-Occupied Housing Units: ', 'Renter-Occupied Housing Units: Boat, Rv, Van, Etc.', 'Renter-Occupied Housing Units: 20 to 49', 'Renter-Occupied Housing Units: 2 Vehicles Available', 'Occupied Housing Units: Owner Occupied', 'Occupied Housing Units']
- Zip Codes
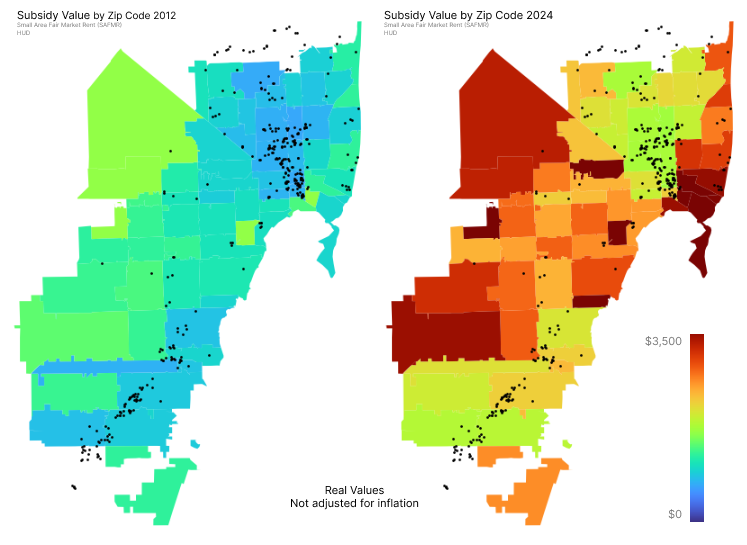
- Bring in tabular Small Area Fair Market Rent (SAFMR) and Zillow Home Value (ZHVI) and Rent (ZORI) indices.
- Calculate the % change in SAFMR over relevant time periods.
- Calculate the % change in Small Area Fair Market Rent (SAFMR) year-over-year during the COVID-19 period (2020-2024).
- Calculate the % change in Zillow (December) home value and rent over the same periods.
- Attach HUD SAFMRs and Zillow ZORIs and ZHVIs to zip codes.
['zip', 'sa_2012', 'sa_2016', 'sa_2020', 'sa_2024', 'sa_Change_12-24', 'sa_Change_20-24', 'ZCTA5CE10', 'GEOID10', 'GEOID20', 'zhvi_2000, 'zhvi_2005-12-31', 'zhvi_2010-12-31', 'zhvi_2012-12-31', 'zhvi_2015-12-31', 'zhvi_2020-12-31', 'zhvi_2022-12-31', 'zhvi_2023-12-31', 'RegionID_x', 'City_x', 'zori_percsince2012', 'zhvi_percsince2012', 'norm_val2023', 'norm_rent2023', 'rent23', 'RegionID_y', 'SizeRank', 'City_y', 'percsinc_2', 'percsinc_3', 'geometry']
Locate and join contextual information to property data
- Brownfields Proximity
- Find the centroids of brownfields.
- Calculate the nearest properties using a unary union.
- Calculate the distance between each property and relevant point.
nearest_points_series = subsidized1['geometry'].apply(calculate_nearest_points)
- US1 to I95 Corridor Proximity
- Extract all highways from the OpenStreetMap network.
- Extract specific roads from the ‘ref’ column.
- Calculate the nearest points to a linestring geometry using a unary union.
subsidized1['distance_to_us195'] = nearest_points_series.apply(lambda x: x[0].distance(x[1]) if x[0] is not None and x[1] is not None else None)
- Underlay Mapping Inequality
- Clean the ‘grade’ column for A, B, C, D, and other
color_mapping = {'A': '#528550', 'B': '#5897A7', 'C': '#BEBA5F', 'D': '#CF7D89', 'Other': '#000000'}
- Assign census geometries
- Rename geometry columns of contextual dataframes (blocks, census tracts, zip codes)
- Loop through spatial overlays of contextual geometries with selected data.
- Densify census blocks by calculating the number of subsidized properties in each census block.
Sources
Context
- Bill Summary: https://www.nahb.org/blog/2024/01/tax-package-would-strengthen-LIHTC
- FHFC Live Local Act Analysis: https://www.hklaw.com/en/insights/publications/2024/02/floridas-live-local-act-tax-exemption-deadline-looms
- Miami-Dade Bond Opportunity: https://fortune.com/2024/03/05/miami-going-into-debt-to-build-houses/
Data
- University of Richmond
- Mapping Inequality (Redlining)
- Data: https://dsl.richmond.edu/panorama/redlining/data
- Crosswalk: https://github.com/americanpanorama/mapping-inequality-census-crosswalk
- Miami-Dade County
- Parcels
- Buildings
- Permits
- Municipalities
- HUD
- Low-Income Housing Tax Credits: https://www.huduser.gov/portal/datasets/lihtc/property.html
- Small Area Fair Market Rents: https://www.huduser.gov/portal/datasets/fmr/smallarea/index.html
- FHFC
- Book of Business as of 2023
- Qualified Census Tracts (QCTs)
- Small Area Difficult Development Areas (SADDAs)
- Areas of Opportunity (AOOs)
- Miami-Dade County
- Municipal Boundaries
- Brownfields
- U.S. Census Bureau
- Counties 2020
- Places 2020
- Blocks 2020
- Census Tracts 2010, 2020
- TIGERLINE: https://www.census.gov/geographies/mapping-files/time-series/geo/tiger-line-file.html
- U.S. Census Bureau: https://data.census.gov/table
- Zillow
- Housing Value Index (ZHVI)
- Observed Rent Index (ZORI)
- Zip Codes
- Housing Data: https://www.zillow.com/research/data/
- Housing Supply Dashboard: https://www.zillow.com/research/housing-supply-32743/
- ISCPR
- Project: https://www.openicpsr.org/openicpsr/project/108164/version/V3/view
- Dataset: https://rdrr.io/github/jacobkap/crime_data/src/tests/testthat/test-offenses_known_values.R
