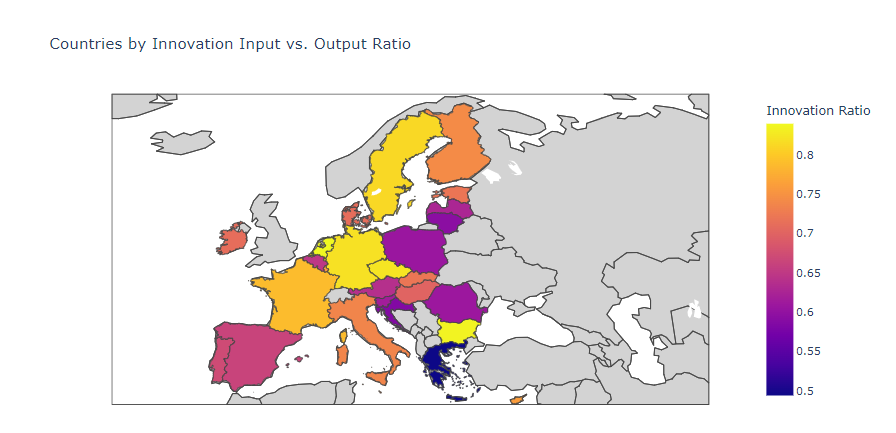
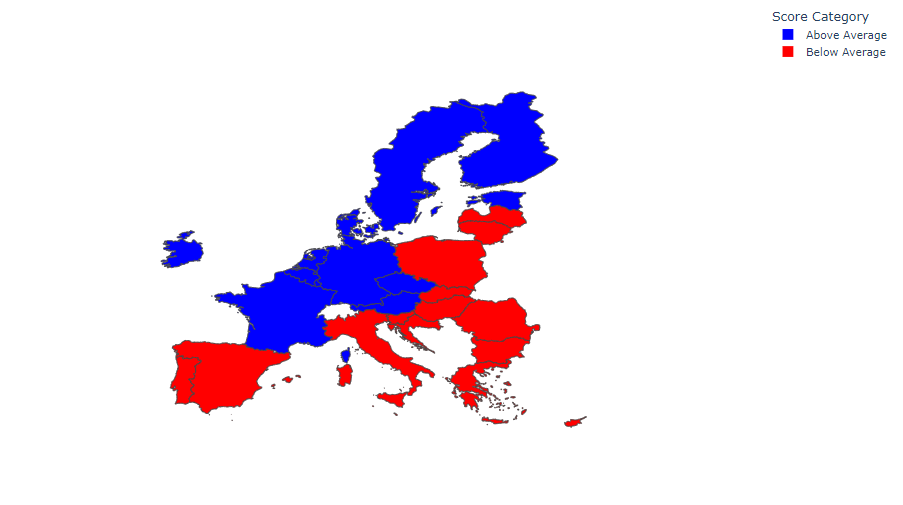
In the dynamic landscape of global innovation, understanding the intricacies of what drives or hinders progress is crucial. This post dives deeper into the innovation data concerning EU countries, aiming to decipher it visually for clearer insights. Leveraging the Global Innovation Index 2022, which assigns each nation an innovation score, this project set out to visualize the innovative prowess across Europe, identifying both front-runners and those lagging behind. The average innovation score for the EU was generated and countries were classified depending on whether they score above or below, thus painting a clear picture of the great innovation barrier in the EU as seen in Image 1.
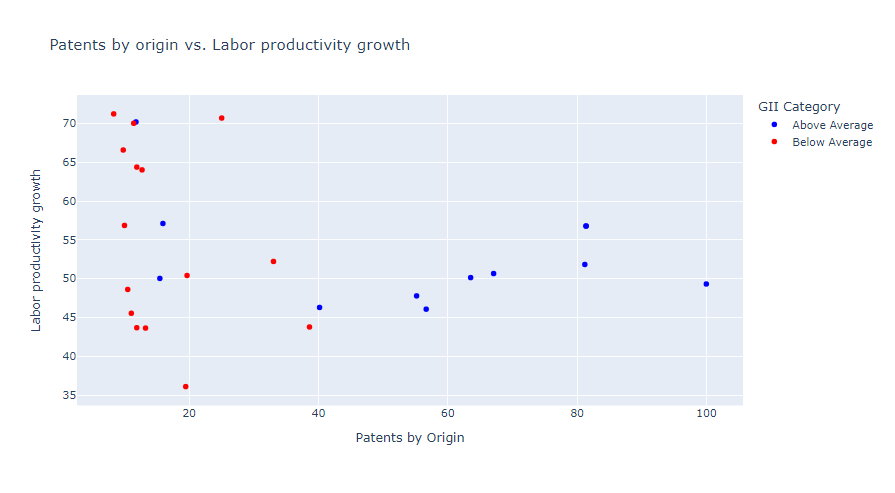
The central hypothesis revolved around exploring the correlation between patent filings and labor productivity growth. However, initial findings revealed a mere -0.25 correlation coefficient, suggesting no substantial relationship. Yet, delving deeper, it became evident that innovation and labor productivity demand distinct skill sets, as depicted in Image 2.
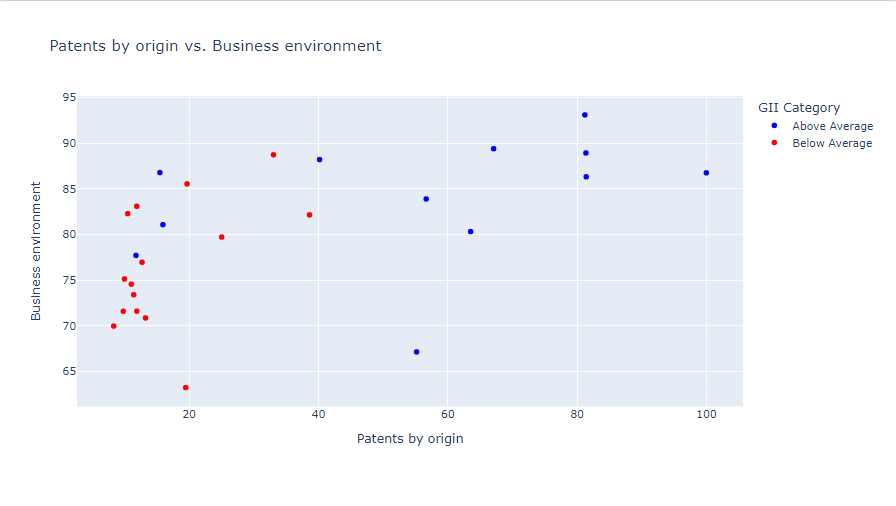
The investigation then shifted focus to whether a conducive business environment fosters innovation. The resounding answer: affirmative. Countries boasting business-friendly climates indeed witness a surge in patent filings, reaffirming the symbiotic relationship between business atmosphere and innovation, as depicted in Image 3.
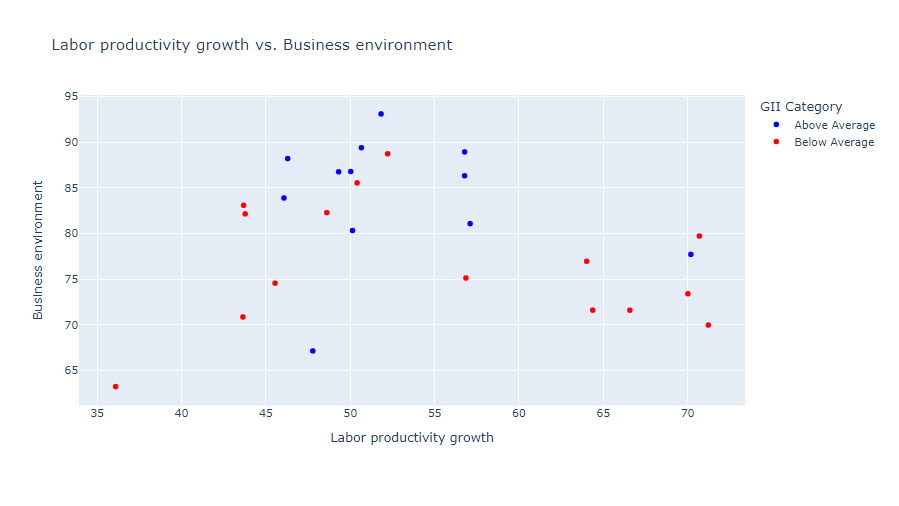
However, when scrutinizing if these favorable business environments translate into heightened labor productivity, the narrative takes a nuanced turn. Surprisingly, the data suggests otherwise. Productivity thrives not necessarily in business-friendly realms but rather in environments conducive to knowledge creation. In essence, less innovative nations often serve as manufacturing hubs for ideas originating from innovation powerhouses, as depicted in Image 4.
As the analysis progressed, a pattern emerged, highlighting a dichotomy in innovation dynamics. Innovative juggernauts like Germany, Sweden, Denmark, and Finland emerged as frontrunners, while others trailed behind, as showcased in Image 5.
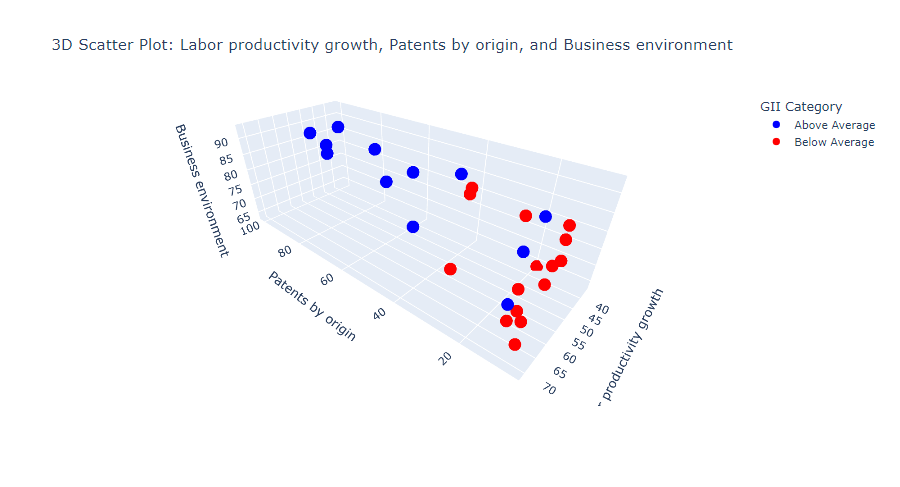
The crucial question then arises: What role do countries aspire to play in the innovation ecosystem? Are they aiming to be pioneers in innovation creation or champions in leveraging innovations for output? This pivotal distinction underscores the strategic decisions nations must make, as delineated in Image 6.
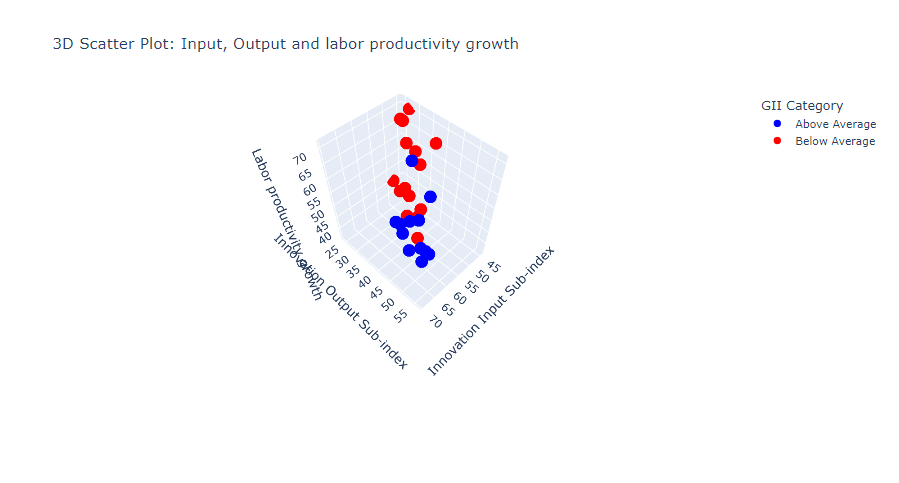
Further exploration uncovered intriguing revelations. Despite being deemed the least innovative in Europe, Romania boasts the most efficient input-output ratio, indicative of its potential for leapfrogging despite minimal investment in innovation, as illustrated in Image 7.
Moreover, by extrapolating trends and patterns, potential future leaders in EU innovation come to the fore. Belgium, Austria, and Ireland emerge as prospective frontrunners, while Croatia and Greece exhibit promise in production leadership, contingent upon strategic investments.
In essence, navigating the terrain of innovation in the EU demands a nuanced understanding of the interplay between investment, environment, and productivity. As countries chart their courses, harnessing these insights could pave the way for transformative progress and global competitiveness.
