
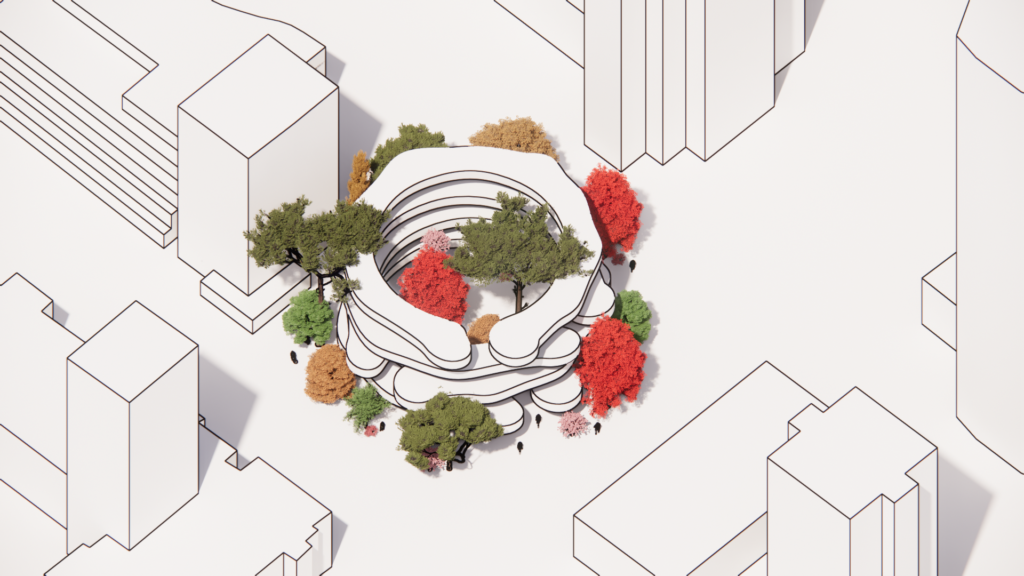
The project’s land plot is located in a dense high-rise populated area in Vancouver, Canada. Thus, an idea for an urban vertical park emerges from the limitation of space and the parallel increased need for vegetation.
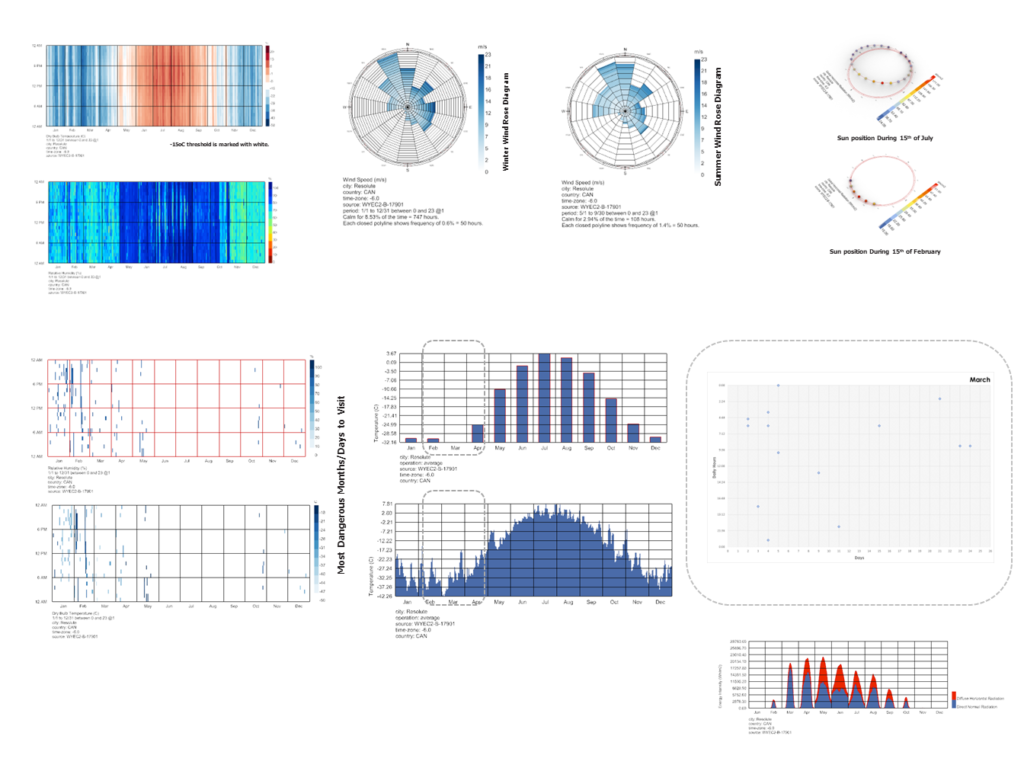
Initially the climate analysis for Vancouver Canada commenced with an in depth identification of the coldest and warmest months to days to hourly peaks combined with high and low humidity levels to distinguish the most critical moments. A threshold is depicted with the white color and is the -15oC limit which is crucial for the human body to avoid medical dangers.
Onward to the site the main idea was to create an urban envelope and observe the differentiation for a variety of design options that may emerge with the main objective to be an optimal design based on the environmental comfort of the user.
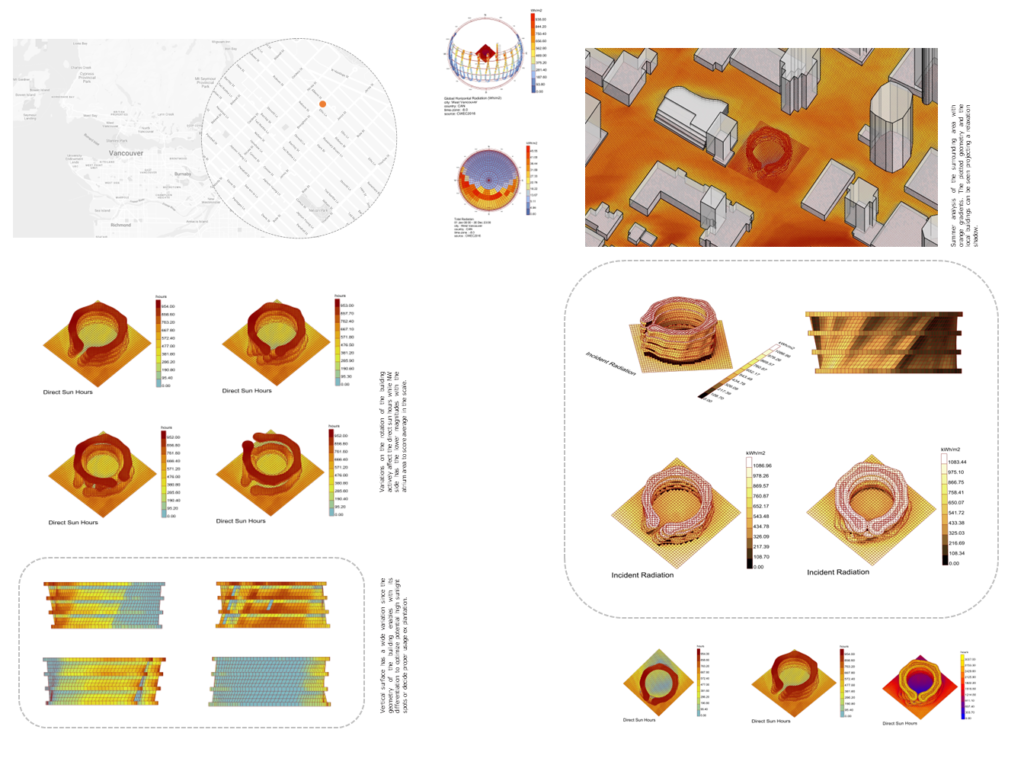
It can be seen that regarding radiation geometry itself have deviations in the vertical components while rotating the horizontal plates while the most important period is May to September 12 noon to 5pm .
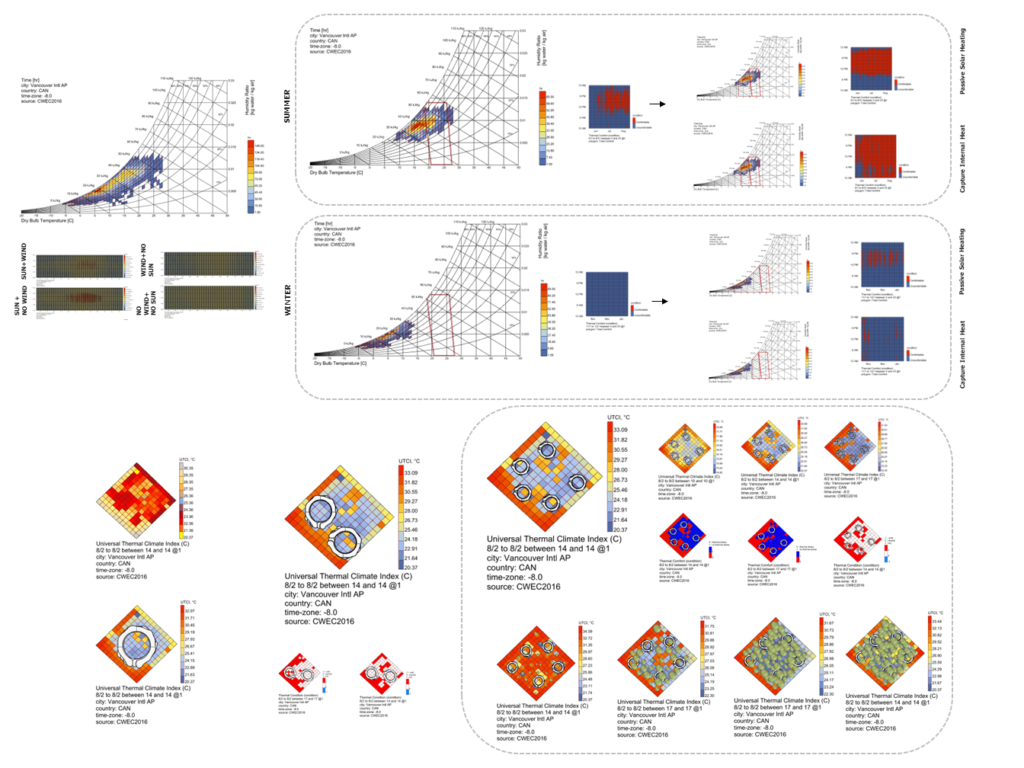
Proceeding with the analysis and the psychometric chart at this point the author’s aimed to study and test the freedom to have instead of one large urban element , an option for two mid range ones or another option with five smaller urban envelope structures and how this affects the design process and the environmental factors differences. Furthermore, the author investigated as illustrated in the charts above, if the resulting deviations in thermal comfort can be covered and equalized by plantation placements.

For the solar radiation initially the author tested the geometry again with vertical and horizontal transforms calculating the total radiation from the summer months for each segments while disregarding the scale the test was performed in different facade covers for the envelope in open, closed, inclined, triangular calculating the total daylight factor for the most crucial time periods.

Consequently with the wind analysis after proper meshing a vector flow indicated the most dominant point of interest while in paraview software the converged parameters of the wind tunnel test were illustrated as shown in the diagrams above.
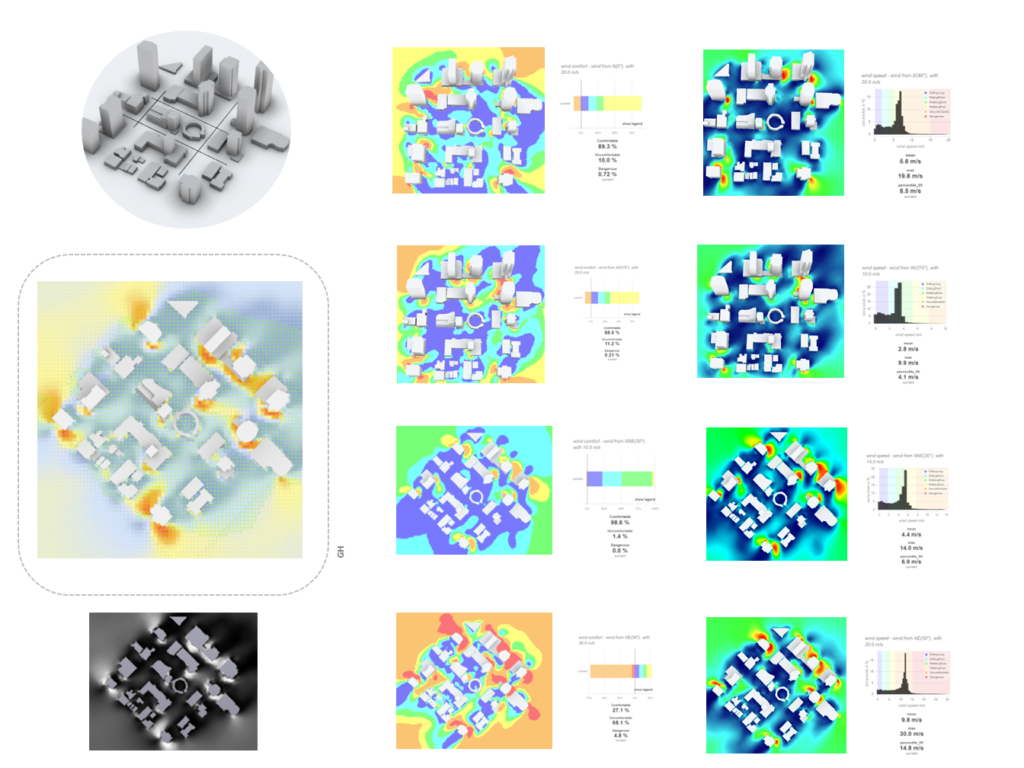
To conclude, those points of interest were used to create a case in infrared CFD software while even from the abnormal ring-like shape of the geometry the platform was able to give results in bitmap and colors for the different wind scenarios for thermal comfort and wind speed.
