
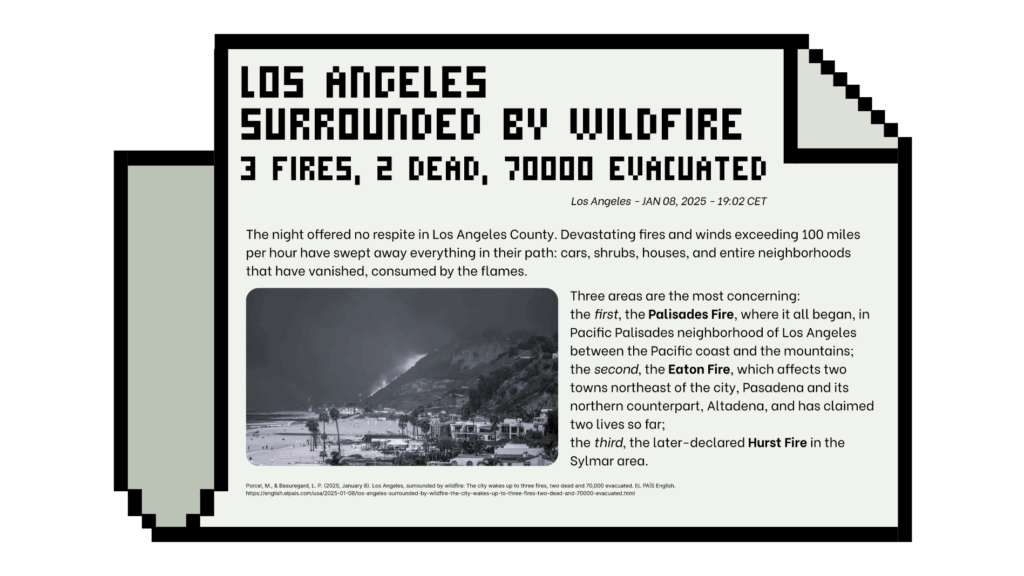
January 7th marked the beginning of one of the most devastating wildfire events in California’s recent history. A series of fires struck the city of Los Angeles, and within just 24 hours of the first ignition, the city was already facing three major wildfires in Pacific Palisades, Eaton, and Hurst. At that point, two fatalities had been reported, and over 70,000 people had been evacuated.
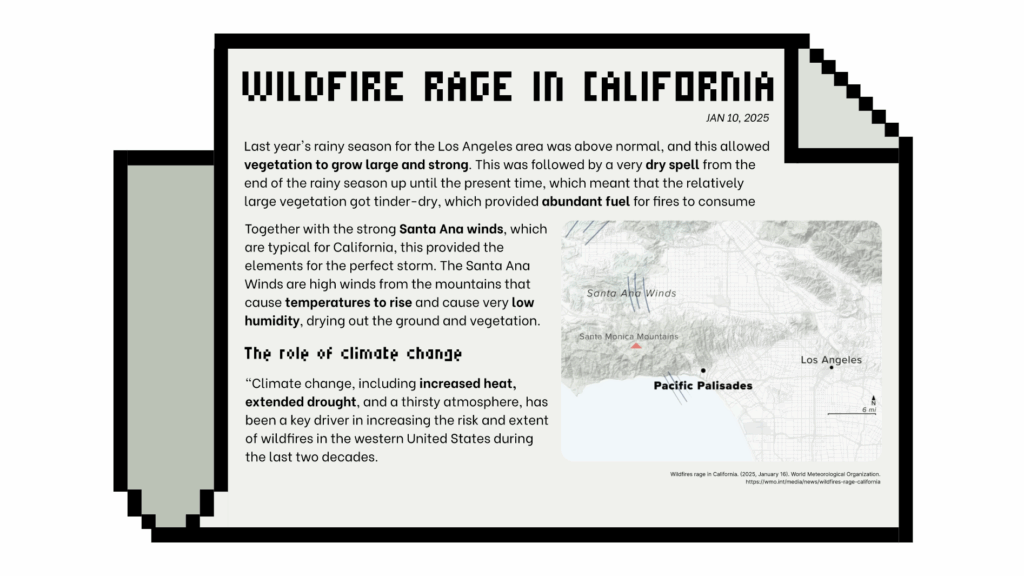
Wildfires are not uncommon in California; residents are, in many ways, used to them. However, the conditions surrounding this particular event were unique due to the wind patterns. The Santa Ana winds, which typically push air southward, unusually shifted north this time. As a result, the initial spark spread rapidly with the wind. On top of that, last year’s rainy season in the Los Angeles area was above average, allowing vegetation to grow thick and tall. But this was followed by an extended dry spell, leaving the abundant plant life tinder-dry and highly flammable. Combined with low humidity levels, these natural factors contributed to making the Pacific Palisades fire one of the most destructive in the state’s history.
During the unfolding crisis, residents faced a series of urgent challenges. With two more zones ordered to evacuate, three new evacuation warnings issued, heavy traffic congestion, and three road closures along the Pacific Coast Highway, escaping the flames became an ordeal. Many people even abandoned their vehicles in desperation. At the same time, firefighters were struggling to meet the water demands, as water systems in many areas could not keep up.
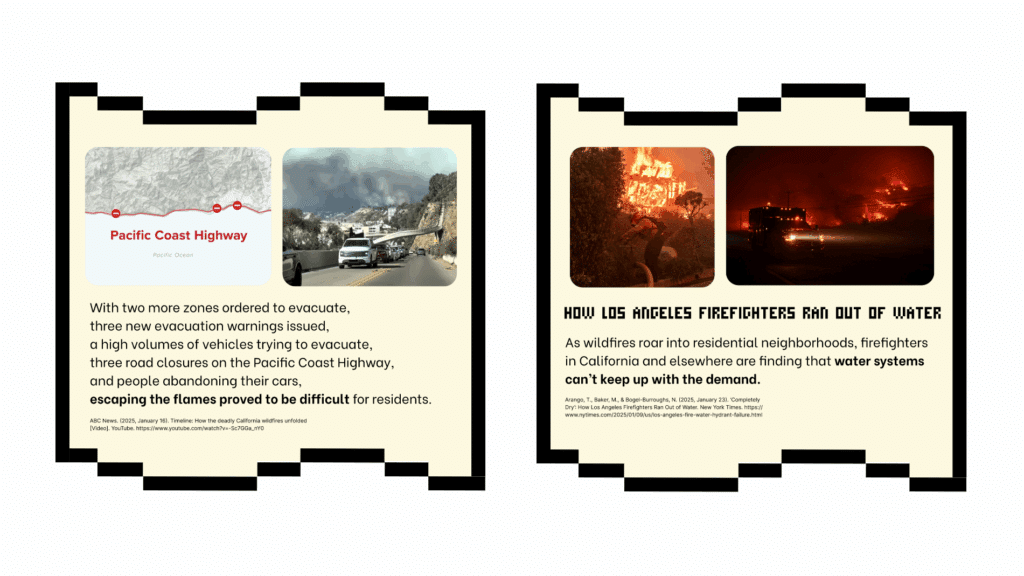
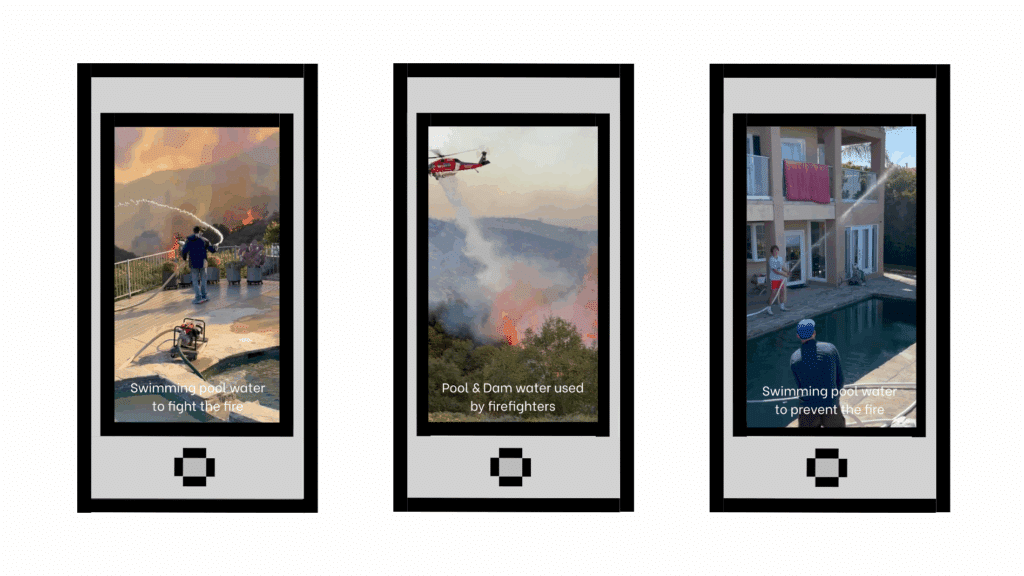
Those who chose not to evacuate stayed behind to defend their properties, using garden hoses and even pool water to spray down their homes and surrounding vegetation in an attempt to prevent the flames from spreading. Firefighting helicopters were also seen drawing water from swimming pools and nearby reservoirs to help contain the blaze.
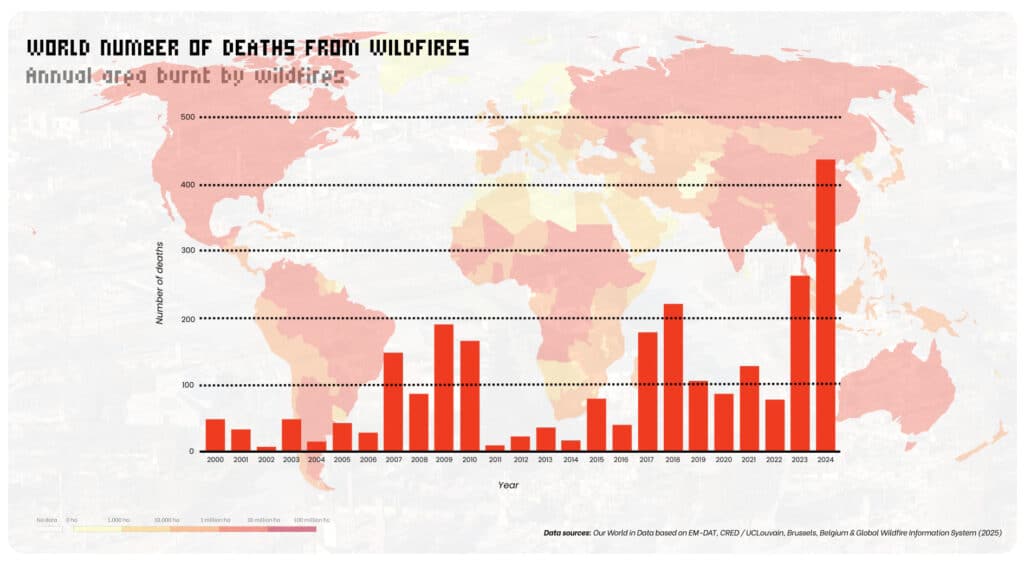
Staying behind in an active fire zone is extremely dangerous. Statistics show a growing number of wildfire-related deaths in recent years. So why would anyone choose to risk their life in such circumstances? The answer lies in part in the changing insurance landscape. In the months leading up to the fires, many insurance companies began withdrawing wildfire coverage. Thousands of policy renewals were denied in 2024 for residents in the Palisades and other LA ZIP codes. For those still eligible, premiums have skyrocketed to levels unaffordable for much of the population.
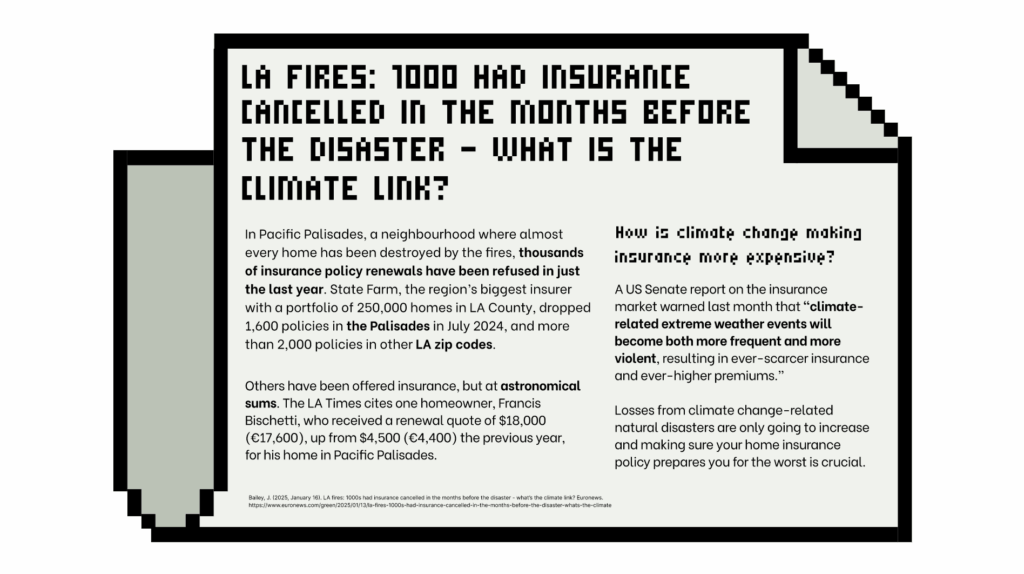
Insurance providers justify this by citing climate change. As they argue, “climate-related extreme weather events will become both more frequent and more violent, resulting in ever-scarcer insurance and ever-higher premiums.” In other words, losses from climate-related disasters are expected to rise dramatically, and securing home insurance that can withstand such risks is becoming increasingly crucial, yet also increasingly out of reach.
Research Question
How can we use big data to identify the key environmental and human factors that contribute to the risk of wildfires worldwide so we can help urban planners identify high-risk vulnerable zones and inform communities about their exposure to this phenomena, while also applying machine learning models to detect urban elements that might help to response to wildfires.
With research question we created the persona to understand on how each stakeholder uses and the ability to access the data at the time of most needed.
And with theses personas in mind we developed our research project ahead.
Pipeline
As demonstrated in our research, the wildfire had an impact across multiple scales. For this reason, we chose to analyze the wildfire at three distinct levels:
Macroscale – to examine the natural factors that contributed to the spread of the fire,
Mesoscale – to assess the urban factors that hindered residents’ ability to evacuate,
Microscale – to identify the water-related elements that residents used to defend their properties from the flames.
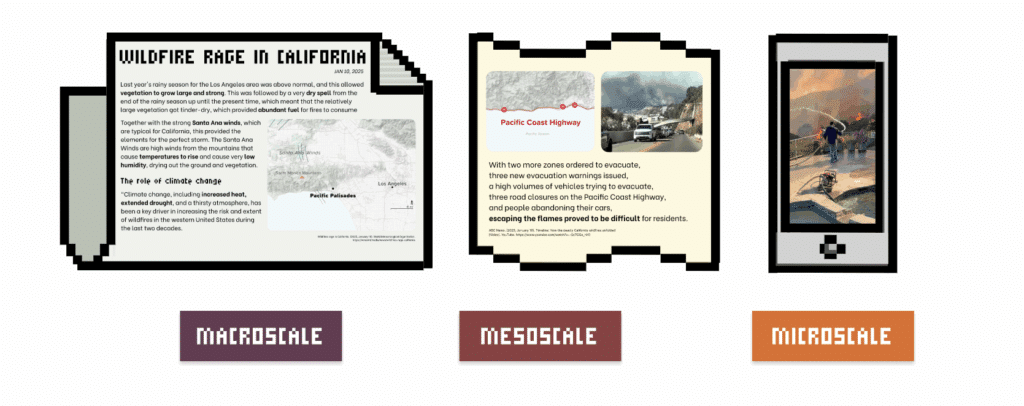
With these scales in mind, we developed a methodology to analyze wildfire vulnerability from a multiscale perspective.
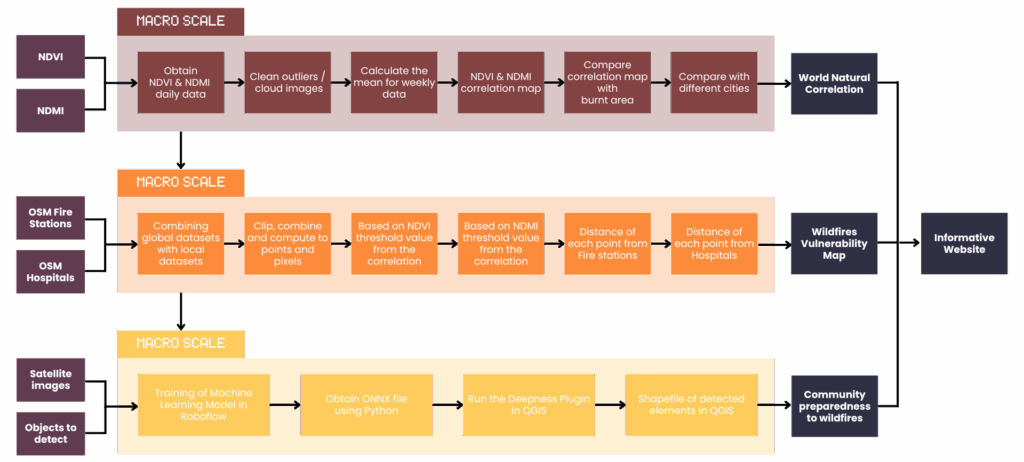
Macroscale
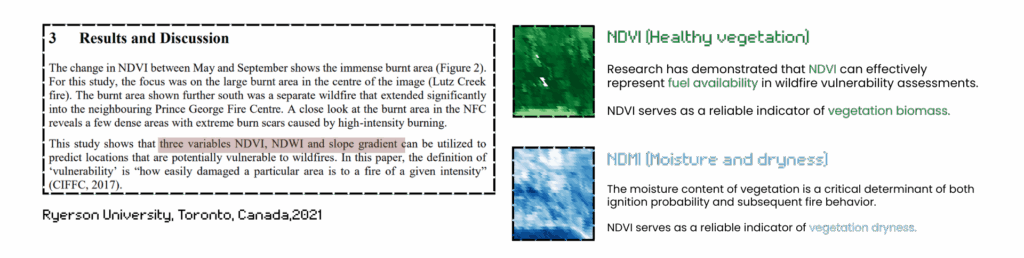
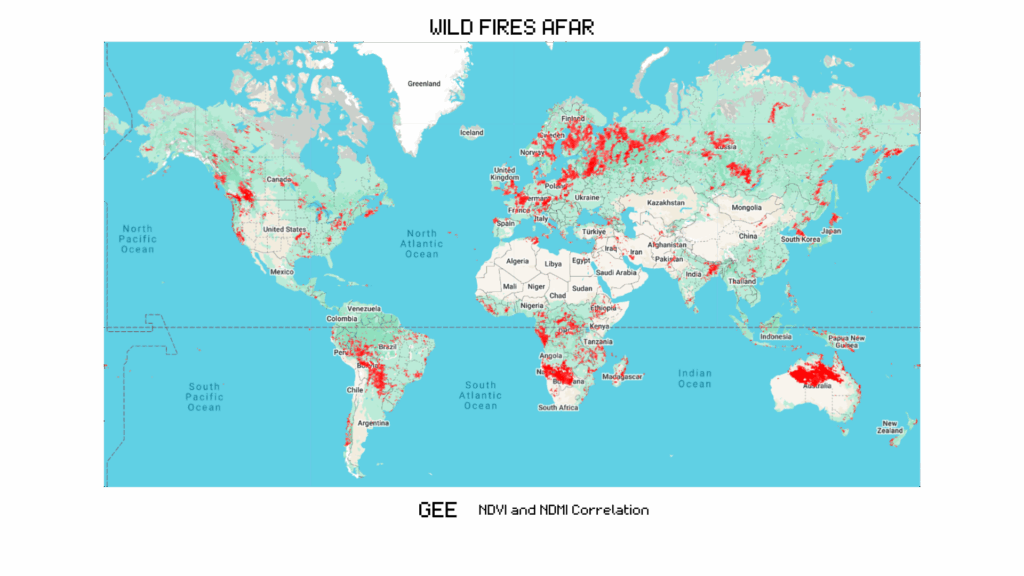
At the macro scale, our goal is to understand how vegetation dynamics correlate with fire vulnerability across the entire planet. We leverage daily NDVI (Normalized Difference Vegetation Index) and NDMI (Normalized Difference Moisture Index) data from satellite imagery to observe vegetation health and moisture stress patterns over time. We also developed the project based on the prior research by Ryerson university, Toronto, Canada,2021.
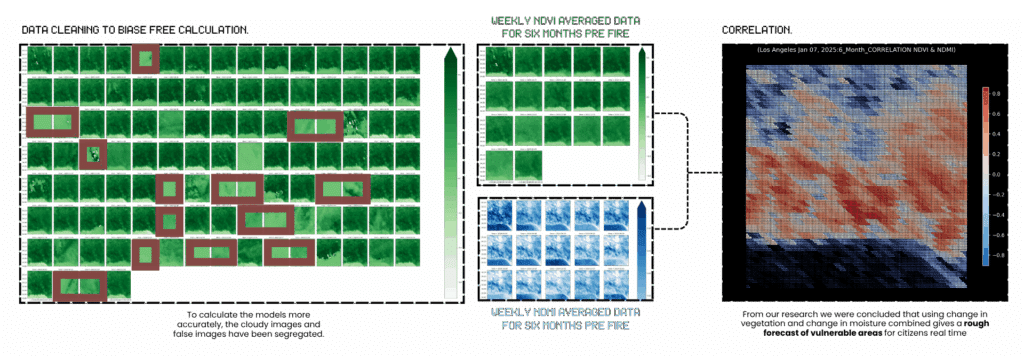
To ensure accuracy, we clean the data, removing cloud-contaminated and extreme outlier pixels. The cleaned time series is then aggregated weekly to smooth short-term noise and highlight meaningful trends. From this, we compute a pixel-wise correlation between NDVI and NDMI, revealing where vegetation becomes drier and more volatile—a potential indicator of fire risk.
This correlation map is then overlaid with burnt area datasets to evaluate how well vegetation patterns align with actual fire events. By repeating this across different regions and seasons, we compare natural fire-linked vegetation behavior across cities and biomes globally.
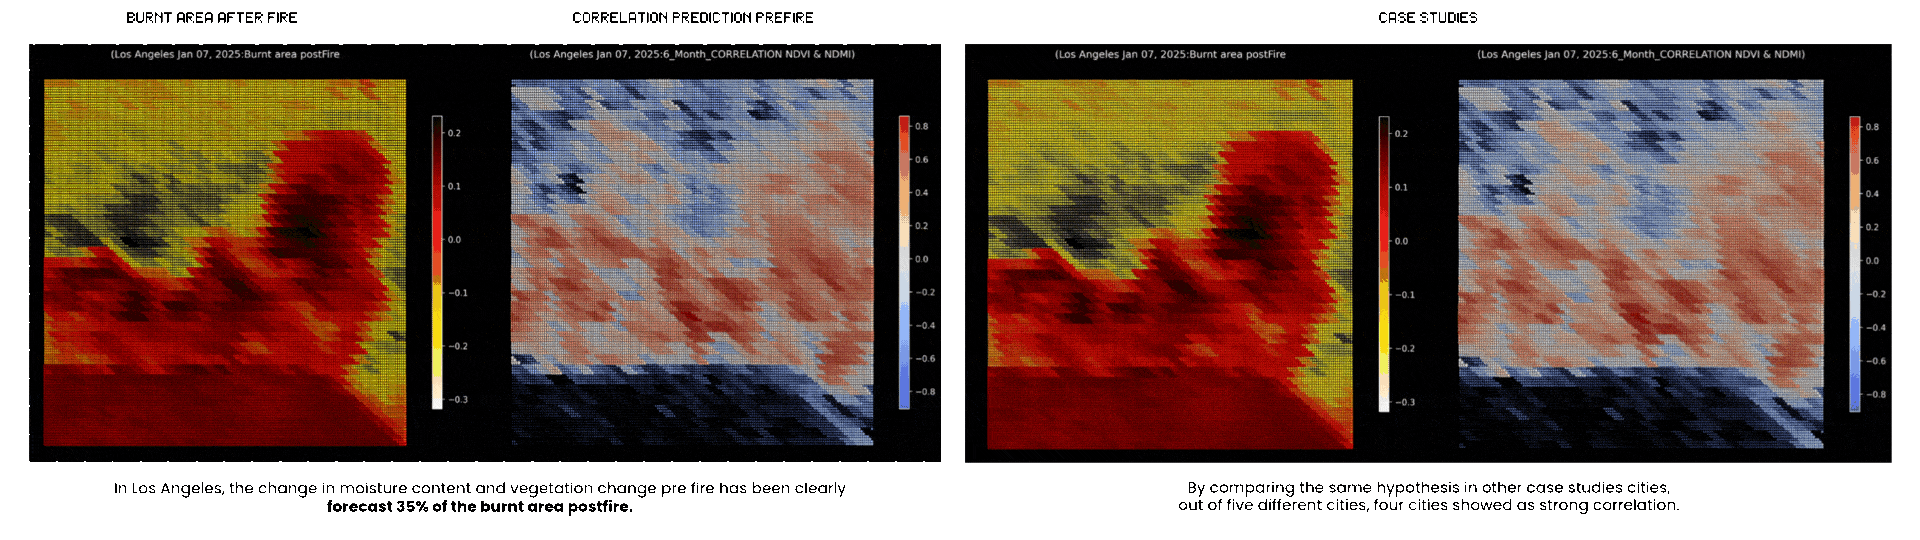
The output: a “World Natural Correlation” map, showcasing regions where vegetation stress reliably precedes fire—offering insight for early-warning systems, planning, and global-scale fire ecology analysis.
Mesoscale
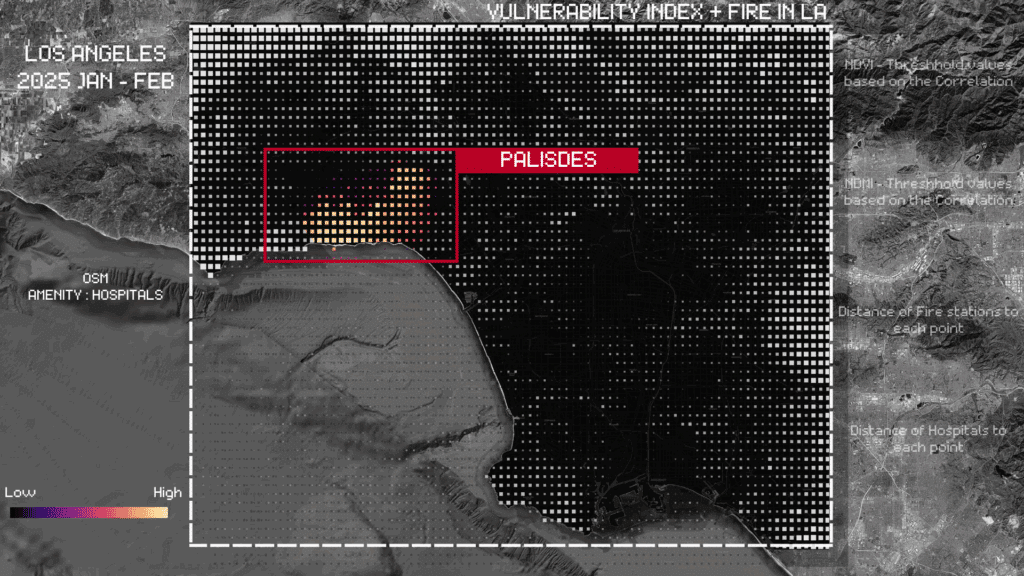
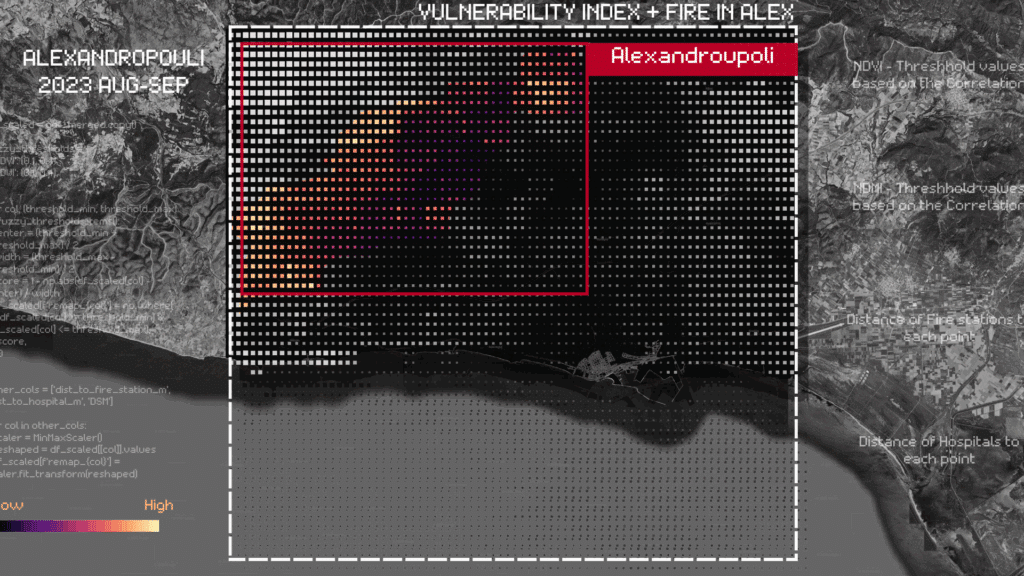
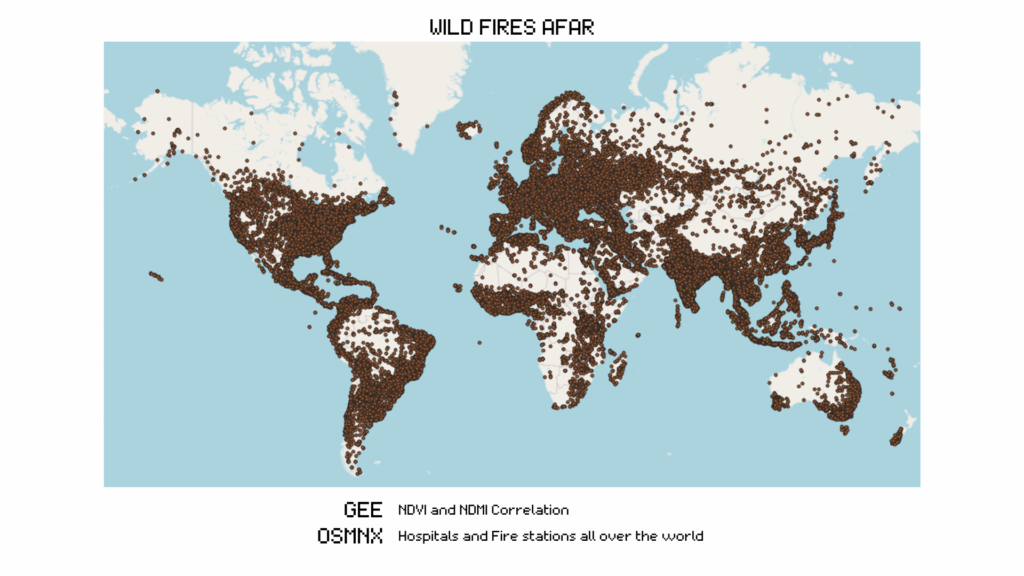
For the Mesoscale analysis, we zoomed into the city of Los Angeles, focusing specifically on the Pacific Palisades area. In this section, we evaluated several critical factors, including vegetation health (NDVI), moisture presence (NDMI), the availability of hospitals to treat wildfire-related injuries, and the presence of fire stations for emergency response.
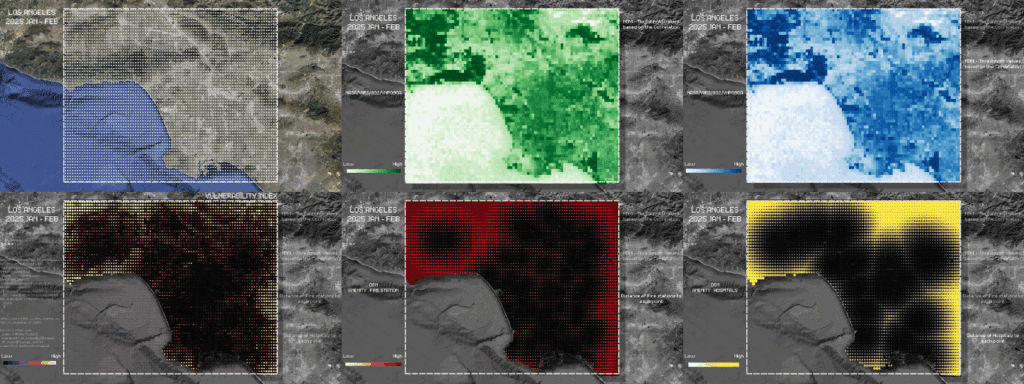
By geolocating the absence of healthy vegetation, moisture, hospitals, and fire stations, we identified areas of the city that are most vulnerable to wildfires from both natural and urban perspectives. This spatial analysis revealed that Pacific Palisades exhibits a high level of vulnerability.
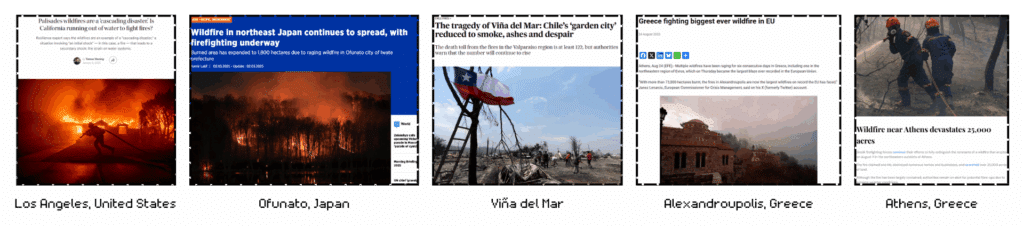
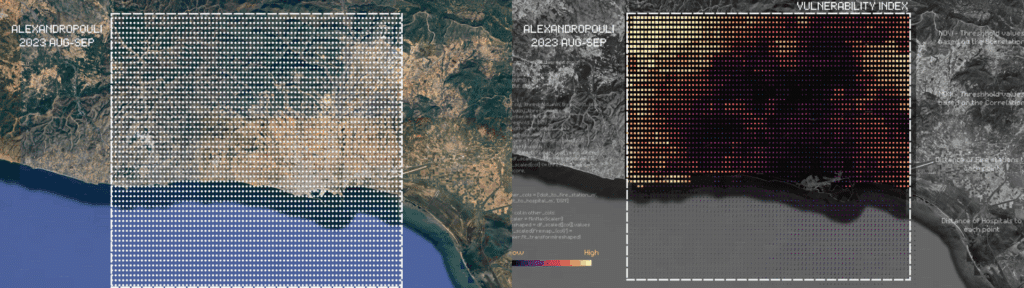
We also applied this methodology to another city from the Macroscale level: Alexandroupolis, Greece, which was recently impacted by a major wildfire. This comparative approach highlights how integrating Macroscale and Mesoscale analyses offers a more nuanced understanding of wildfire vulnerability, not only in California but across the globe.
Microscale
There is no doubt in my mind that this generator, pump, pool, sprinkler and fire hose contributed to saving our family home. We ran this equipment for about 10 hours over the course of 2 days. We drained 2 pools. Without this, there would be no more house and possibly no more neighbors. Were we lucky? Extremely. Were we prepared? Yes. Were there things we would have done differently? Absolutely. [User @cali_._love via Instagram]
The community of Pacific Palisades felt the obligation to defend their homes using whatever water resources they had available. For those fortunate enough to have a swimming pool, this became their primary means of protection. Based on this reality, we decided to use machine learning detection models to map the community’s vulnerability to fire, using the presence of swimming pools as an indicator of potential fire-fighting capacity.
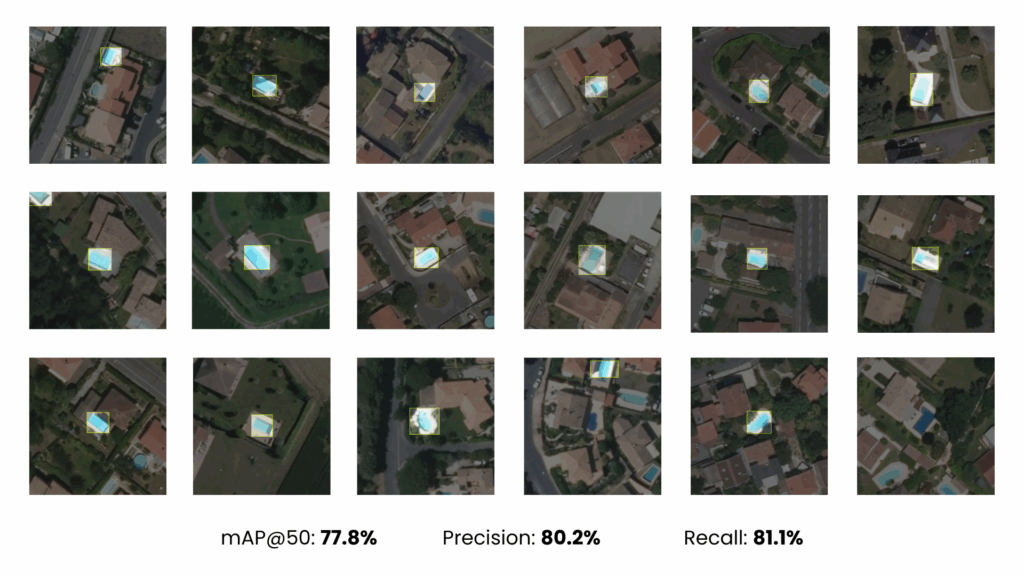
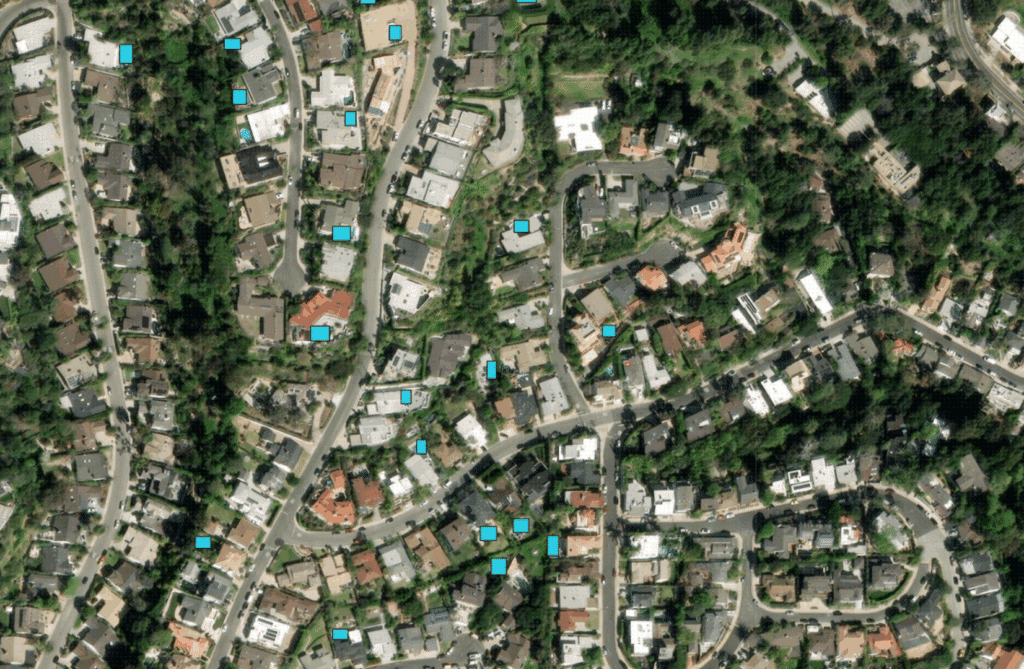
To do this, the first step was to train a machine learning model to detect pools using satellite imagery through the Roboflow platform. Once the model was trained, we exported it as an ONNX file using a Python script. This ONNX file was then used within QGIS through the Deepness plugin to run the detection of pools in the Pacific Palisades area. The result was a shapefile containing all detected pools.
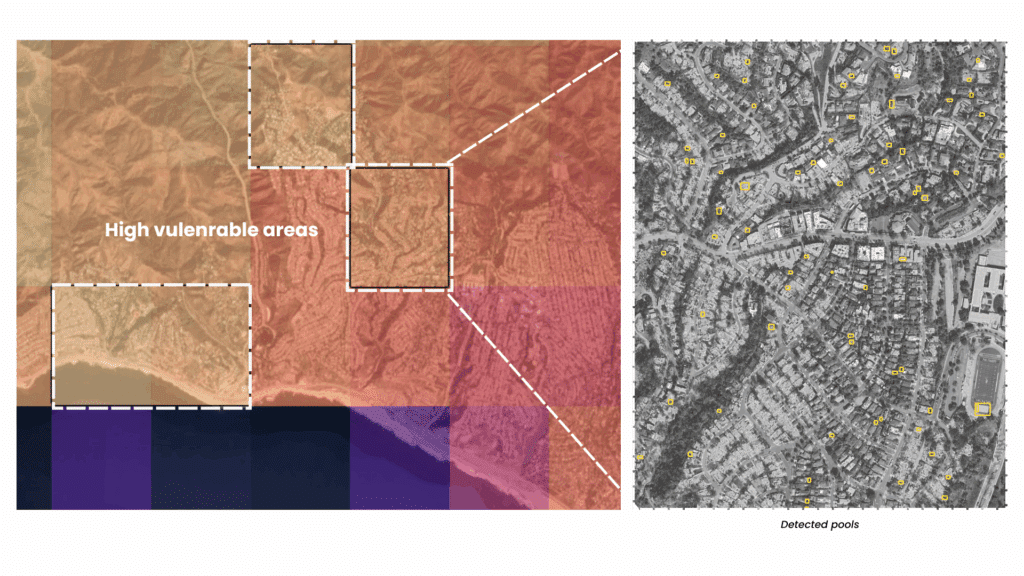
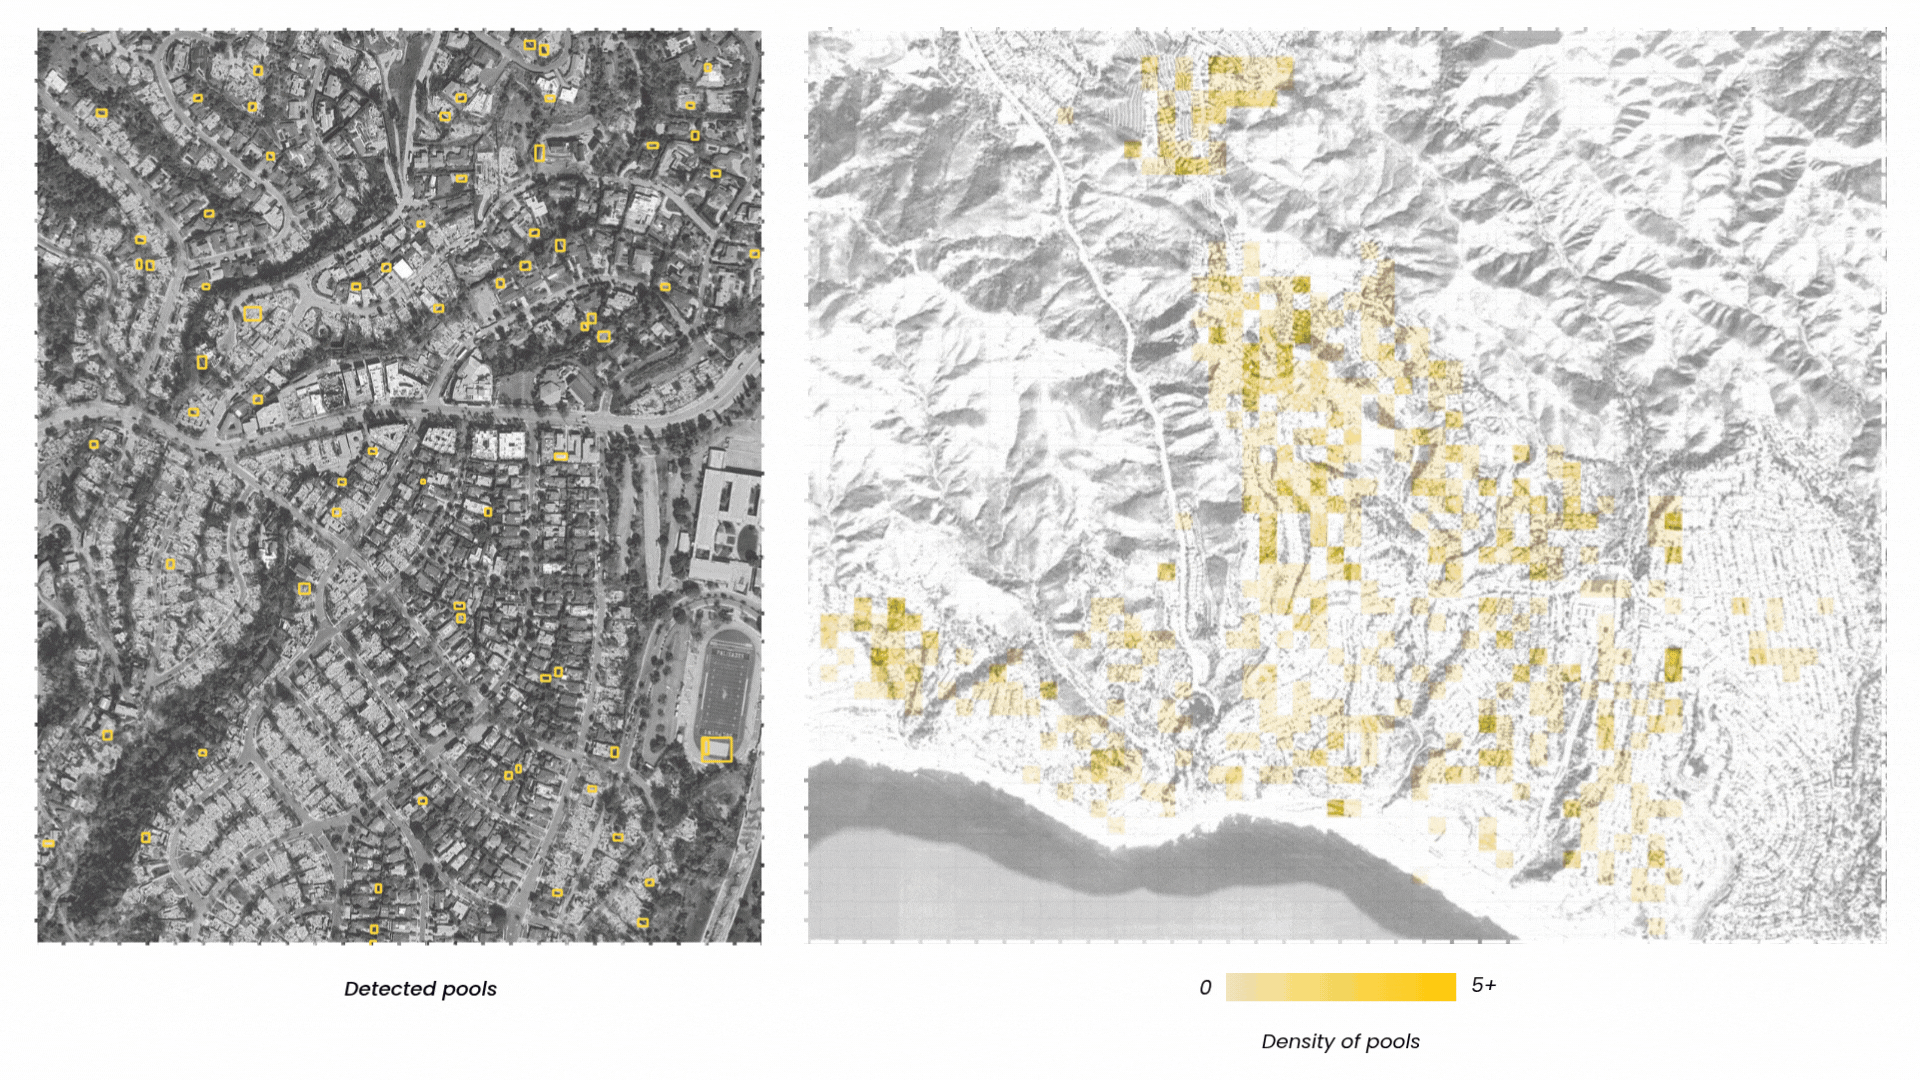
This element detection was carried out in areas previously identified as vulnerable at the mesoscale level. Through this exercise, we aimed to assess whether it is possible to rely on swimming pools as a personal water source to fight fires in zones that are vulnerable from both natural and human perspectives.
Toolkit
At the conclusion of our research, we felt it was essential to make both the knowledge acquired and the methodology we developed open source. This allows anyone interested in managing this type of information to access it freely and explore the levels of vulnerability they may face in different parts of the world.
The tool features a UX/UI design inspired by video games, a choice driven by the granularity of the data we worked with. We decided to enhance this aesthetic by embracing pixelation as the visual identity of the project.
The website includes an Overview (storytelling) section where users can explore our investigation, insights, and the key information that helped us better understand wildfires. There is also a Methodology section that details every step we followed, allowing anyone interested to replicate the process if they wish.
We’ve created dedicated sections for each of the three scales of analysis. In the Macroscale and Mesoscale sections, users can access an interactive map that shows wildfire vulnerability anywhere in the world, either based on natural factors alone or a combination of natural and urban elements. In the Microscale section, users can explore the methodology we followed to detect elements in satellite images using a machine learning model. Additionally, we included a section to gather and share diverse wildfire management practices from around the world. This is important because, while in Pacific Palisades residents used swimming pool water to fight fires, there are Indigenous communities that rely on specific tree species to prevent fire spread. In other regions, fires are deliberately set as part of ecosystem regeneration strategies—reflecting the understanding that wildfires have always existed and are vital for forest renewal. By incorporating inputs from different perspectives, we aim to build an informed virtual community that doesn’t view wildfires solely as enemies of humanity, but also as a necessary component of the Earth’s life cycle.
Lastly, the site features a Contact section where we welcome collaboration and collective learning around wildfire knowledge and resilience.
.
Conclusion
Together, these maps represent a multi-scale wildfire intelligence system: the Macroscale identifies where natural conditions signal fire risk; the Mesoscale assesses whether urban infrastructure is prepared to respond; and the Microscale focuses on local elements, contextualized by geography, ecology, and community, that influence mitigation and preparedness efforts. By integrating satellite analytics with open-source urban data layers, this framework bridges the gap between environmental signals and urban readiness, supporting more informed strategies for climate resilience, evacuation planning, and long-term land-use policy.
It is important to acknowledge that, due to the time constraints of this course, we were unable to incorporate several variables that significantly influence wildfire vulnerability. Natural elements such as wind direction and speed, as well as topographic slope, which plays a critical role in fire spread due to rising air temperatures—were not included. On the urban side, proximity to hospitals and fire stations could be assessed not only through linear distance but also through estimated travel time along road networks, offering a more precise vulnerability model.
Pacific Palisades, our selected area of analysis, is a data-rich, high-income neighborhood. We recognize the privileges associated with this context, including access to private pools and robust infrastructure, which are not representative of the broader population. While the detection of swimming pools allowed us to experiment with remote sensing techniques, this does not reflect the conditions in less affluent areas, where vulnerability to wildfires may stem from entirely different factors. Future applications of this methodology should prioritize these underrepresented contexts, where the stakes are often higher and the data less accessible.
Ultimately, we chose to design a scalable tool because we believe that public access to wildfire vulnerability data is essential. In a world where climate and social risks are deeply interconnected, wildfire impacts are not distributed equally, they are shaped by structural inequalities that affect different communities in profoundly different ways. As fire seasons become longer and more severe, tools like this will be critical, not only to detect fire risk but to anticipate it, and to design equitable, proactive responses that leave no one behind.
