
1. Introduction
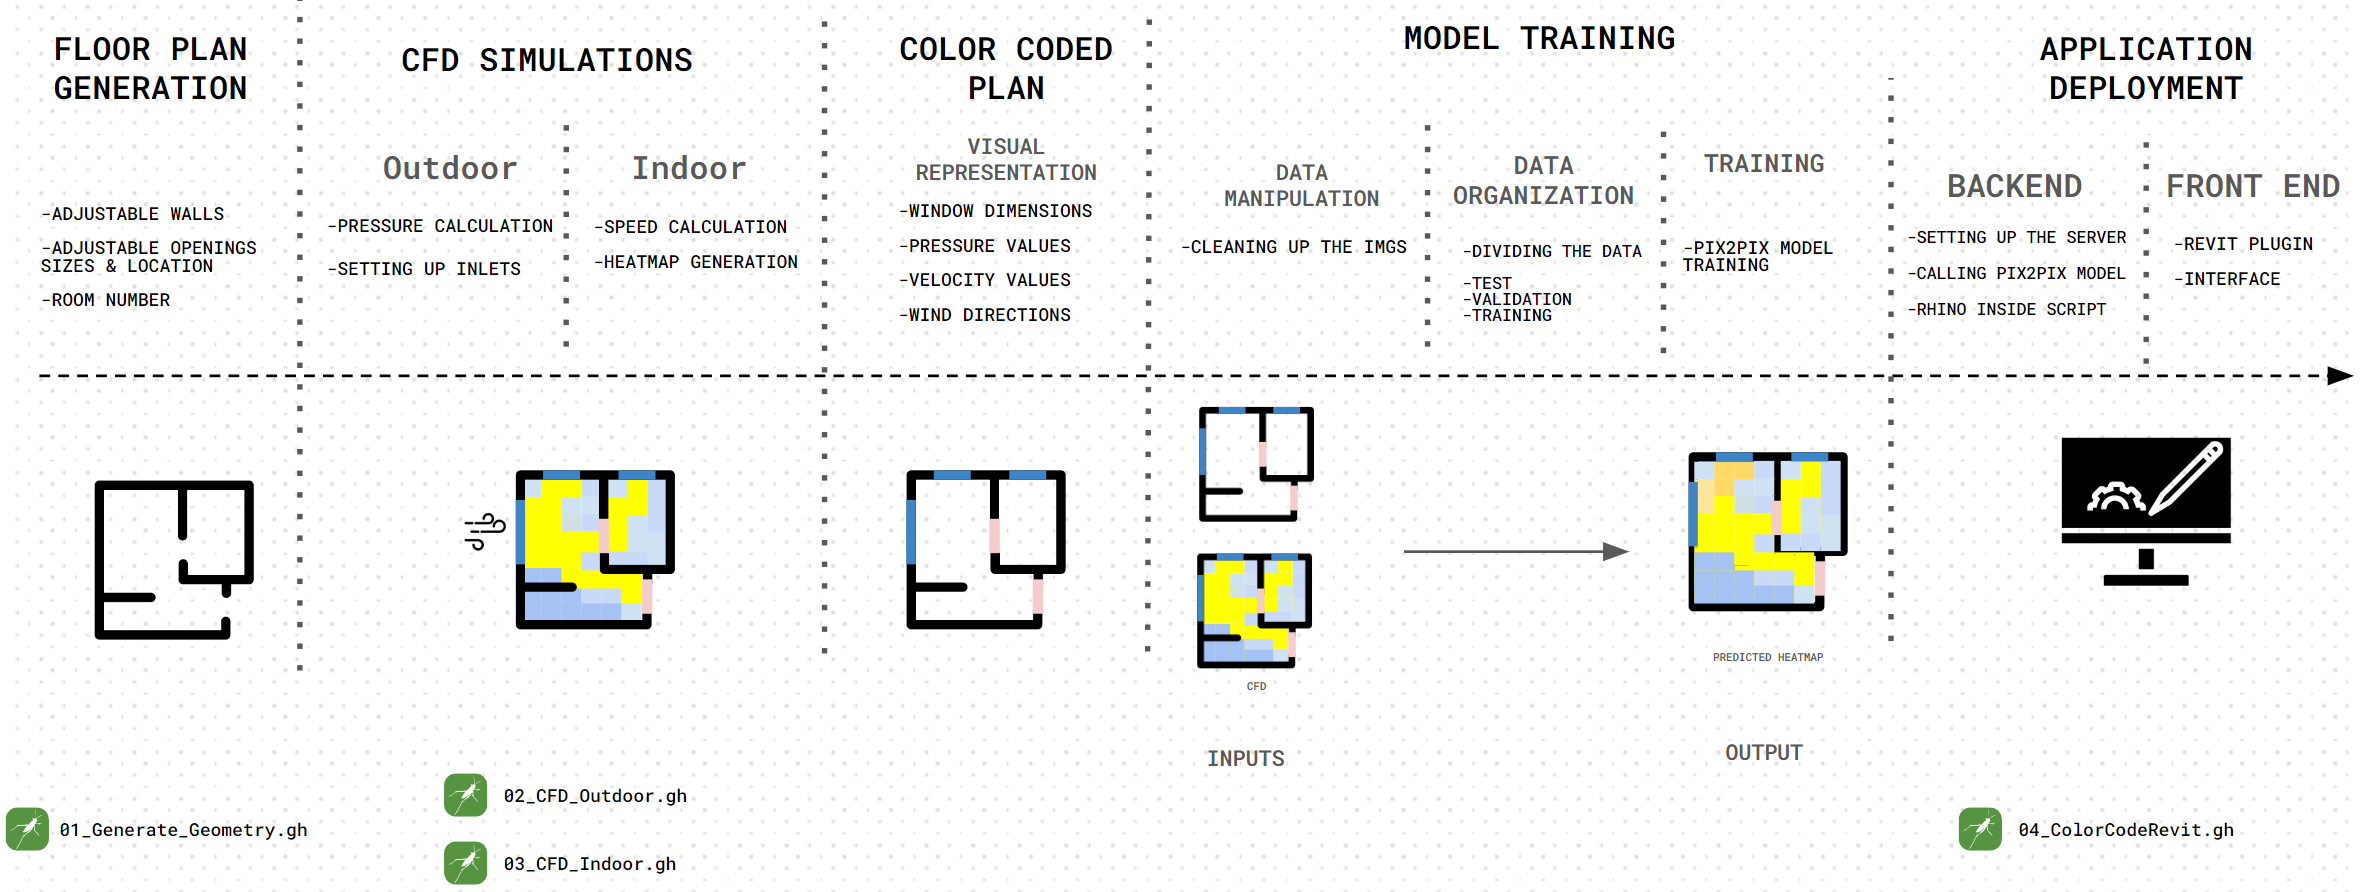
2. Methodology
2a. Dataset Generation
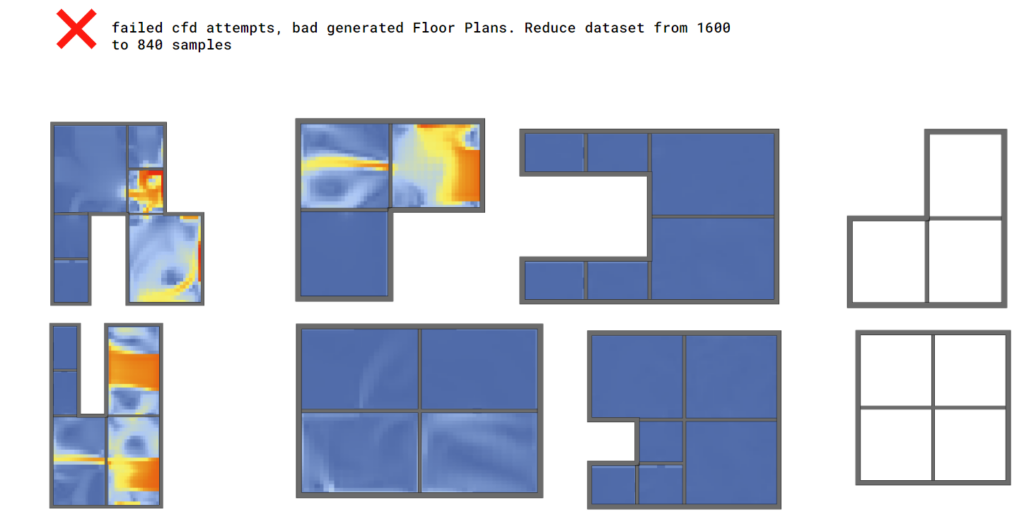
To train our machine learning model effectively, we needed a substantial dataset of at least 1.000 data points. However, conducting CFD simulations is notoriously time-consuming, presenting a significant challenge in generating such a large volume of data efficiently.
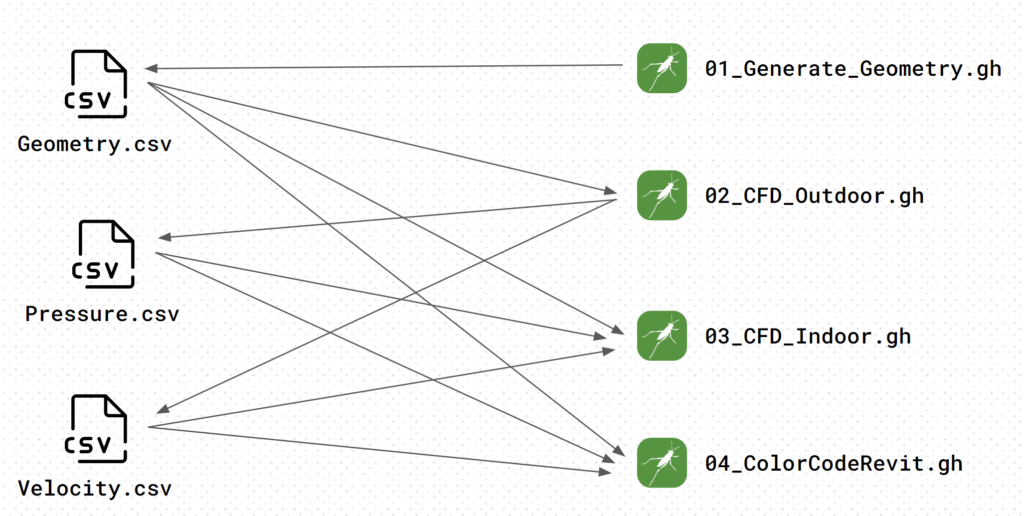
To streamline the dataset generation process, we broke down the workflow into several smaller, more manageable Grasshopper scripts. Each script handled a specific step of the process, producing output files in .csv format. These output files were then used as inputs for subsequent scripts. This modular approach had multiple advantages:
- Simplified Script Management: By dividing the process into distinct steps, each script remained less complex and easier to manage. This modularity also reduced the risk of errors, as fewer tasks were handled simultaneously within a single script.
- Parallel Processing: The modular structure allowed us to distribute the workload across multiple computers. Since each script generated reproducible results based on specific seed numbers, the exact same geometries could be recreated consistently. This parallel processing capability significantly accelerated the overall dataset generation.
By implementing these strategies, we ensured that the dataset generation was both efficient and scalable, enabling us to create the necessary volume of data for robust machine learning model training.
Floor Plan Generation
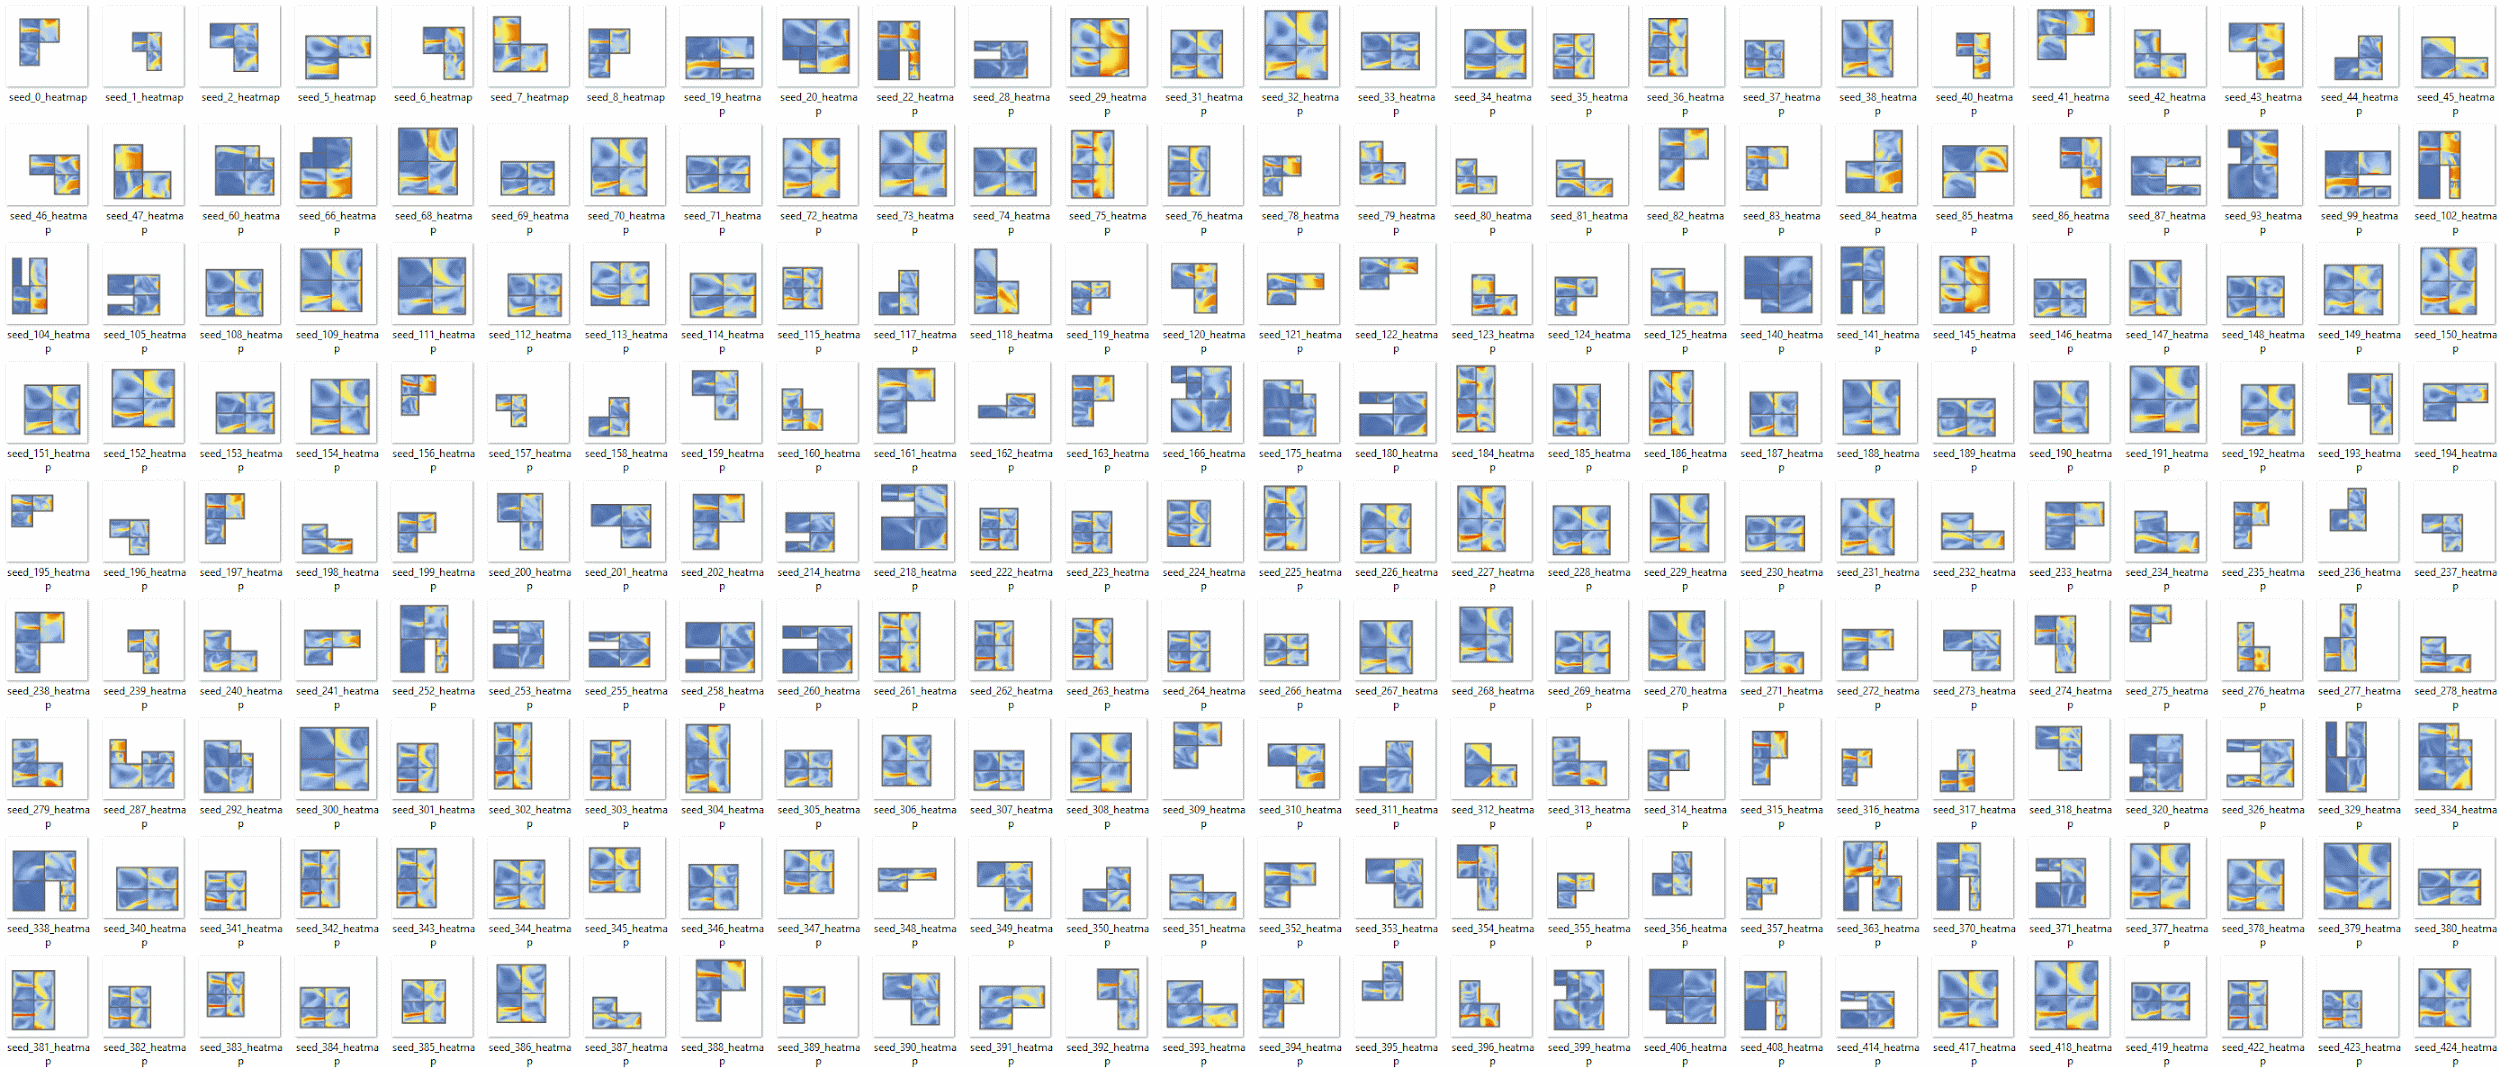
To provide our model with a diverse and comprehensive dataset, we developed a script capable of automatically generating a wide range of building floor plans. This script introduced variations in several key aspects to ensure a rich variety of data:
- Building Position: The script adjusted the position of the building within a predefined available area.
- Wall Arrangement: Both interior and exterior wall placements were varied, creating different spatial configurations.
- Room Count: The number of rooms within each building was varied between 3 and 6 to reflect diverse layouts.
- Window Dimensions and Locations: Window openings were varied between in size and location, ensuring different lighting and ventilation scenarios.
- Door Placement: The locations of door openings were also varied, with each room having a window on at least one side and connecting doors between rooms with fixed dimensions.
This automated approach ensured that each generated floor plan included windows on at least one side of each room and doors between adjoining rooms. By systematically varying these elements, we created a robust dataset that supports the development of a machine learning model capable of accurately simulating a wide array of indoor environments. This variability is crucial for training the model to handle different architectural designs and optimize them for natural ventilation and energy efficiency.
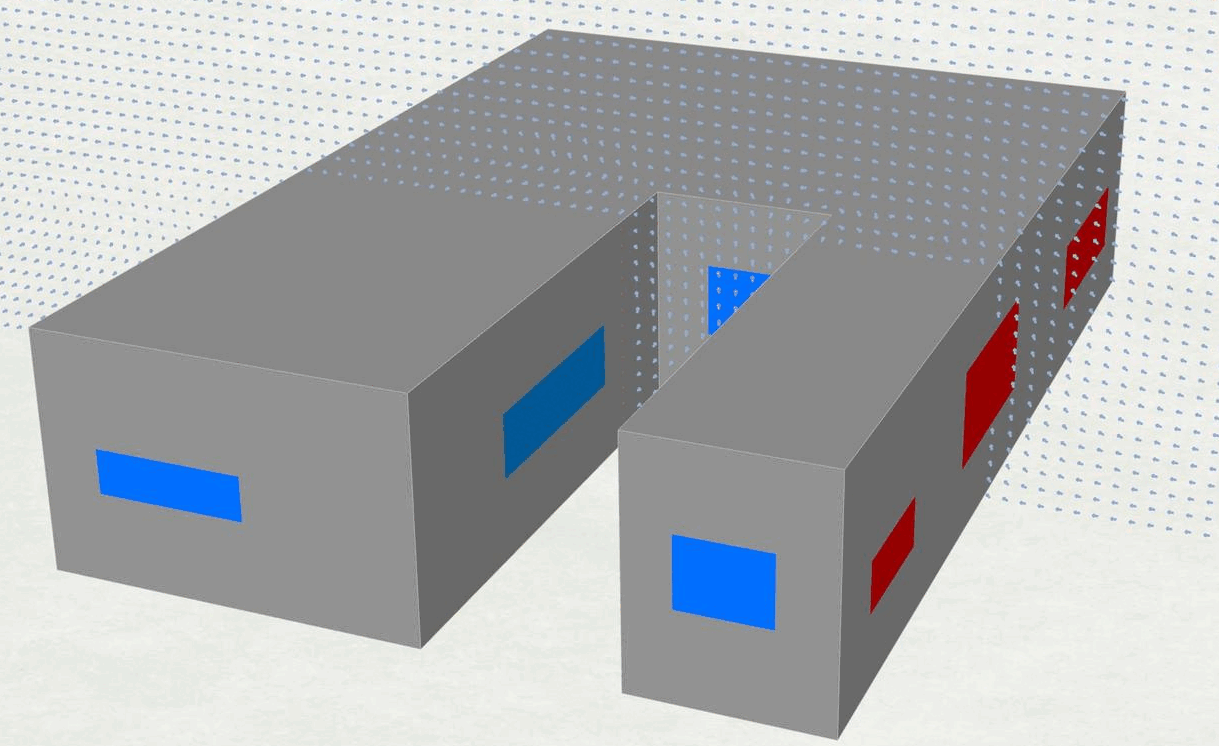
CFD Simulation Outdoor
Once the diverse floor plans were generated, we proceeded with outdoor CFD simulations to analyze each layout. The input parameters for this analysis included the floor plans and a constant wind speed of 3 m/s, chosen to represent a typical calm day. The wind direction was fixed to blow from the east, corresponding to the negative x-direction in the floor plans.
During the outdoor simulation, we recorded critical data for each window, including wind pressure, wind speed, and wind direction. The sign of the pressure determined whether a window would function as a flow inlet or outlet in the subsequent indoor simulation (negative pressure indicated an outlet). The specific wind speed and direction for each inlet were then used to define the airflow characteristics in the indoor simulation.
To ensure comprehensive and accurate results, the analysis included a larger spatial area in front of the windows, capturing how external wind conditions influence the building’s internal airflow. This detailed approach allowed us to set precise boundary conditions for the indoor CFD simulations, thereby improving the accuracy and relevance of our simulations.
CFD Simulation Indoor
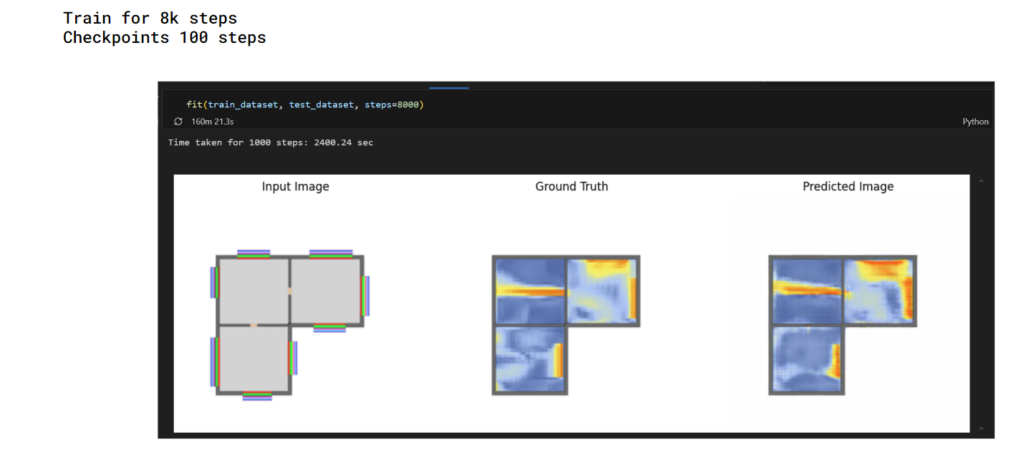
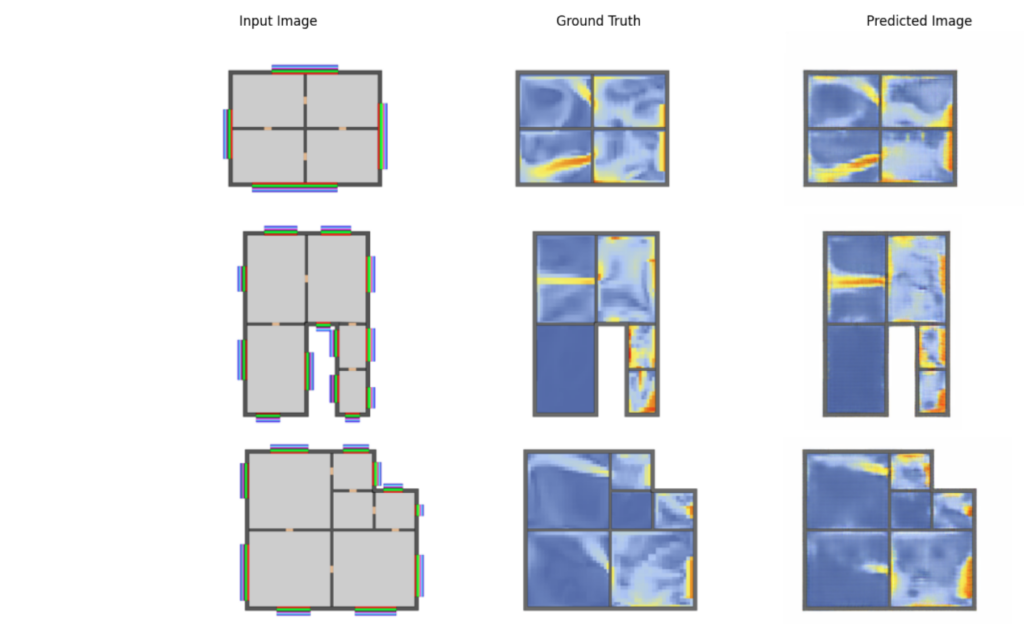
Building on the groundwork from the outdoor CFD analyses, we proceeded with the indoor simulations. These simulations aimed to generate heatmaps that visualize airflow patterns within the building. By utilizing the data from the outdoor simulations, including wind pressure, speed, and direction, we accurately defined the airflow conditions for the indoor environment.
Each indoor simulation was fully automated, similar to the previous scripts. Once a simulation was completed, the script automatically loaded the next floor plan and continued the process. This automation allowed us to run numerous simulations consecutively without manual intervention, significantly enhancing efficiency and productivity.
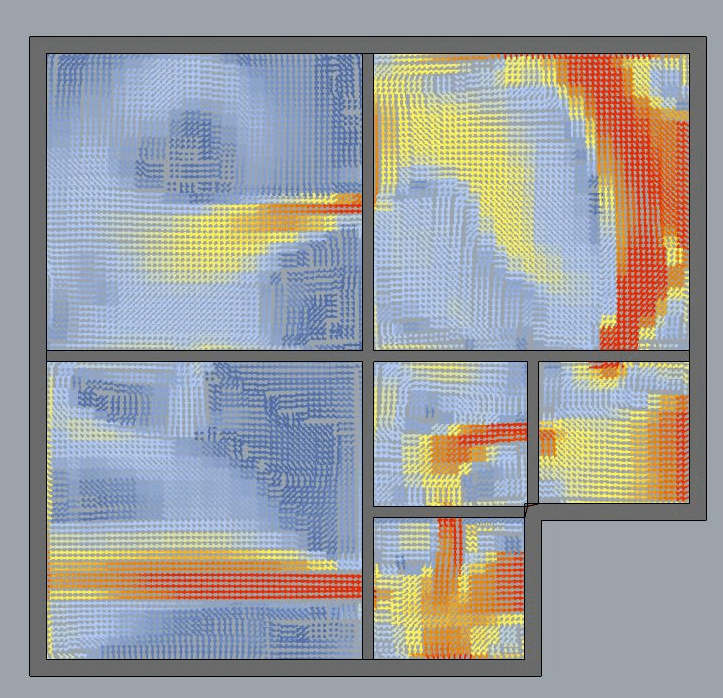
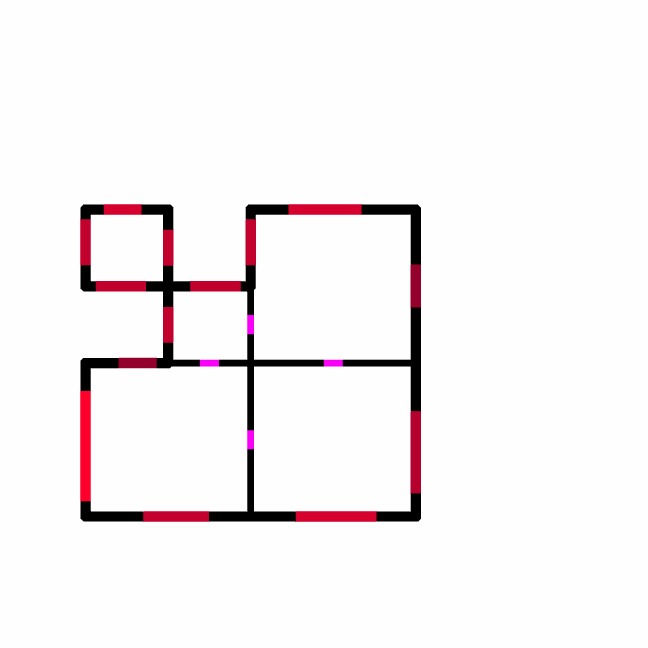
Color Coding Data
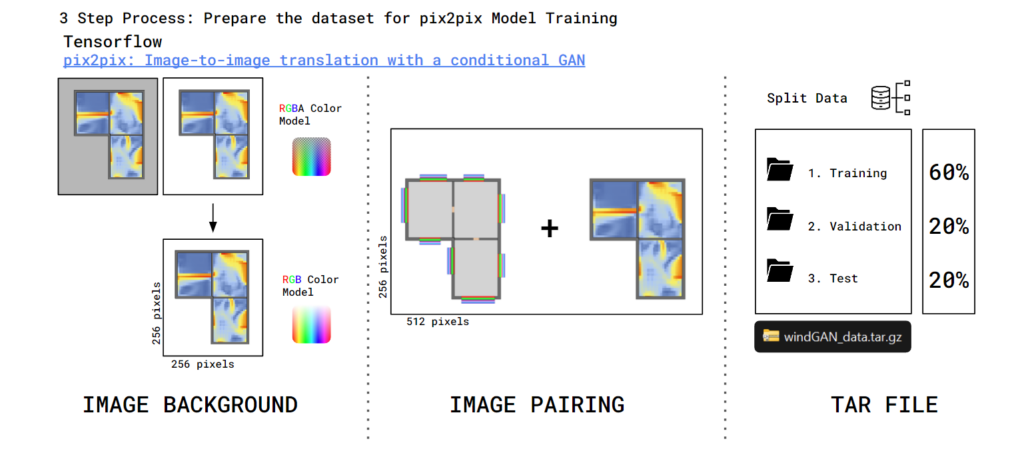
To ensure that all relevant data from the floor plans were included in the training of our model, we needed a way to visually encode this information. Simple visual inspection of the floor plans would not reveal all the necessary details, so we decided to use color coding to embed this data within the plans. This approach allowed us to incorporate complex data into the floor plans in a visual format that the machine learning model could interpret.
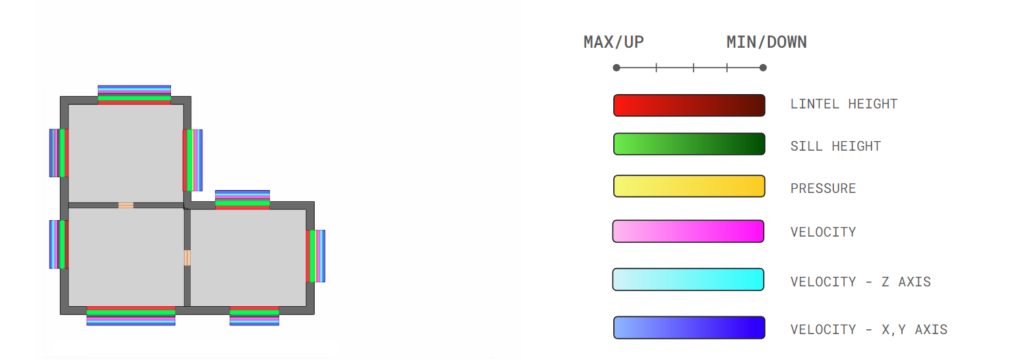
For each window, multiple color bars were created to represent the following properties:
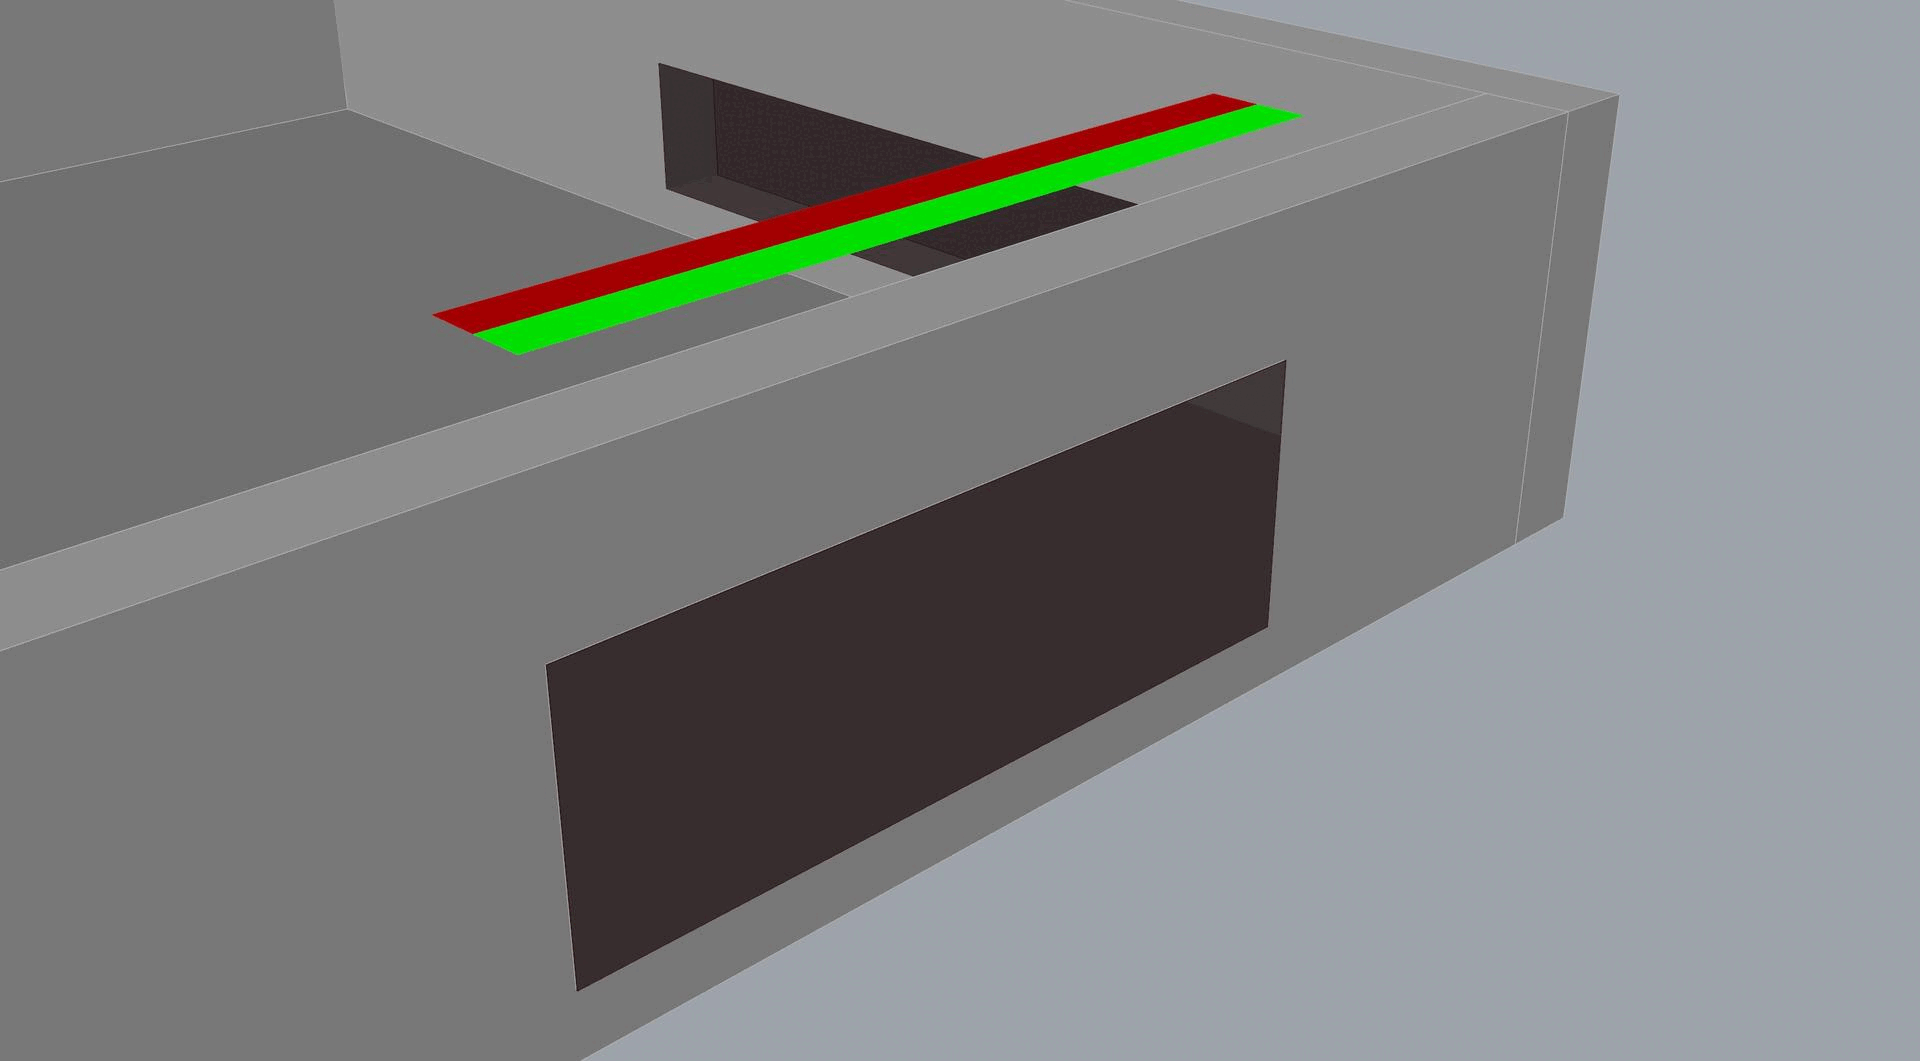
- Window Opening Height: The vertical dimension of the window opening.
- Window Sill Height: The height of the balustrade or window sill.
- Calculated Pressure: The wind pressure determined for each specific window.
- Calculated Wind Speed: The wind speed measured at each specific window.
- Z-Component of Wind Direction: The vertical component of the wind direction.
- Wind Direction in XY Plane: The horizontal wind direction represented as an angle in degrees from 0° to 360°.
Each property was assigned a distinct color range within the RGB color space. As the geometric parameters and simulation results varied, different RGB values were generated, resulting in unique color tones for each window’s properties.
2b. Model Training
Data Manipulation
Data Organization
Training
2c. Deployment
Backend Integration
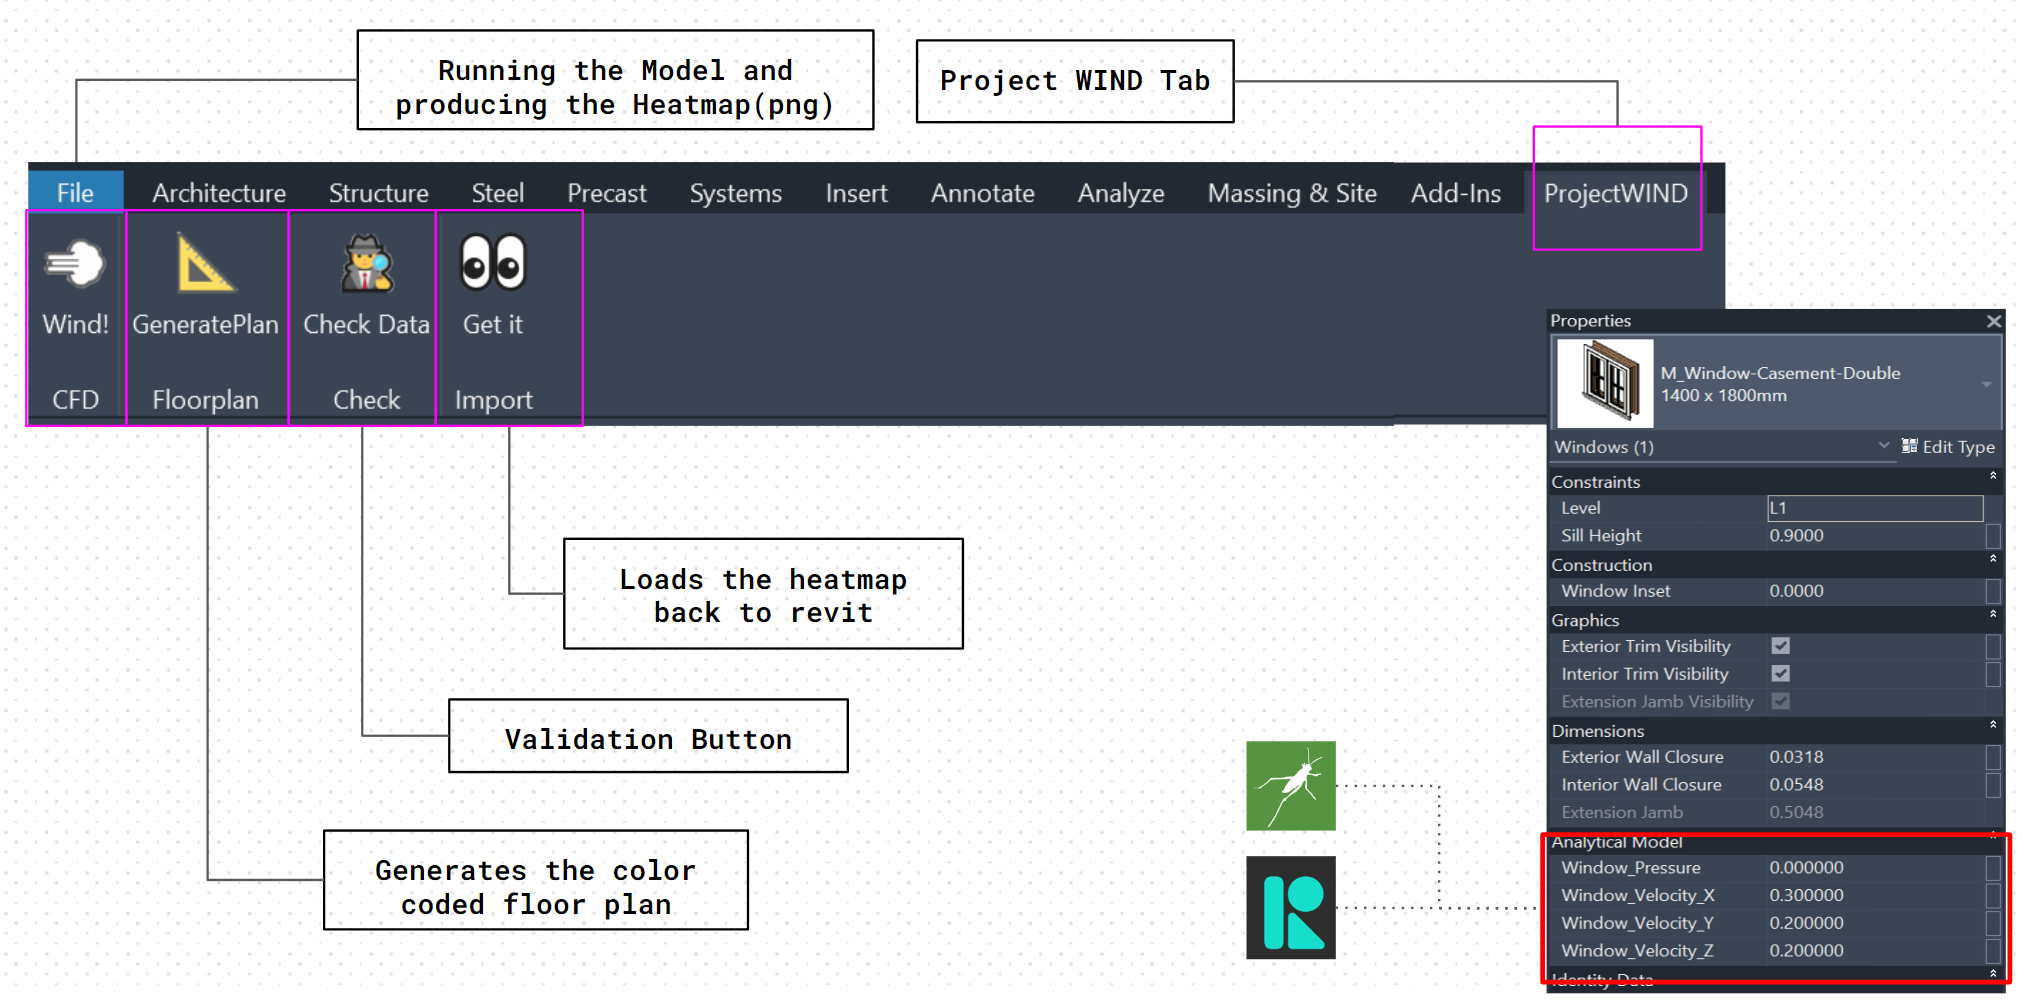
Our application is designed to be used by AEC (Architecture, Engineering, and Construction) experts, so we decided to integrate it as a plugin into commonly used CAD and BIM software. For our prototype, we chose Autodesk Revit due to its widespread use and robust capabilities.
For the prototype, we opted for local deployment to ensure that users could run the application independently without needing to rely on an internet connection or cloud services. However, for a fully developed application, transitioning to a cloud-based deployment would be ideal. This would eliminate the need for users to download large training datasets and manage local Python dependencies.
The trained .keras files for the generator and discriminator models are stored locally. We used pyRevit to execute various Python scripts and Rhino.Inside.Revit scripts, which in turn utilize these .keras files.
The workflow involves modeling a building floor in Revit, which is then converted into a floor plan with color-coded openings based on the criteria used during the training data generation. This floor plan is passed to the trained model, which generates the corresponding heatmap. The heatmap can then be overlaid onto the geometry in Revit. All generated floor plans and heatmaps are timestamped, serving as a log of the process.
Frontend Design
From the user’s perspective, executing our plugin adds a new tab in Revit with four buttons. We chose to break down the steps into smaller, manageable tasks, though combining steps in future iterations is possible.
- Check Data: This button ensures that all windows have wind pressure and speed values assigned, using instance parameters in Revit. The routine checks for the presence of these values and verifies that they fall within a reasonable range. This step is temporary for the prototype, as the final version will ideally automate data input.
- Generate Floorplan: This button creates a floor plan of the currently opened view in Revit. The floor plan is saved in the background with a timestamp, and the openings are color-coded as required by the model.
- Wind!: This button runs the model. It reads the most recently saved floor plan from a monitored folder and generates the corresponding CFD heatmap using the trained model.
- Import: The final button imports the heatmap back into Revit, placing it under the modeled geometry for easy visualization.
This workflow allows users to quickly iterate on their building designs and obtain visual results within seconds, significantly speeding up the design process.
2d. Demonstration
https://www.youtube.com/watch?v=otno4wvQ6zI
3. Conclusions
3a. Future Steps
While our project has demonstrated the feasibility of using machine learning to speed up CFD simulations for indoor wind flow, several steps are necessary to make this approach practical and widely usable:
- Expanding the Dataset: To manage our dataset within the available time, we fixed or limited certain parameters like wind direction and the number of rooms. For a more robust model, the dataset should be expanded to include a wider range of variables and more diverse scenarios. This would enhance the model’s ability to generalize and perform accurately in a variety of conditions.
- Enhanced Analytical Capabilities in Revit: Currently, our Revit plugin displays heatmaps, but deeper analytical features would be beneficial. For instance, numerical analyses comparing maximum air speeds across different designs or evaluating airflow rates could provide more actionable insights for designers.
- Cloud Deployment: While a local deployment was suitable for our project, allowing users to run the app independently, a cloud-based solution would be more practical for a full-scale application. This approach would eliminate the need for users to store large, trained .keras files locally. Instead, users could upload the color-coded images and receive analysis results from the cloud, ensuring more efficient and accessible processing.
- Realistic Door and Window Features: In our current model, doors and windows are treated as simple openings. To achieve more realistic simulations, we should implement features that allow windows and doors to be “closed” (potentially managed via instance parameters in Revit). Additionally, incorporating properties that affect airflow, such as leakage rates and surface roughness, would enhance the accuracy of the simulations.
- Automatic Data Entry: In our current Revit prototype, pressure and velocity values for each window must be entered manually. Ideally, these values could be obtained from a platform that determines them in near real-time, similar to our app. For instance, integration with a service like Infrared.city could streamline this process.
- Improved Color Coding: We discovered a more effective and simpler method for color coding later in the project. However, due to time constraints, we continued with the original method, which could lead to slight RGB value discrepancies and affect heatmap quality. Implementing the new color coding method in future iterations would likely result in higher quality and more accurate simulations.
3b. Final Remarks
This project has successfully demonstrated the potential of using machine learning to enhance CFD simulations, making them faster and more accessible. By addressing the identified challenges and implementing the proposed future steps, we can develop a powerful tool that significantly improves building design processes. Our approach not only offers practical benefits for engineers and designers but also contributes to more sustainable and energy-efficient buildings. The integration of advanced simulation techniques and machine learning marks a promising advancement in the field of architecture and engineering.
