
This article presents our Workshop 1.2 project, which focuses on analyzing data and translating it into robotic movements to control an ABB IRB 6700-150/3.20 industrial robot equipped with a plastic pellet extruder for additive manufacturing. The core concept of the project involved studying the tsunami-related terrain and displacement data, extracting spatial and intensity-based information to generate data-driven robotic motion and fabrication logic.
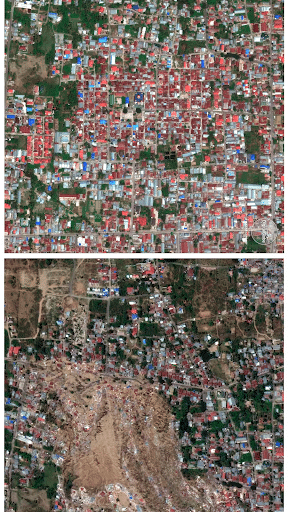
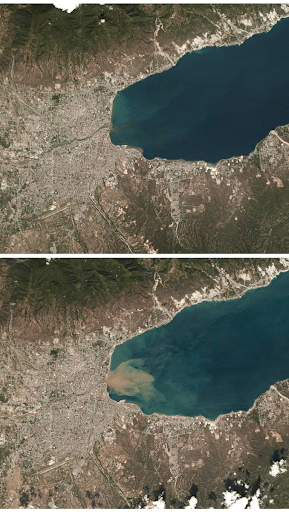
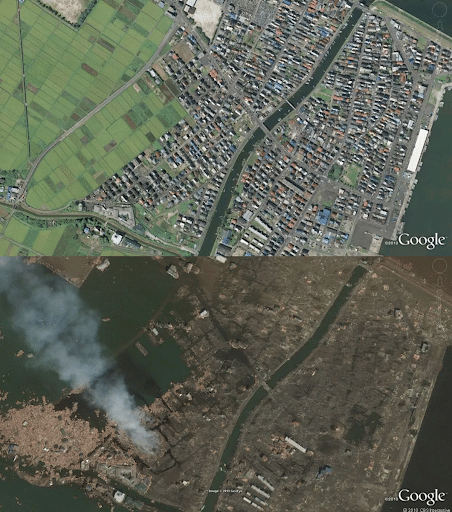
We began by selecting satellite imagery from tsunami-affected regions in Japan and Indonesia as our base dataset. These images were treated not as visual references but as raw data fields containing spatial information such as contrast, density, and terrain variation. By using real-world satellite data, the project establishes a direct link between environmental phenomena and computational processes, forming the foundation for extracting features that could later be translated into geometry and robotic motion.

The satellite imagery was processed using the Scale-Invariant Feature Transform (SIFT) algorithm to extract key spatial features from the image. These features represent points of high contrast, edges, and structural variation within the terrain and urban fabric. The resulting point clusters convert visual information into numerical data, allowing the image to be abstracted into a dataset that can be further analyzed, filtered, and translated into geometric and robotic logic.
Tsunami Impact Mapping and Terrain Translation
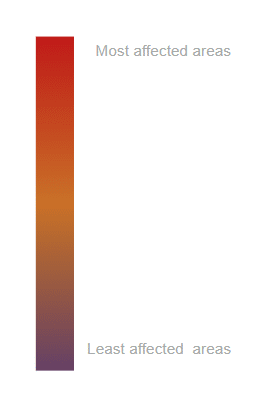
This represents a 3D terrain model generated from tsunami displacement data, where geographic information is translated into spatial height and color intensity. The surface represents terrain deformation caused by tsunami events, with color gradients used to visualize the level of impact across the landscape. Areas shown in red indicate regions with the highest displacement and damage, while purple areas represent zones that were least affected.
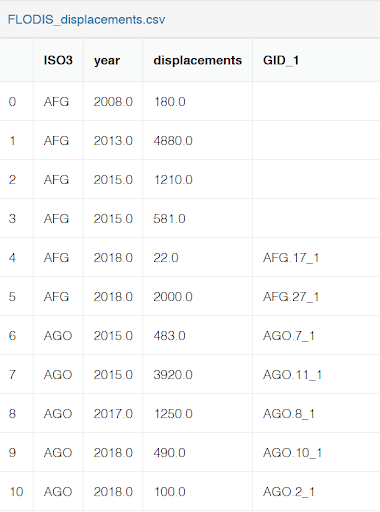
The dataset used for this visualization is sourced from recorded tsunami displacement data, allowing real-world environmental impact to be mapped onto a continuous surface. By converting numerical displacement values into topography, the map becomes an interpretable spatial field that later informs geometric manipulation and robotic fabrication logic.

PCA Filtering and Surface Generation
This next step illustrates the process of refining tsunami displacement data through Principal Component Analysis (PCA) and translating it into a series of patched surfaces. On the left, the point cloud represents tsunami displacement values after PCA filtering, where noise is reduced and dominant spatial patterns are retained. The vectors indicate the principal directions of variation within the dataset, helping to identify the most significant spatial trends.
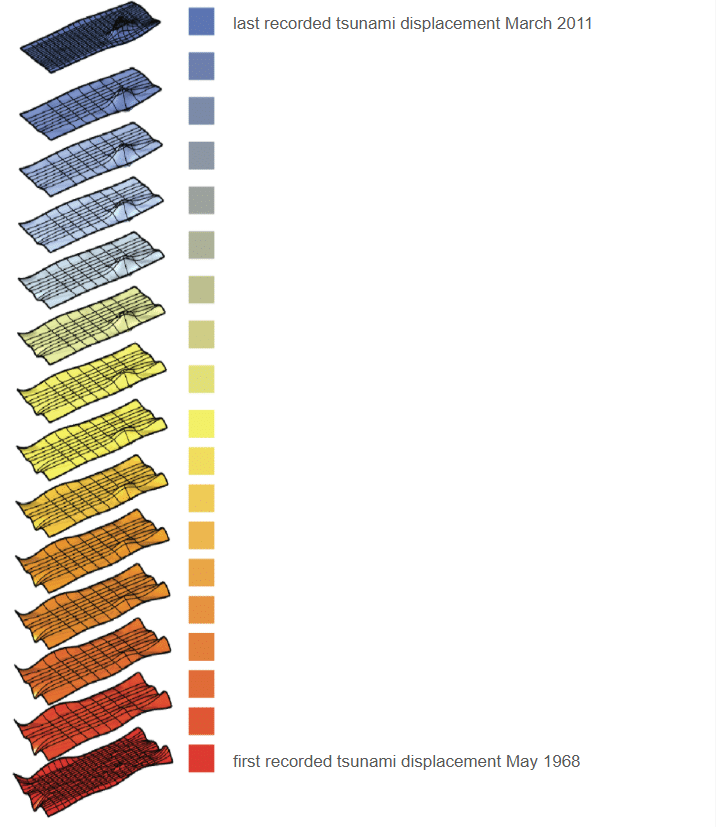
On the right, the filtered point cloud is used to generate patched surfaces across a defined data range. Each surface layer corresponds to a specific displacement interval, arranged chronologically from the earliest recorded tsunami displacement (May 1968) to the most recent event (March 2011). The color gradient visualizes this progression, allowing temporal change and intensity to be read spatially. These layered surfaces form the geometric basis for later robotic toolpath generation and additive manufacturing.
Re-mapping Processed Data onto the Geographic Context
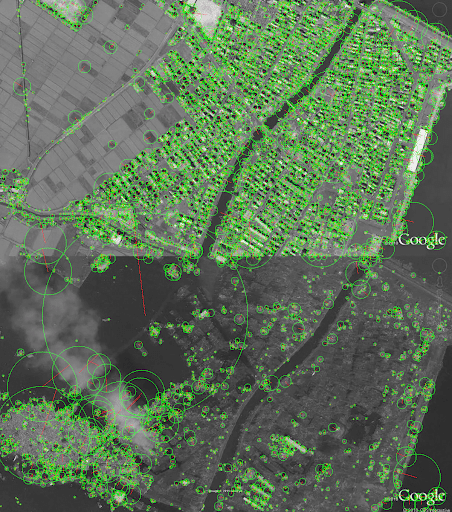
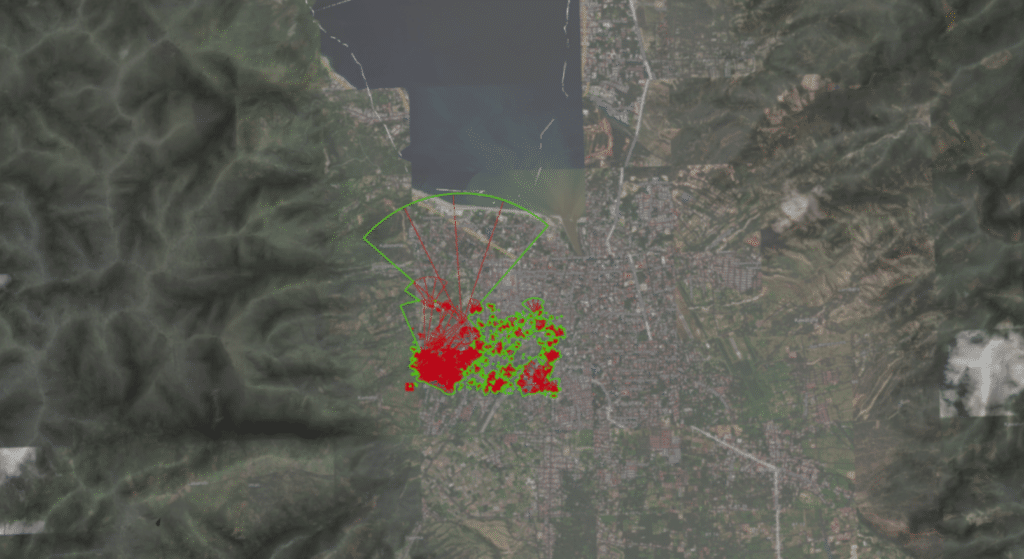
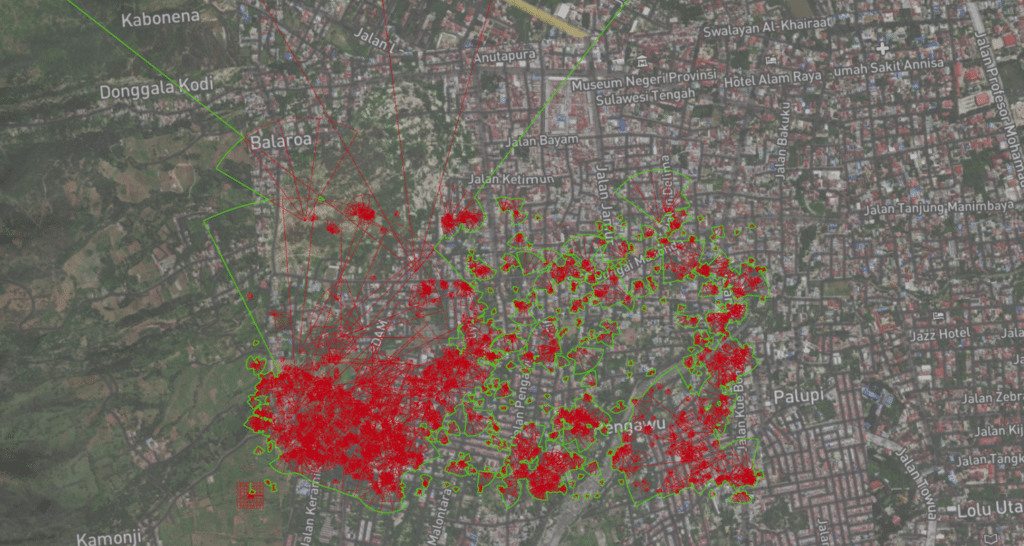
The next step shows the reintroduction of the processed dataset back onto its original geographic context. After extracting features and filtering the data, the point cloud and directional vectors are overlaid onto satellite imagery of the site. This step allows the abstracted data to be spatially verified and interpreted in relation to real terrain, urban density, and coastal proximity.
The red clusters represent areas of higher data intensity and displacement, while the green points indicate secondary or less intense spatial features. The fan-shaped vectors illustrate dominant directional tendencies within the dataset, suggesting how tsunami forces propagated inland from the coastline. By visualizing the data directly on the map, patterns of impact, concentration, and directionality become legible at an urban scale.
This spatial mapping acts as a bridge between data abstraction and physical fabrication. It ensures that the geometric logic developed in Rhino remains grounded in real-world geography before being translated into surface generation and robotic toolpaths.
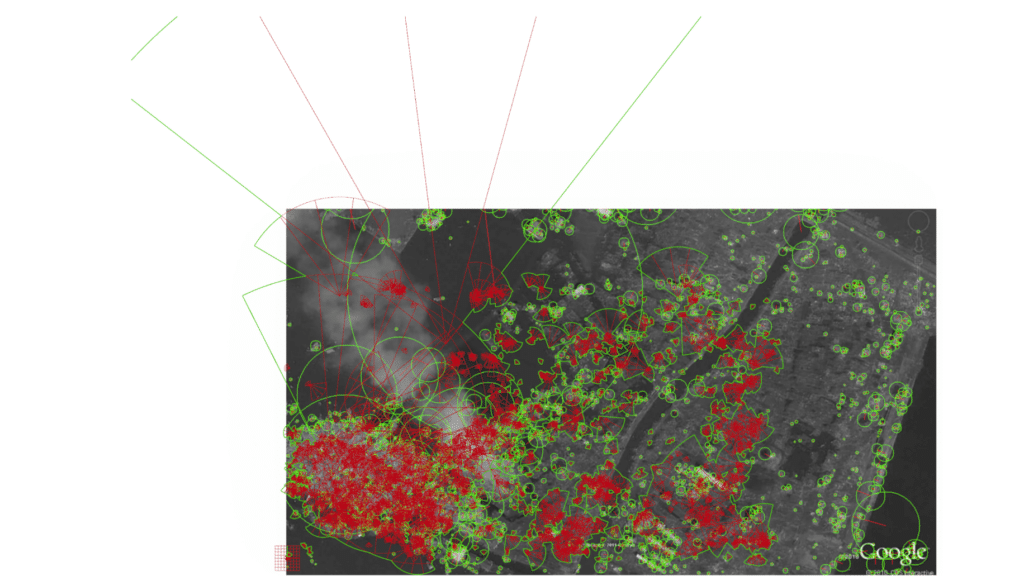
SIFT feature points and directional vectors overlaid on satellite imagery, revealing intensity, directionality, and spatial distribution of tsunami effects.
From SIFT to Rhino: Translating Image Data into Geometry
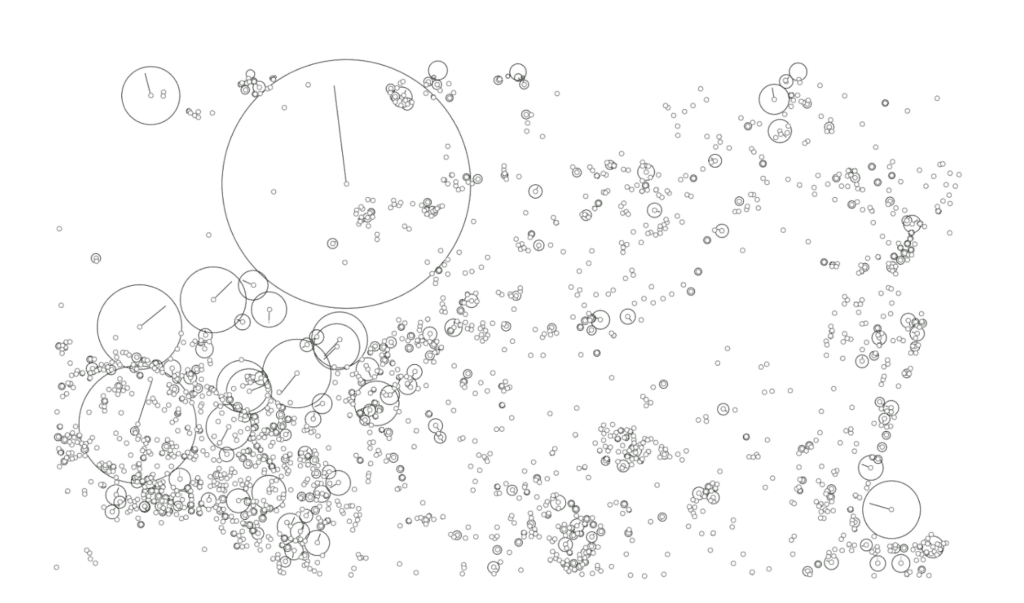
This step illustrates the transition from image-based feature extraction to a geometric environment. Feature points generated through the SIFT algorithm are imported into Rhino as a point cloud, where each point represents a spatial feature detected in the original satellite imagery. Variations in circle size correspond to differences in feature scale and intensity, while the vectors indicate dominant directional tendencies within the dataset.
By transferring the data into Rhino, the visual information embedded in the map is fully abstracted into geometric entities. This step marks a critical shift in the workflow, where data is no longer interpreted as an image or map, but as spatial geometry that can be filtered, manipulated, and ultimately used to generate surfaces and robotic toolpaths.
