Urban void as a potential: Redefinition of a marginalized-industrial area by an auto-sufficient
and tailorized production system relying on km0 recycled waste materials
Manifest
The intention is to design a hub between an industrial landscape and a small residential zone that will revitalize the surrounding area. This process will lead to the redefinition of a marginalized-industrial area by an auto-sufficient and tailorized production system relying on km0 recycled waste materials.
Two main factors give us that direction: the area’s social characteristics and the industrial character. Considering these in the initial analysis combined with the different types of industrial waste prompted us to design a fabrication laboratory. An open makerspace for education, a place for hands-on learning with all the tools for creativity. The raw material of production will be a waste of the local industry and the residentes.
Based on this strategy, the goal is to foster the knowledge of the population towards the recycling process, the circular economy and encouraging the education and approach to the industrial work environment by giving the access of machinery that will boost the ability of the population to design their own needed items.
1_ Context Analysis
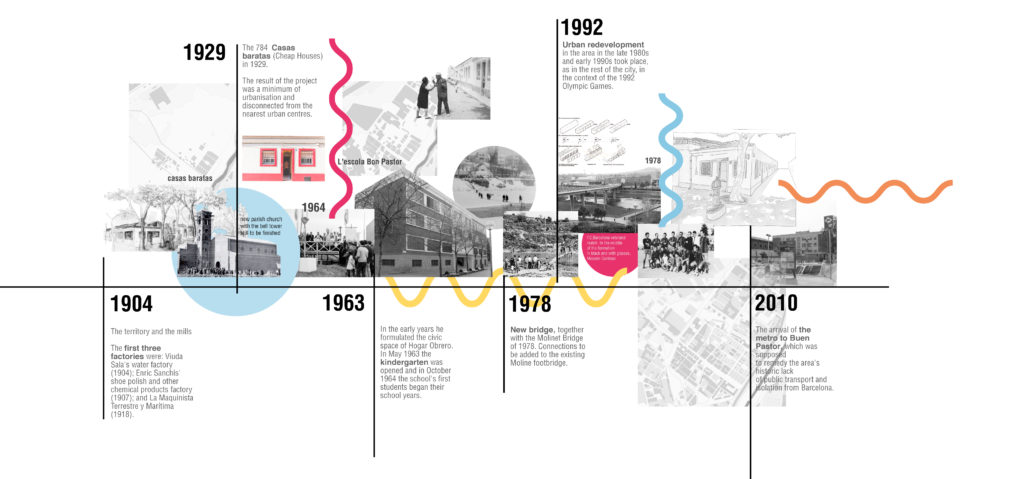
The site is on the border of the city, next to the river Besòs. It is integrated into the industrial area of El Bon Pastor. It is detached from the center despite the ease of access to the surrounding area. Also there is a difficult to cross the opposite river area. The area is marginated and inactive.
Main points:
- Industrial area
- Housing Area
- Natural surrounding
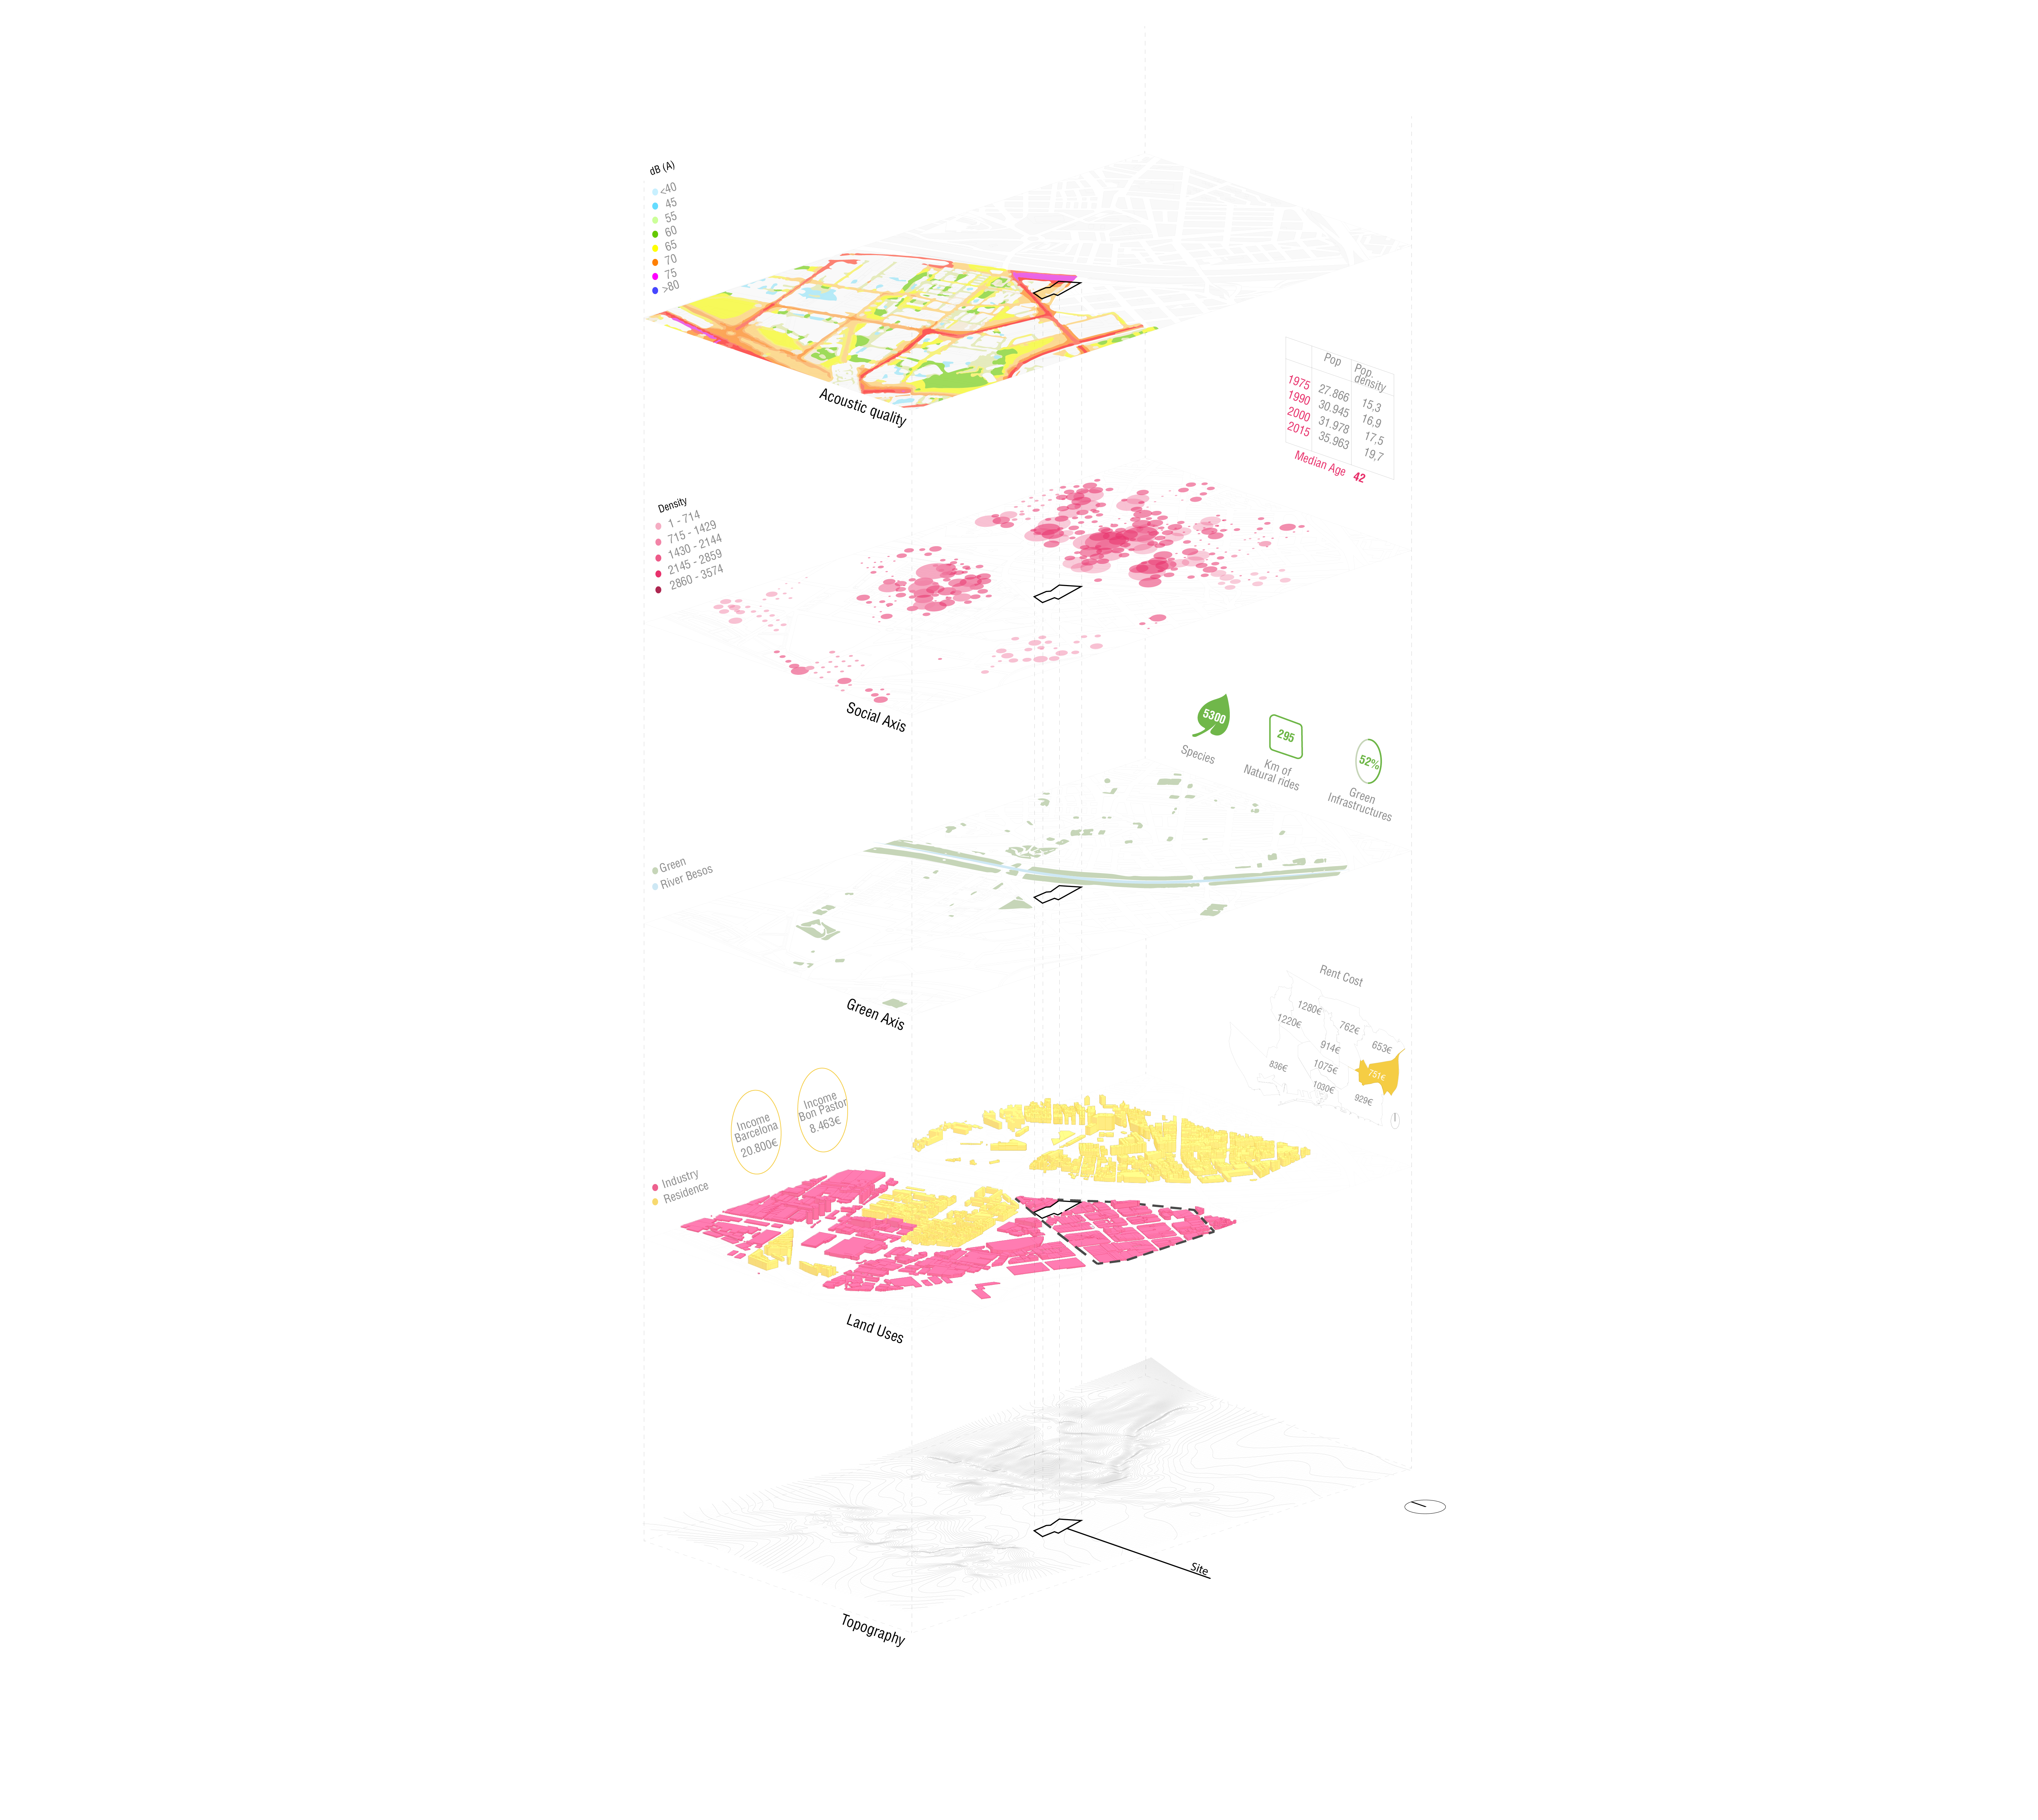
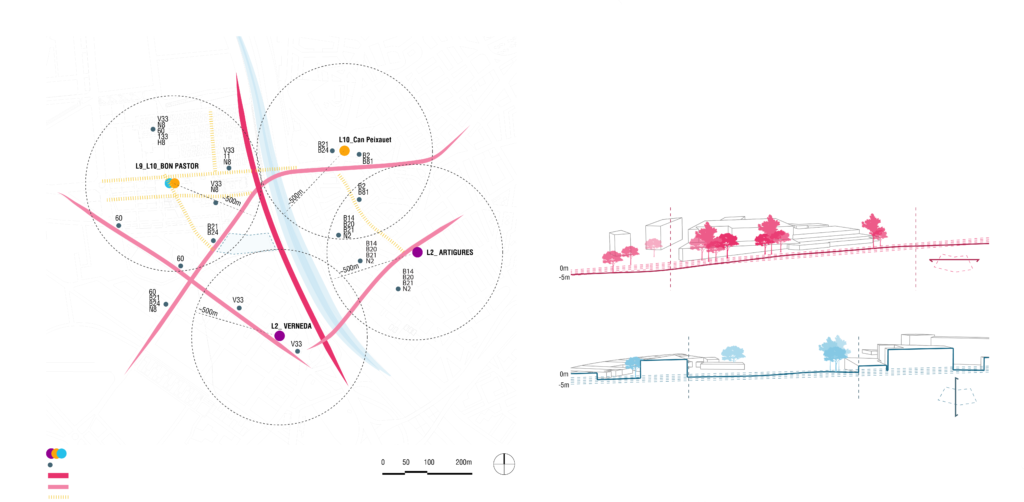
Barcelona has an important natural heritage thanks to the magnitude of Collserola mountains, which limits the city. Due to the extenze development of the built city many different Green Project has been activated over the years. The image highlight the Green Infrastructures (GI) that are in their process to be developed: at the moment there are 361 urban garden, and every person has 17.33m2 of green, that goes to 10.64 if are considered just the natural reserves.
The road Ronda Litoral has 85-90 dB(A) this means that permissible exposed time is max 4-1h, otherwise can damage the hearing. ?herefore, in this side of our side we need a element for sound absorption to manage that.
The social gatherings are happening afar from the site and that they mainly overlap with green areas. There is a tendency for people to choose central green areas, where many activities are planned. In the considered site there are no specific programs or activities for people.
The industry in the city is located generally on the borders. Almost a quarter of Spanish exports come from Catalonia, and three-quarters of Catalan industry is concentrated in the Barcelona area, which provides about one-fifth of Spain’s industrial output. Chemicals, pharmaceuticals, automobiles, electronics, and appliance manufacturing are among Barcelona’s leading industries. Within the framework of the Municipal Neighbourhood Plan and in line with the economic development plans Barcelona Activa has made a specific catalogue available of “Services and programmes for industrial companies” to provide support for industrial activities, particularly manufacturing. Services include the creation of a technical industrial estate revitalisation model for the Bon Pastor and Marina Industrial Estates, carrying out energy consultancy and rolling out a tailor-made marketing and sales programme.
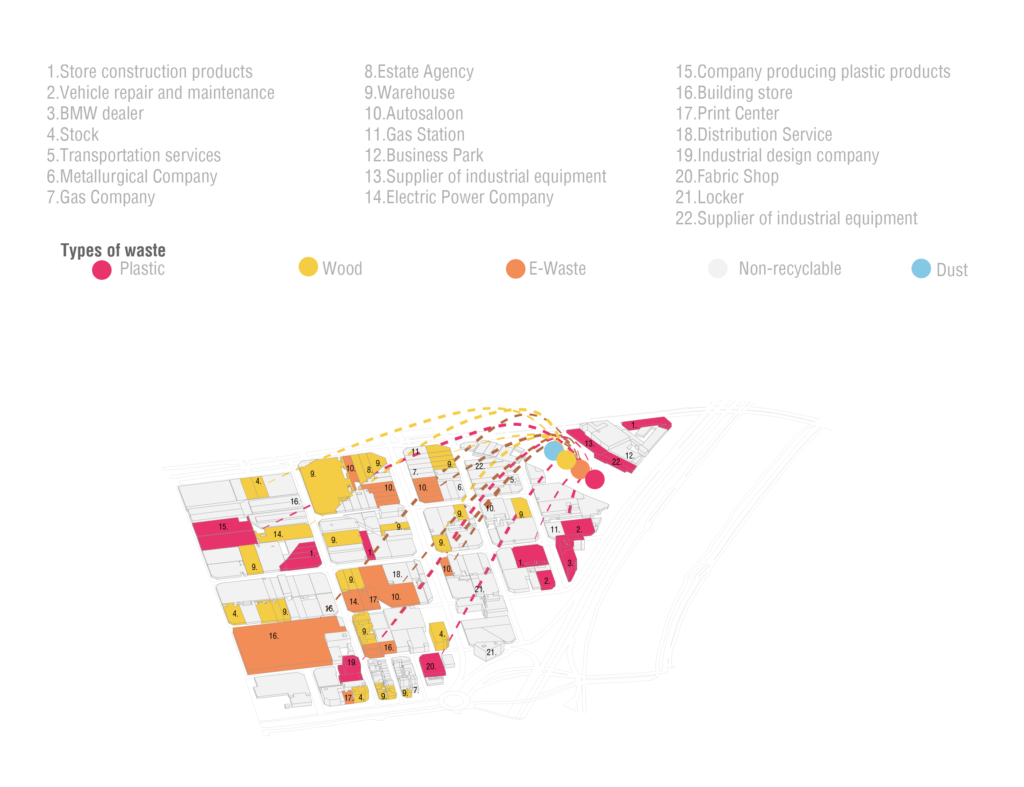
By means of on-site surveys, cartographic research and online GIS, it was possible to collect specific data on the categories of industries present in the surrounding area.. This analysis is very interesting as it provides information indirectly also on the type of waste.
2_ Site Analysis
By Access in the area is easy, there are four metro stations and some bus stops. The main circulation roads for cars are the road Ronda Litoral, C. de Santander, and C. de Fra Juníper Serra. However, the walkability is better in the housing area and on the side of the river. In the industrial area where is our site due to the scale of the building environment and the inaction, there is not so much movement of people.
The altitude difference is around 5m in the horizontal direction and 2m in the vertical direction. At the north there are the most high buildings around 10-15m.
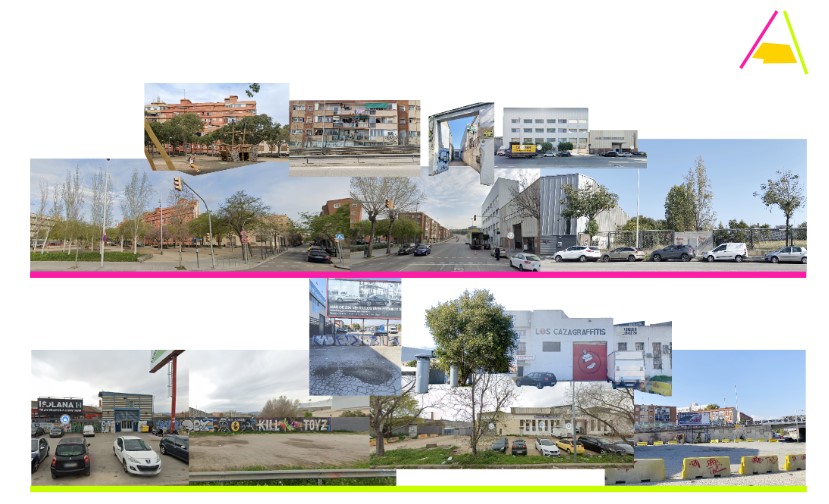
Picture from the Authors
3_ Waste Analysis
Which is the dynamic of the area?
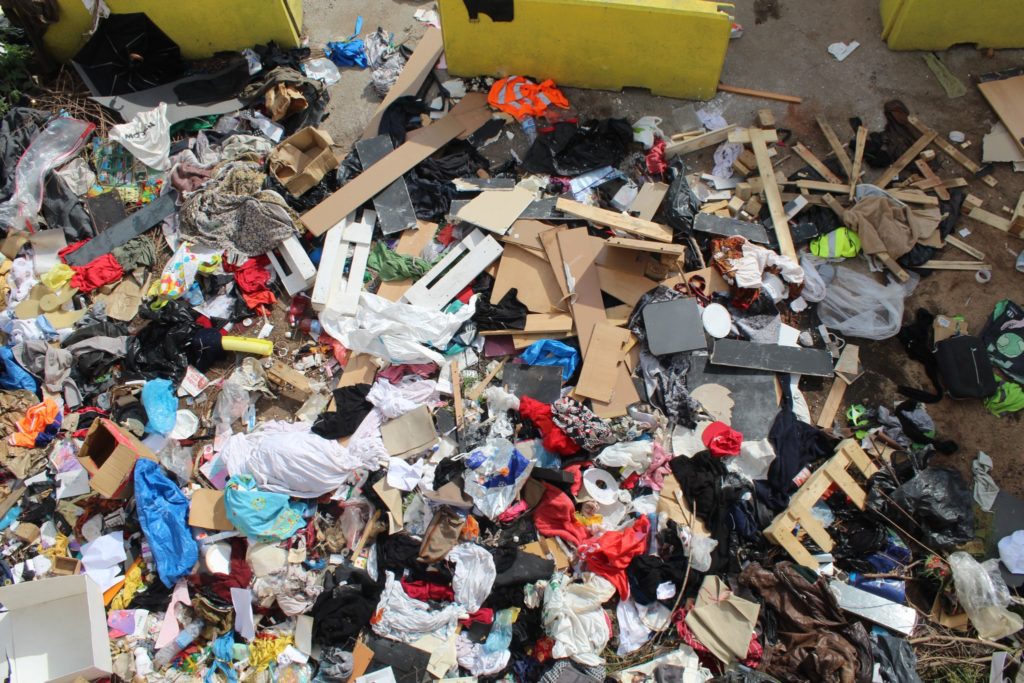
Picture from the Authors
Location: 41.435360, 2.208757
Can we transform the waste material?
Local industry and residents can participate actively in a recycle process?
The surrounding industrial district produces a specific range of waste: the diagram starts with the local industries located in the area, firstly pointing out to which category their waste belongs to, then subsequently narrow to the main types of waste products attributable to the previous classification.
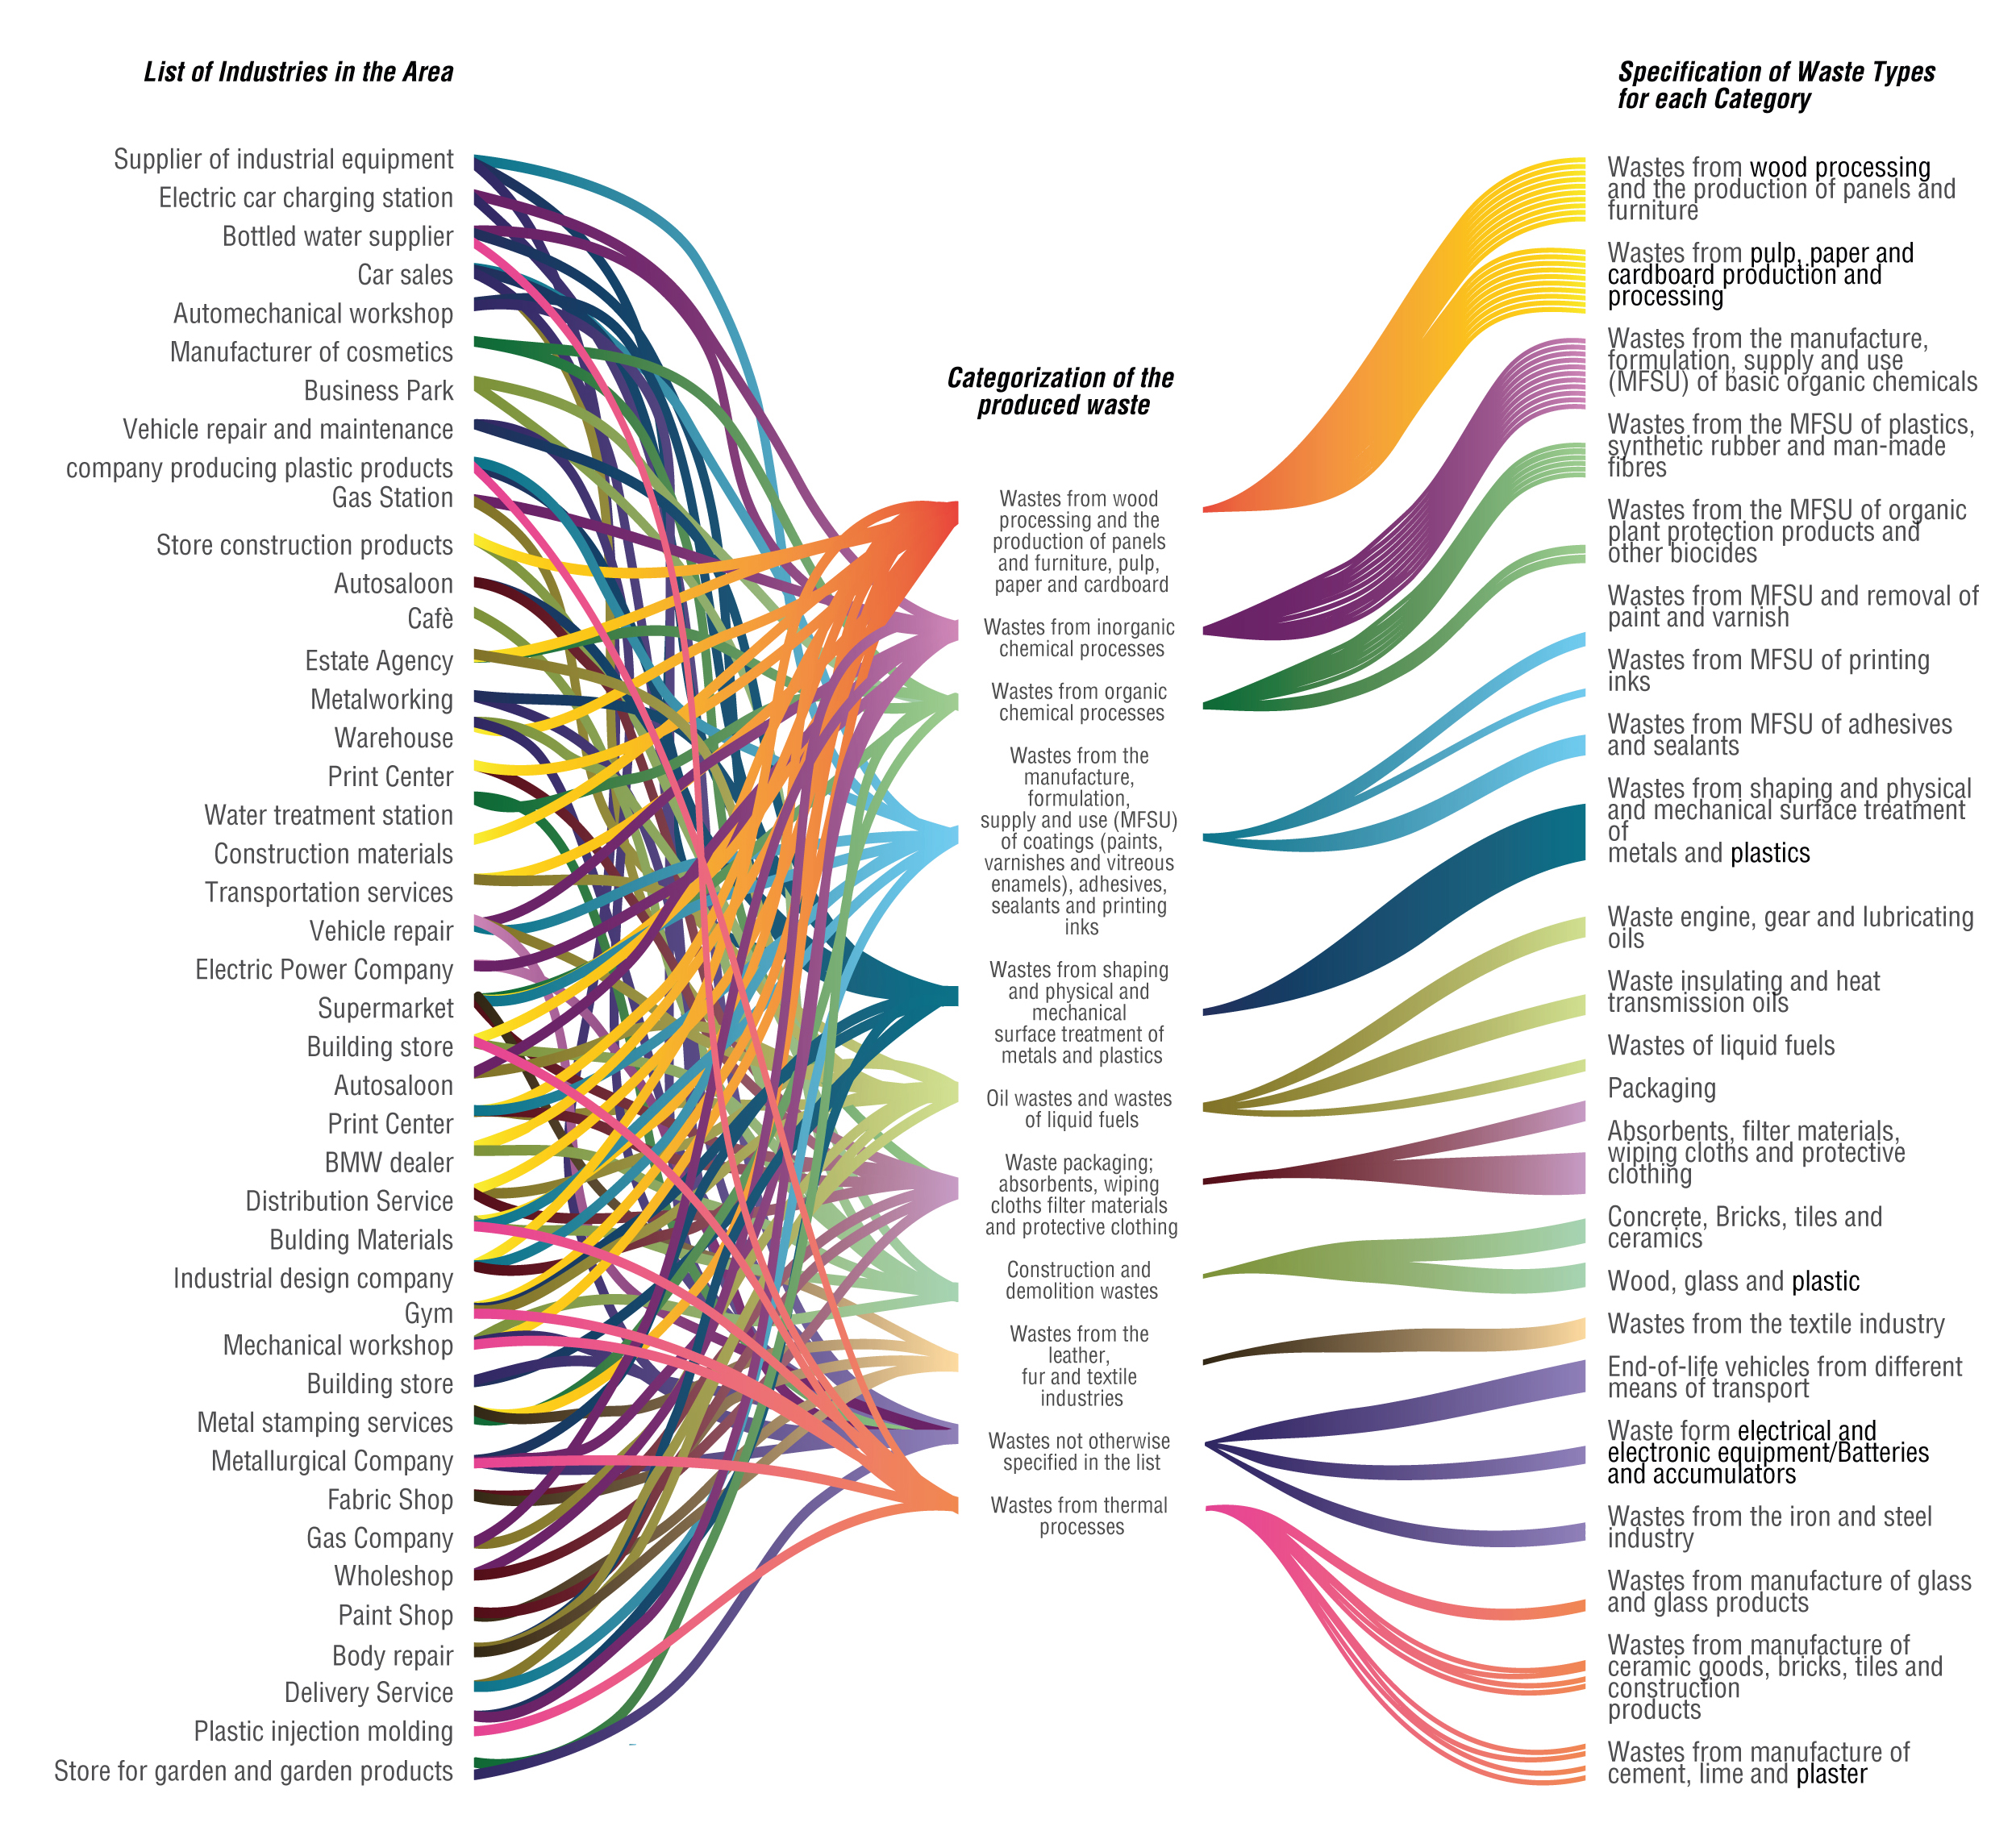
This categorization follows the organization setted by EPA in “Waste Classification”, 2015.
Waste Processes: Plastic, Wood, E-Waste, Dust.
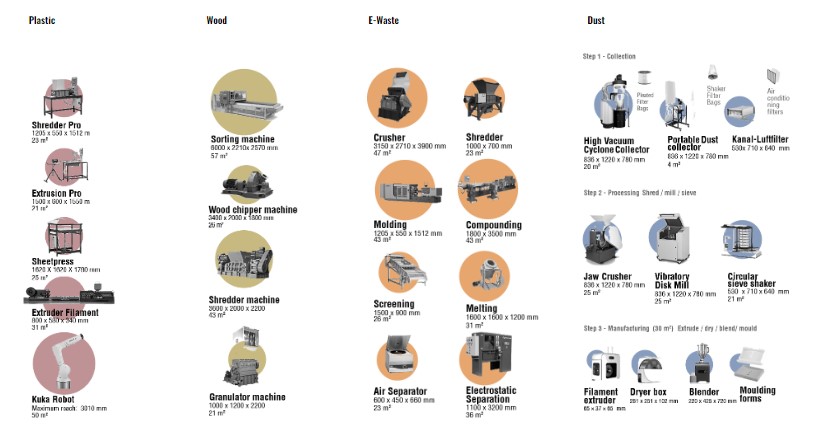
By knowing which are the most common type of waste produced, the nest step is to understand how each of the processes of recycling works.
The objective of the diagram below is to explicitly compare the processes and variables involved in each of the 4 recycling cycles considered: plastic, wood, e-waste and dust. Variables such as the production of noise, of additional dust, how much is the daily productivity of each machine and how much energy is consumed are the parameters taken into account to deepen the study of the four expected processes, In order to understand how and where best to allocate each of the actions that each machine provides.
Which are the conclusions of this analysis? It can be inferred that processes such as plastic and dust recycling use relatively less noisy machinery than wood and plastic; where there are peaks up to 122dB for some machinery involved in the recycling of wood, which will therefore need specific environments and strategies to reduce the sound. However, these same machines at the same time guarantee the highest amount of recycled material every day. It is estimated that, for example, with the Sheetpress, hypothetically producing 5 sheets of plastic per hour, it is possible to recycle 800 kg of plastic per day. With the wood shredder up to 150 tons of chips per day might be produced.
A noticeable difference!
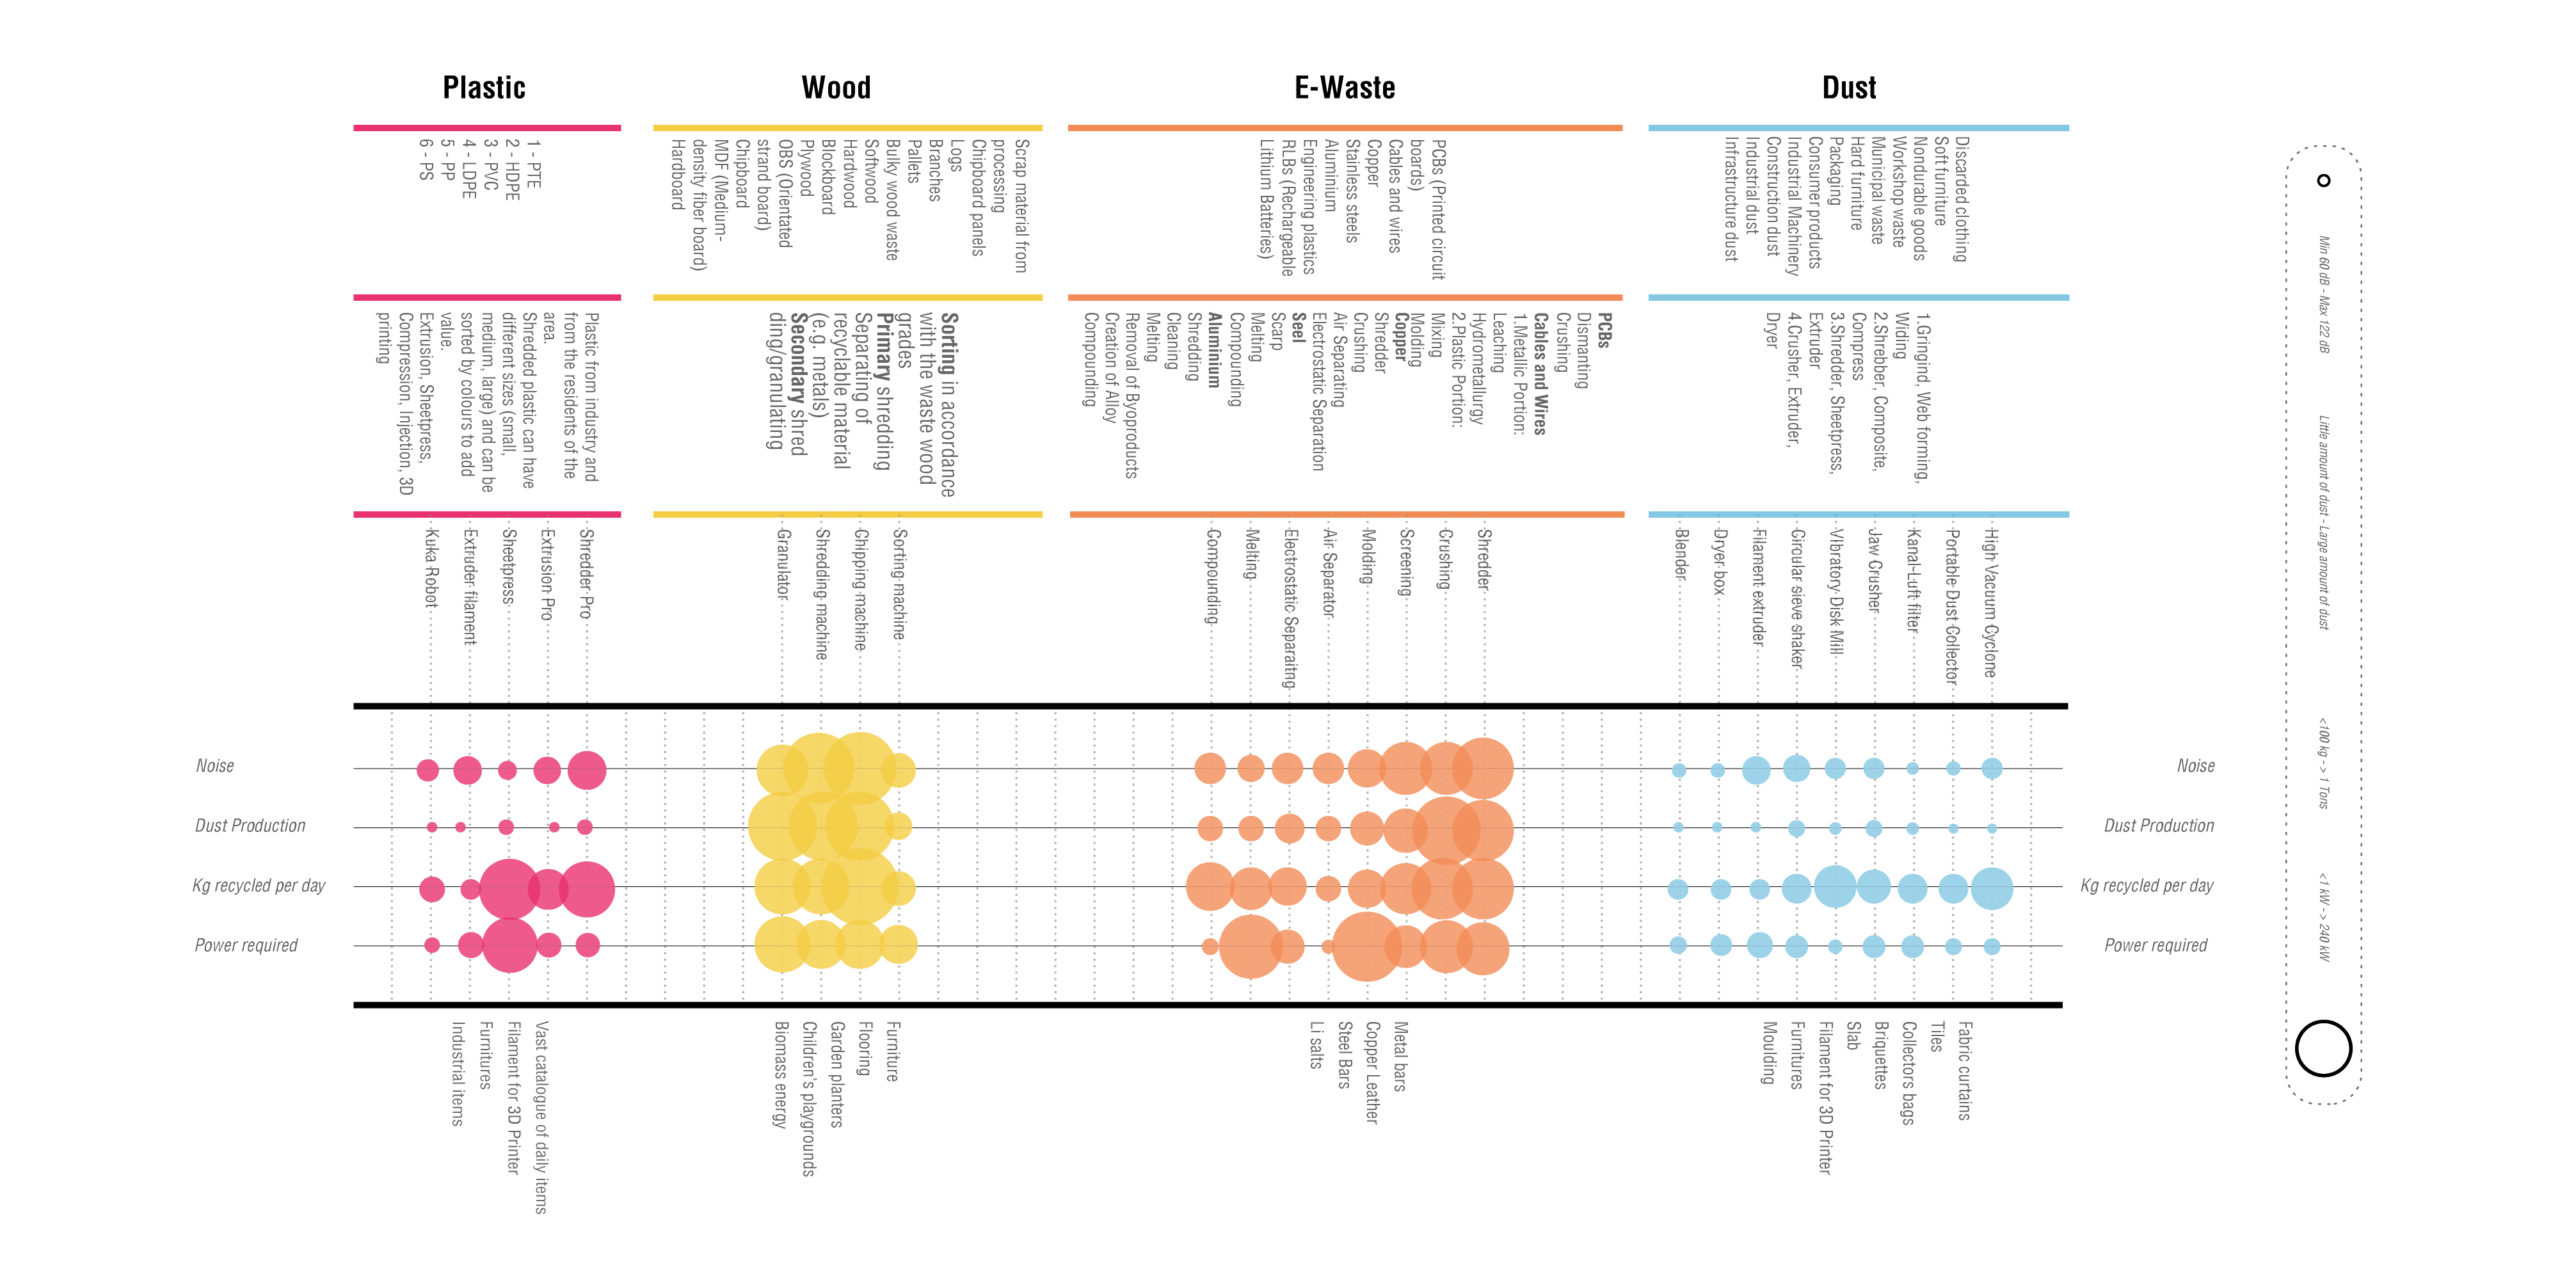
Thanks to these data, it has been possible to understand the capabilities of each machine to recycle waste from the scratch. Plastic and Dust cycles can recycle a very little amount if compared to Wood and E-Waste, but at the same time the amount of plastic waste is much more bigger that the one made out of dust. Because of this reason, in the site the Plastic Process is used more than once.
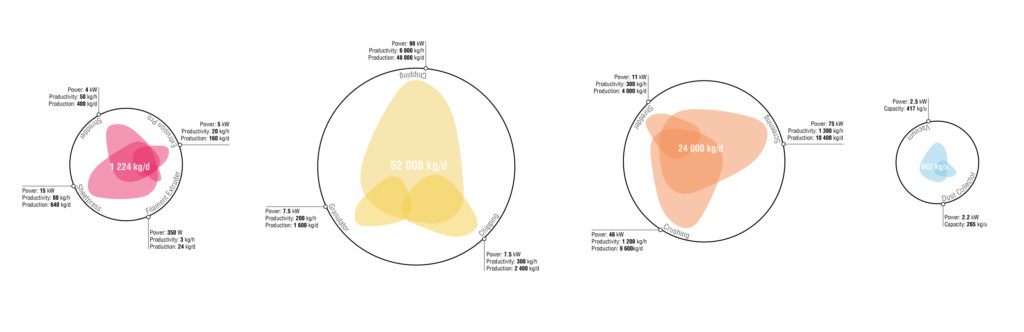
Plastic: 1 224 kg/d – Wood: 52 000 kg/d – E-Waste: 24 000 kg/d – Dust: 682 kg/u
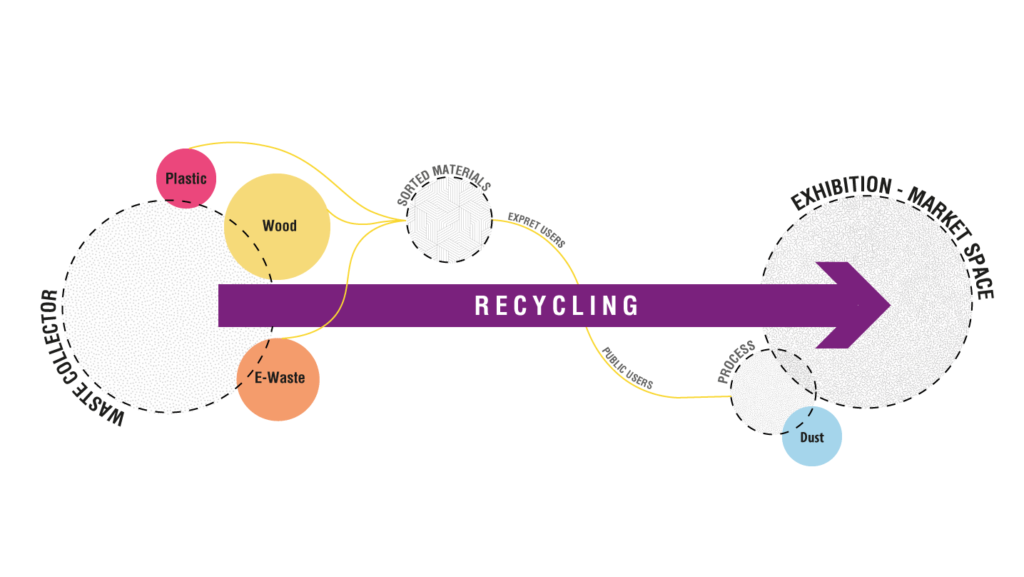
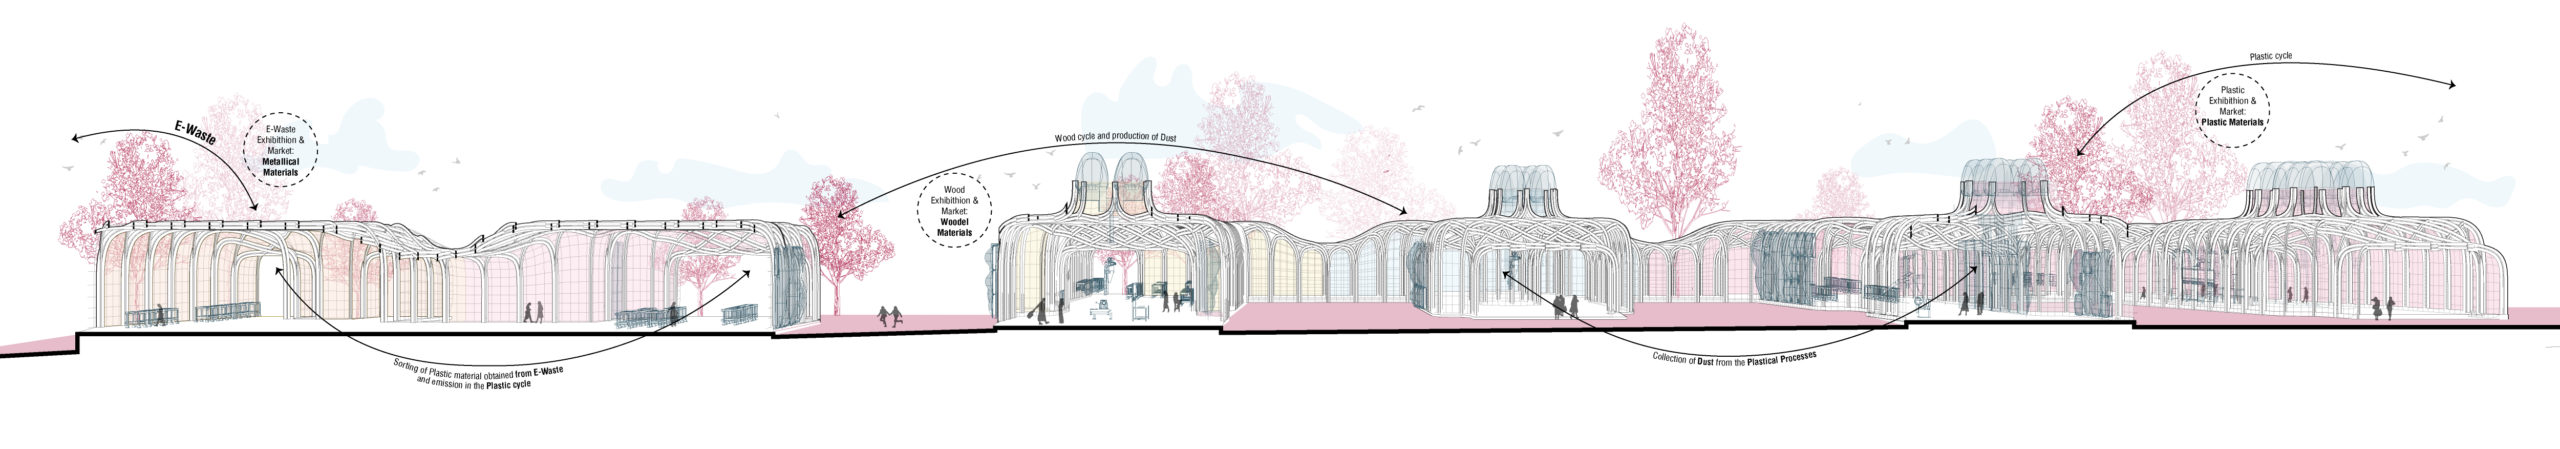
Thanks to the collected data regarding the waste management and production, a new system has been achived: by collecting the wasted objects in the area, and after sorting them in their own recycling cyles, experts and public users will be introduced in the processes.Public users will have the opportunity to adjust their own furniture or create new ones, while experts will be able to work towards professional production. The objects made in laboratories and workshops will finally be exhibited or put on sale in the specially dedicated areas, so as to make known to an even wider audience what is produced in the specific areas.
4_ Strategy
How do the various activities planned and the spaces in which they take place?
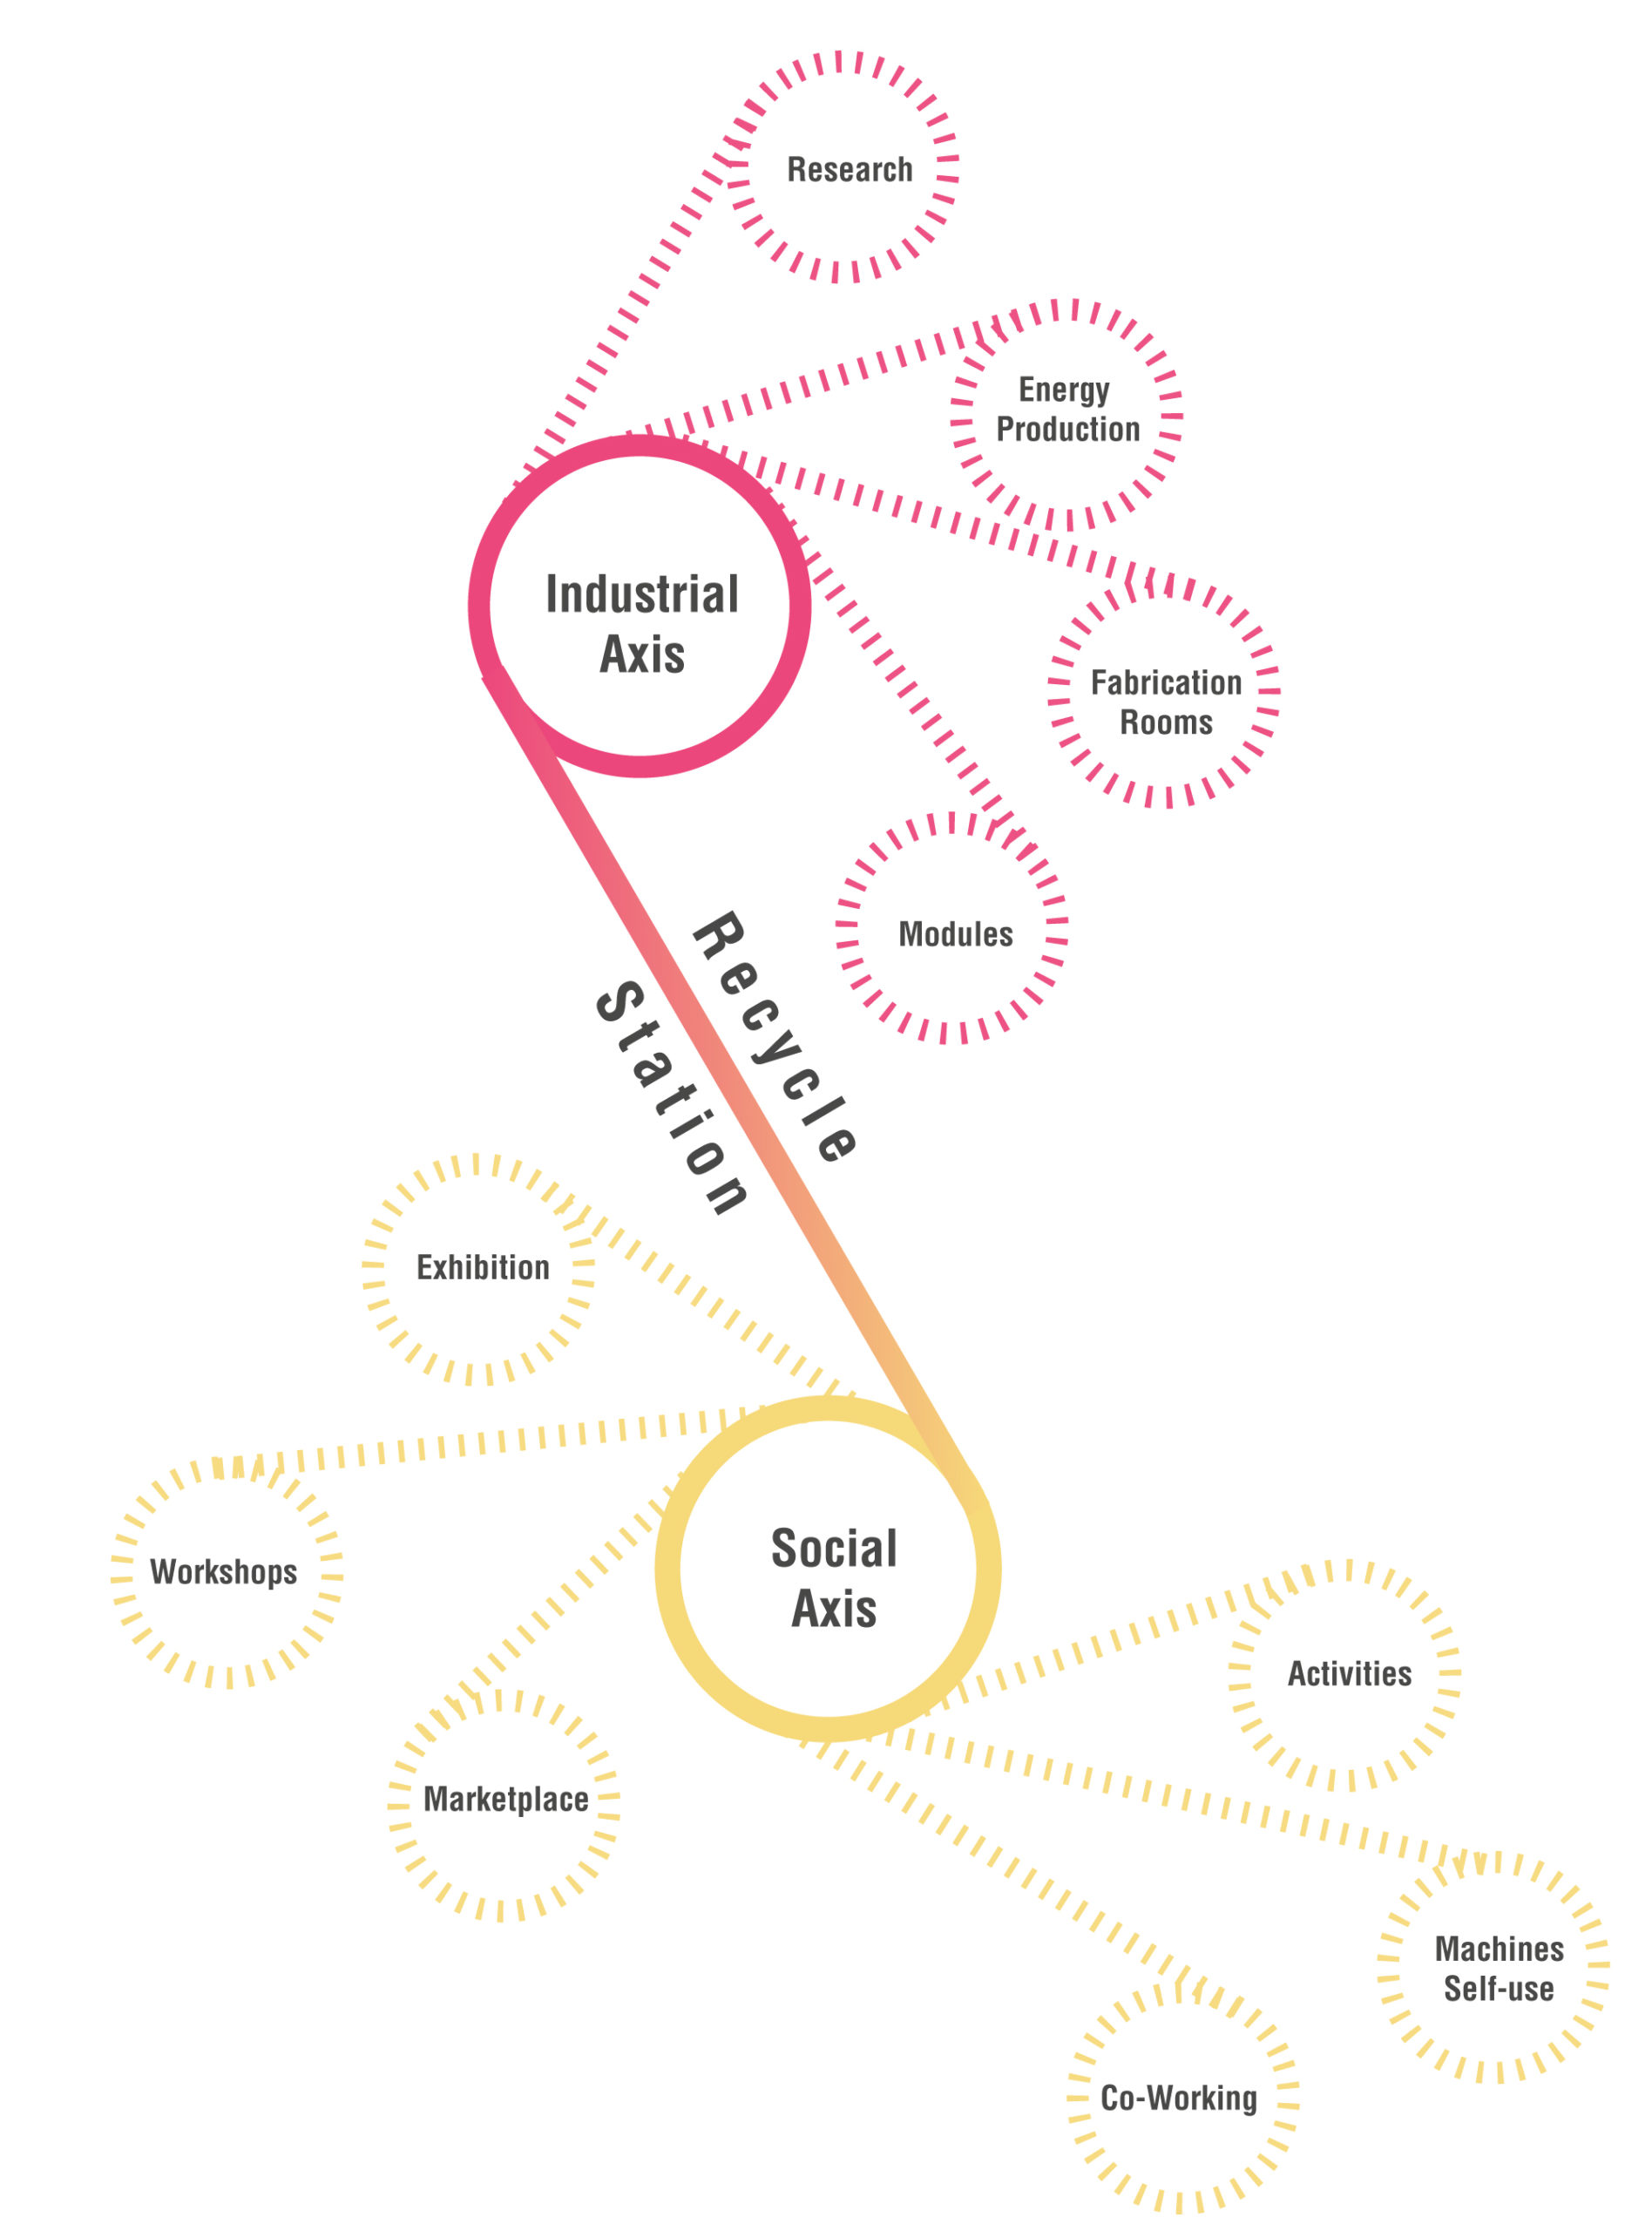
Starting from many problems highlighted in the area, industrial, social and environmental, there are several opportunities that the area and the project could potentially offer: following this logic, the final objectives are realized within defined spaces that communicate with each other.
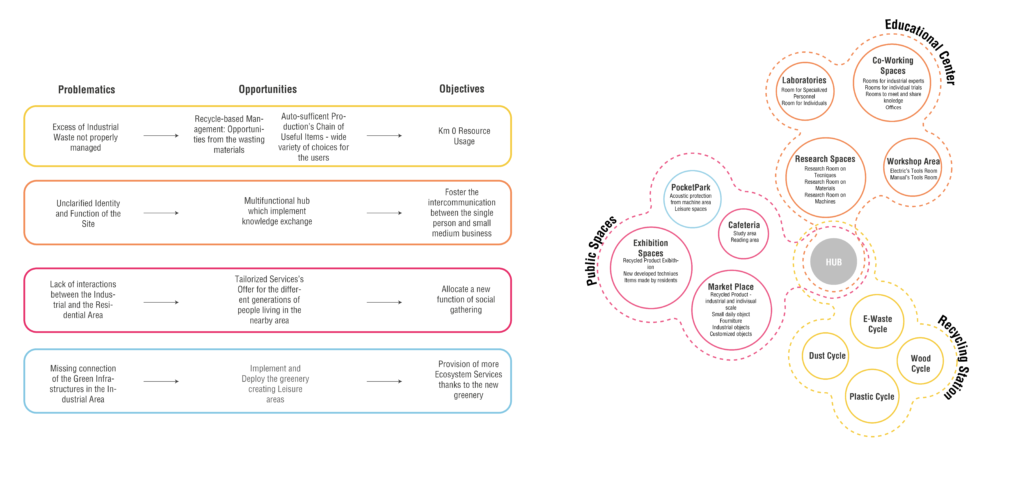
Within each single module we observe a linearity of the actions, which generally start from the collection area of the material, its recycling in the industrial section, reuse in the exchange and educational area, to conclude with its exhibition in the public area.
In the image that follows, this process is exemplified and schematized.
5_ Form Finding
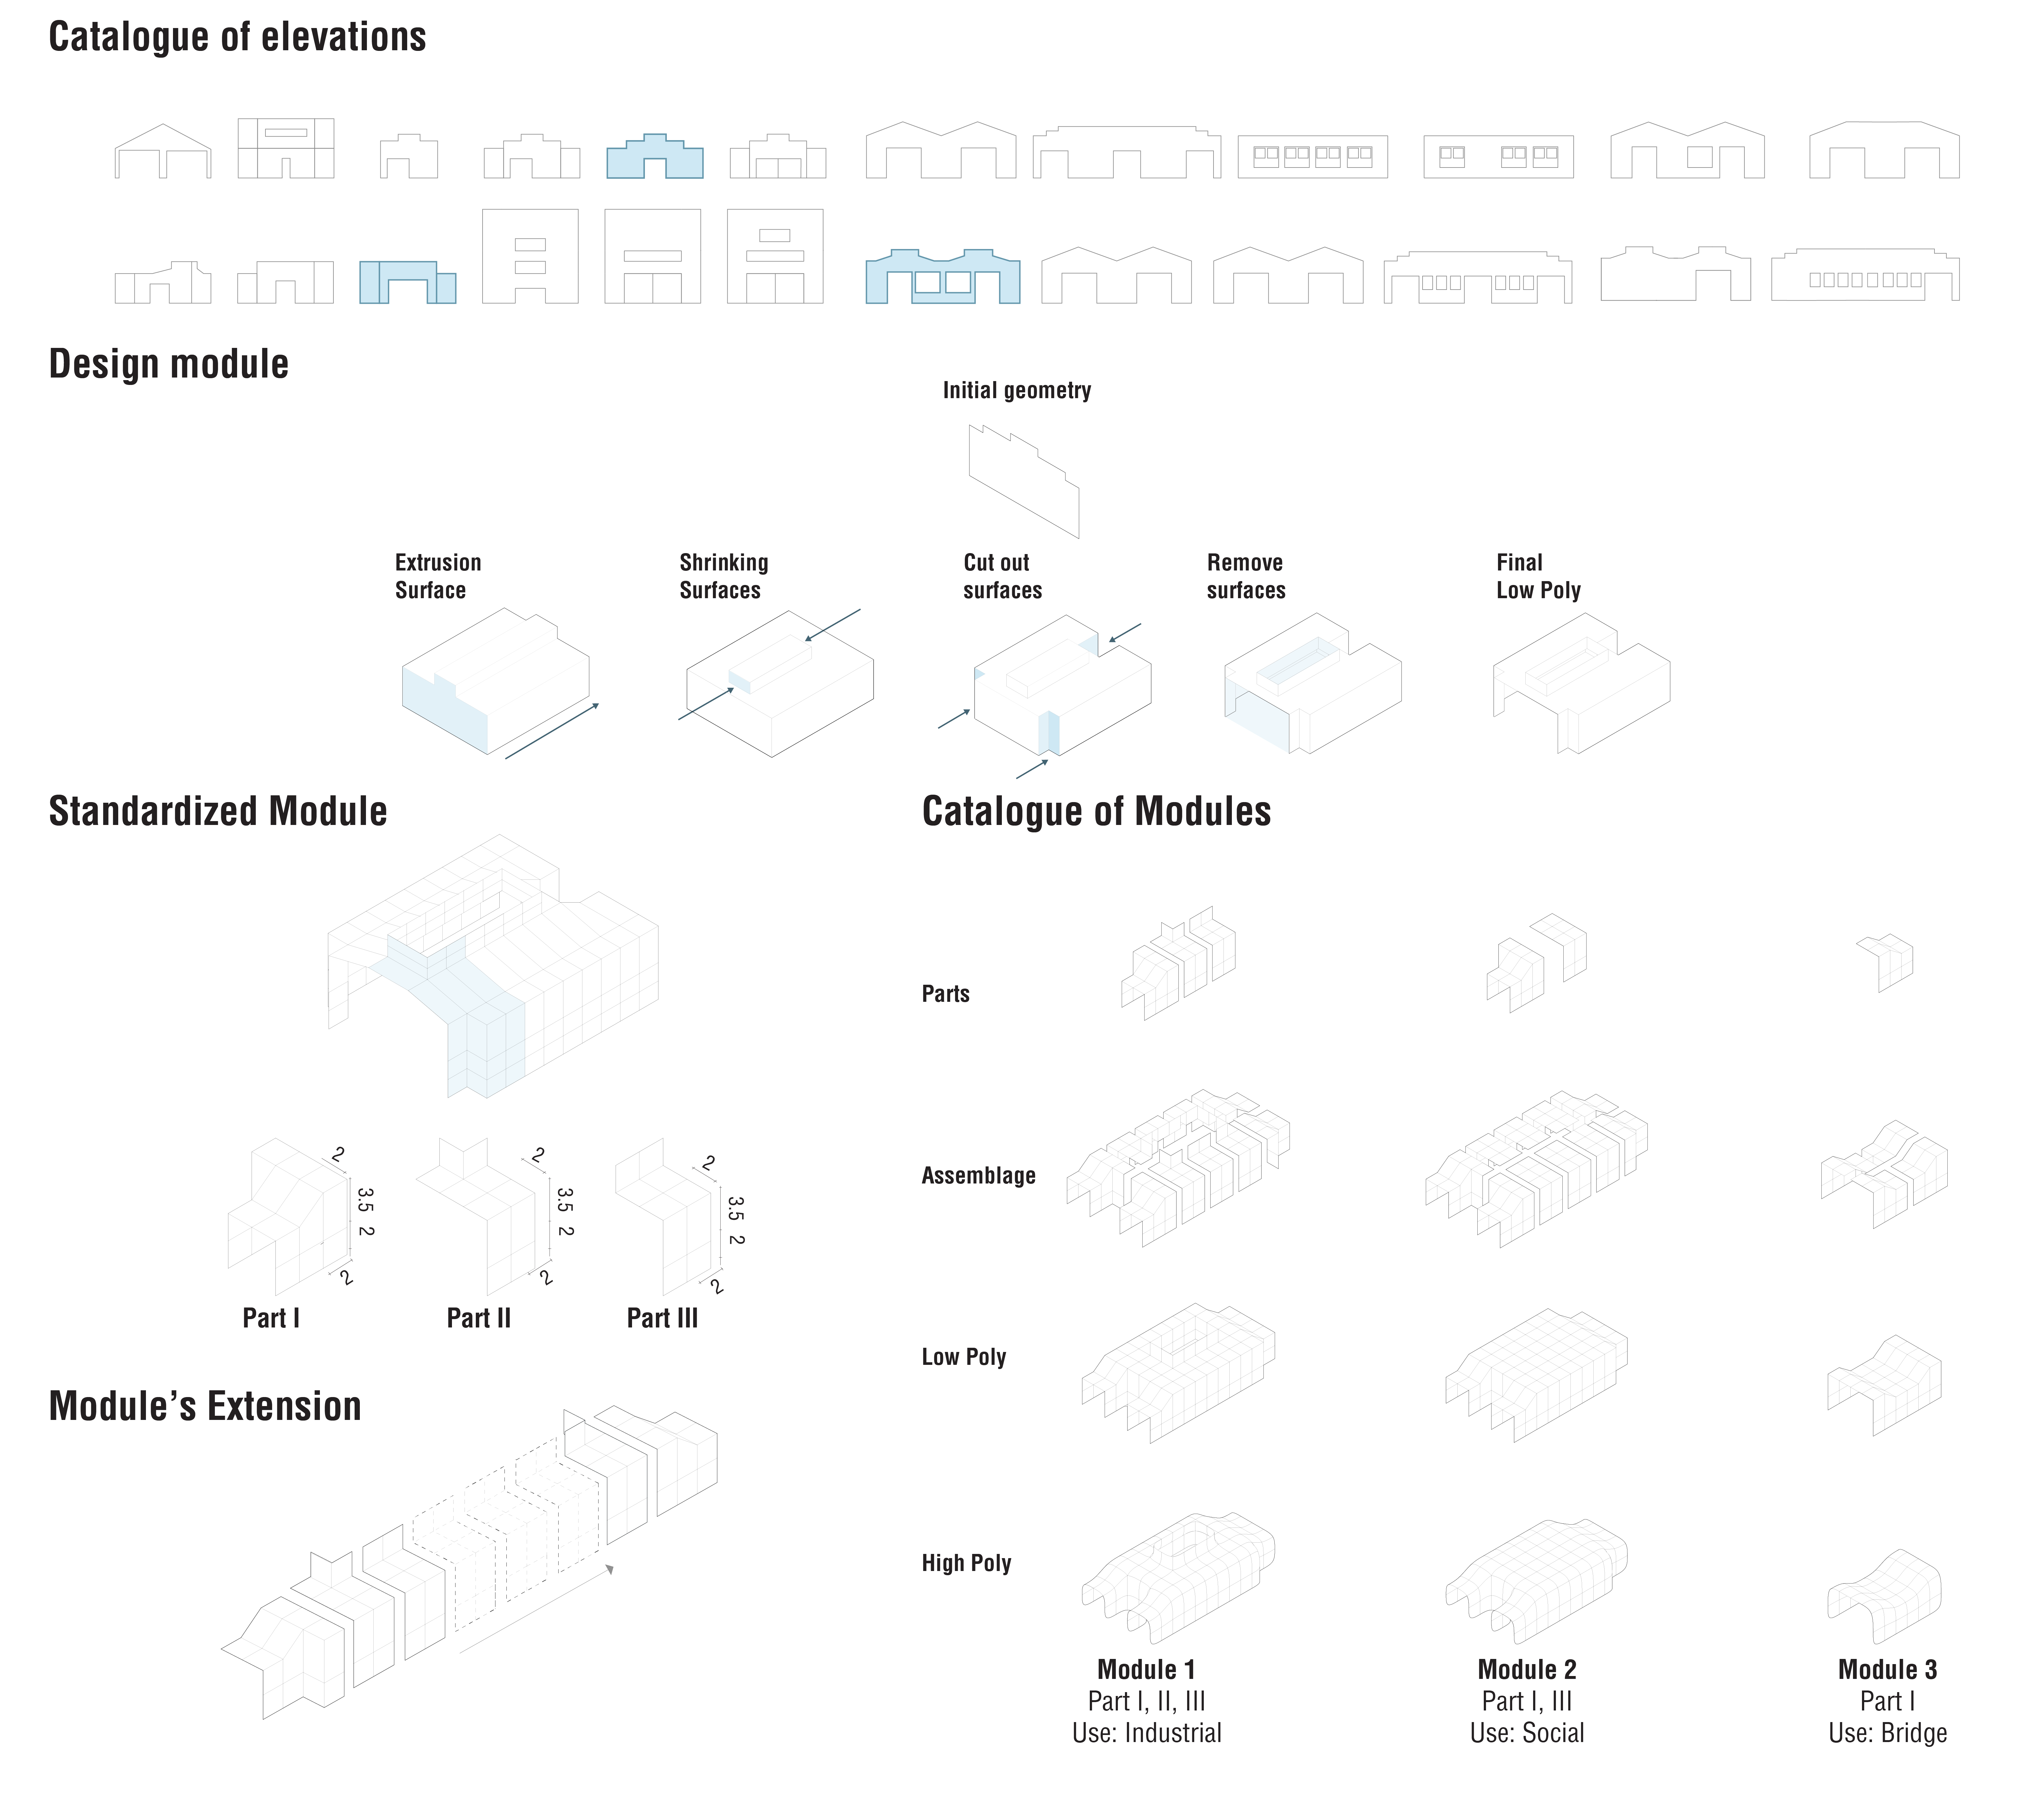
The main Character of the whole area: the facades of the industries represent the main recognizable feature of the area, the starting point for our design.
Starting from the analysis of the facades the Form Finding takes place: many different operations have been done, to achive the final module.
The obtained geometry answers to the standarized criteria that an industrial site needs to consider.
The standardization of three simple parts provided the three basic modules, used in the future aggregation.
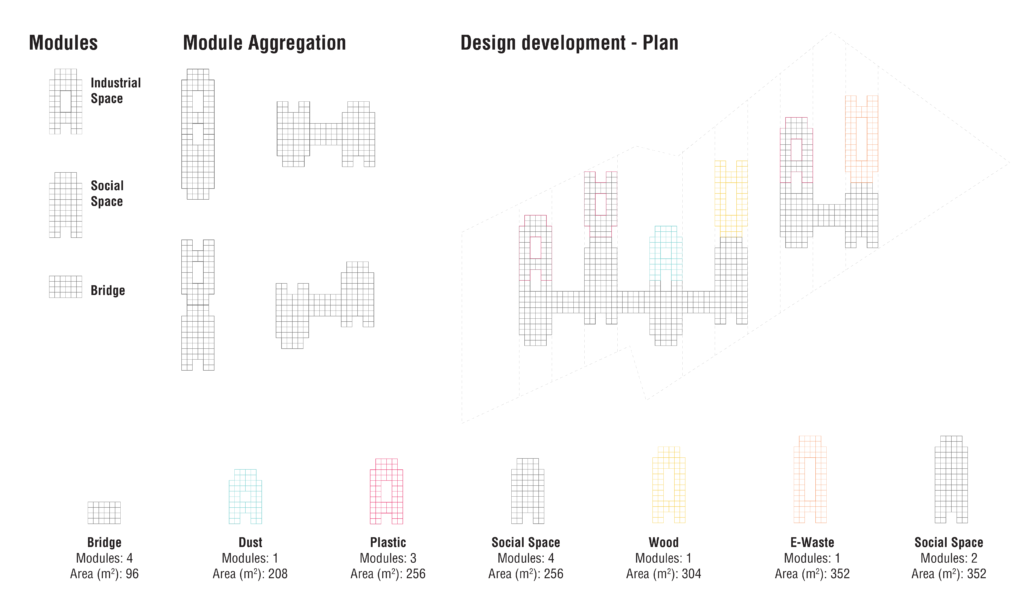
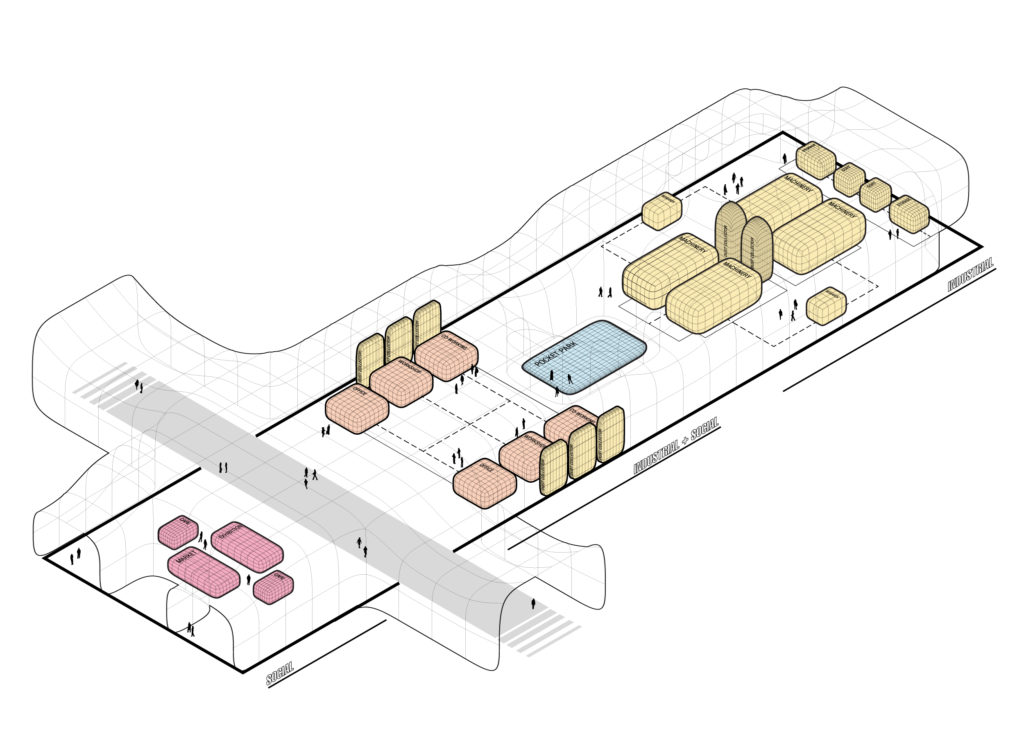
How did the aggregation took place?
The industrial character gave the direction for a general grid which provided a general distribution.
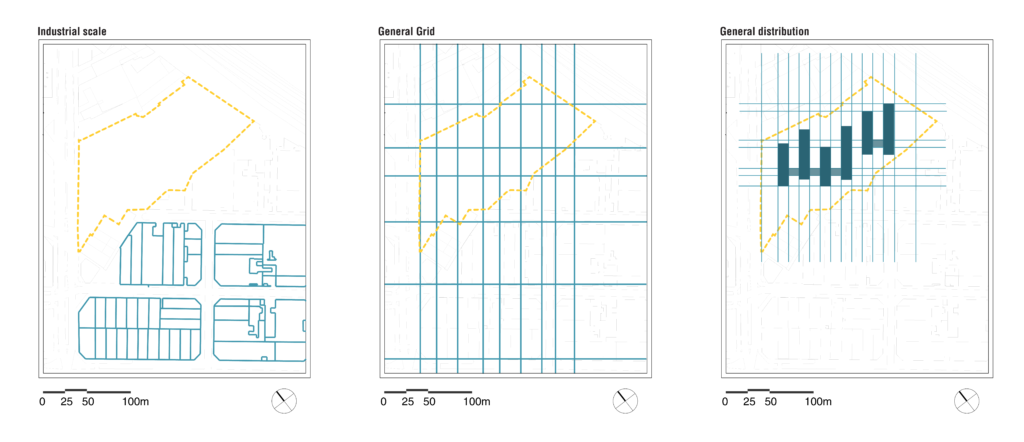
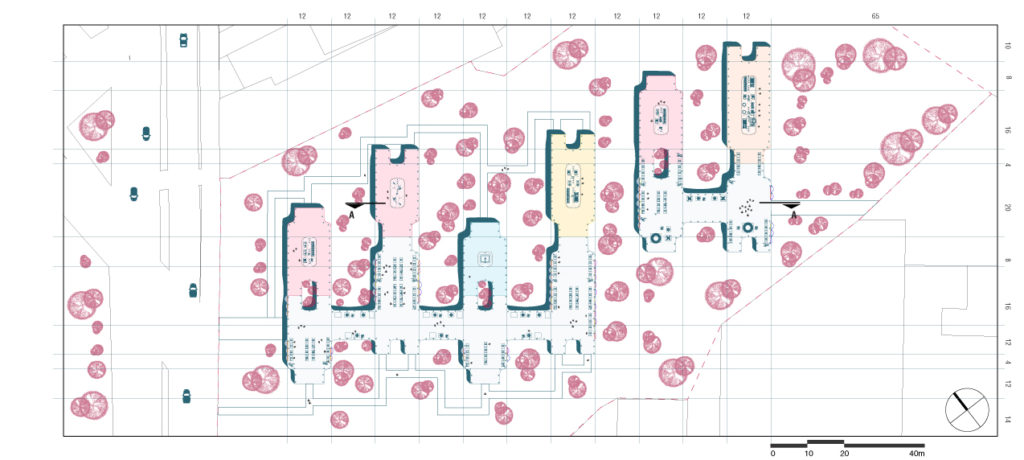
PLAN
Section
6_ Structure
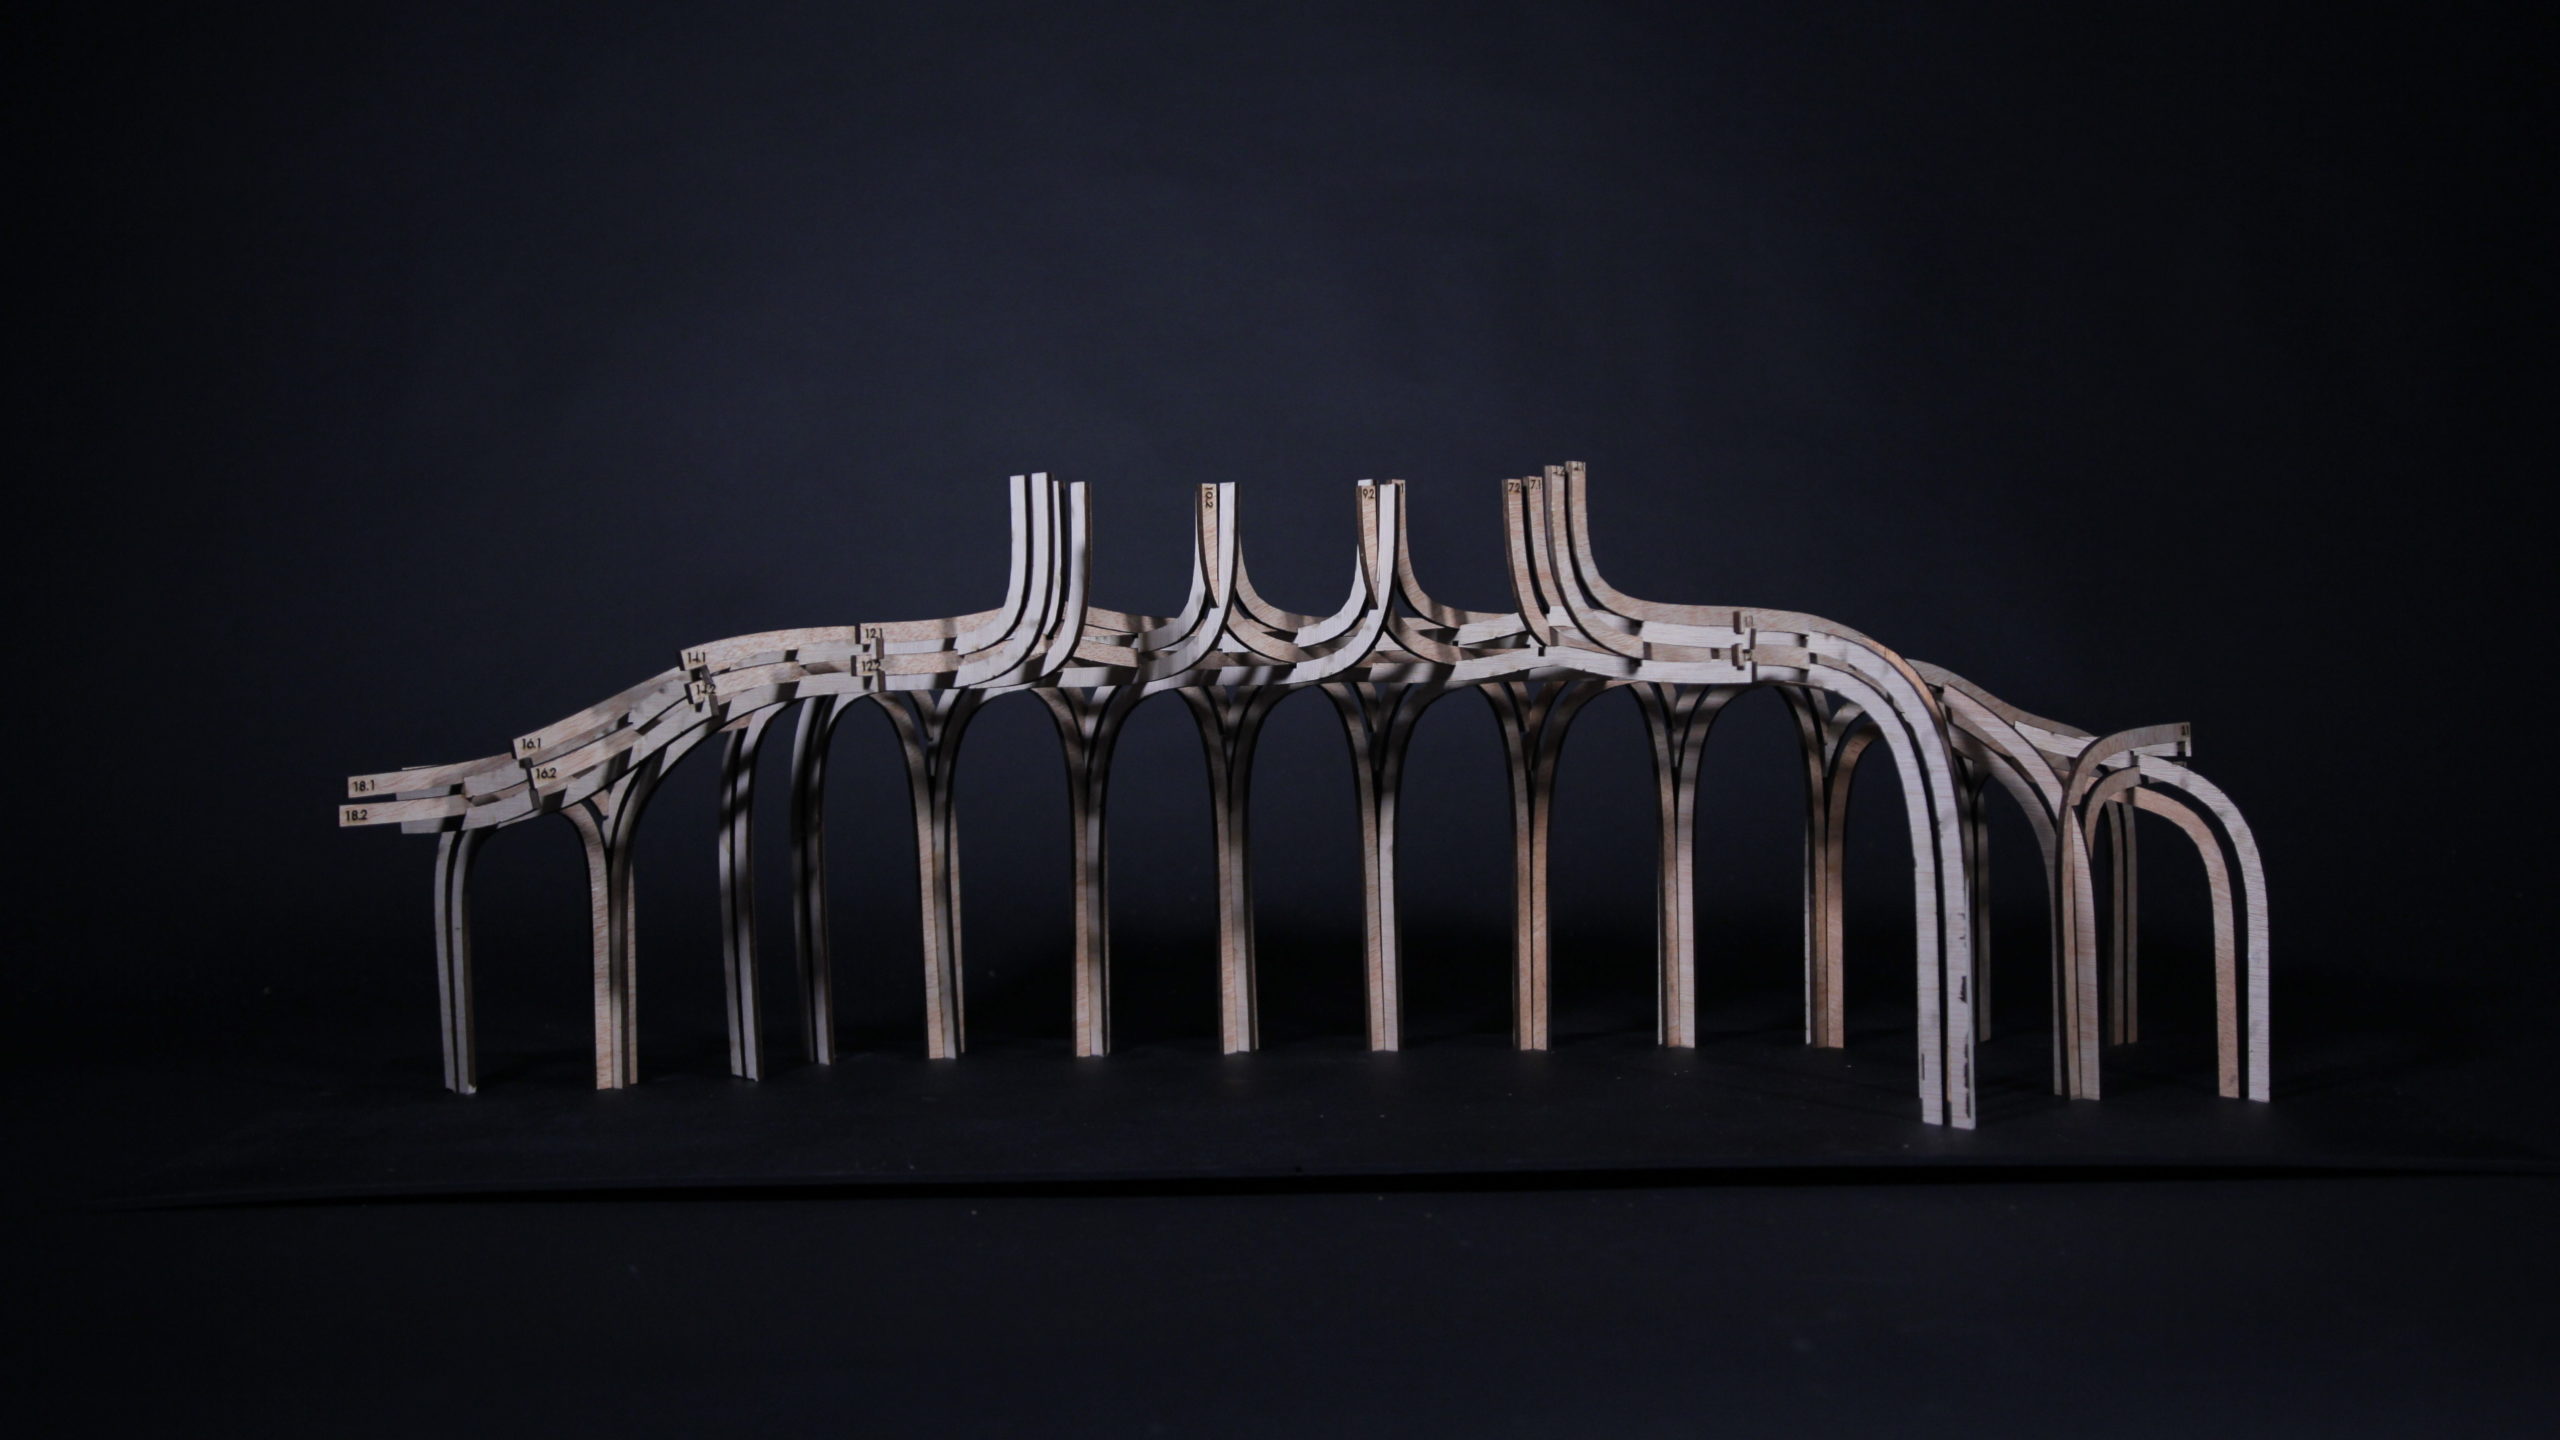
The structure is based on the typology. In order to unitize and standartize the elements for fabrication, in the view of an industrial production, the grid was mapped on subdivided units, which allowed to analyze the surface by the amount of repetitive segments and lastly to reduce singularity of elements.
The obtained beams constitute the smallest number of elements necessary for the production of each module.
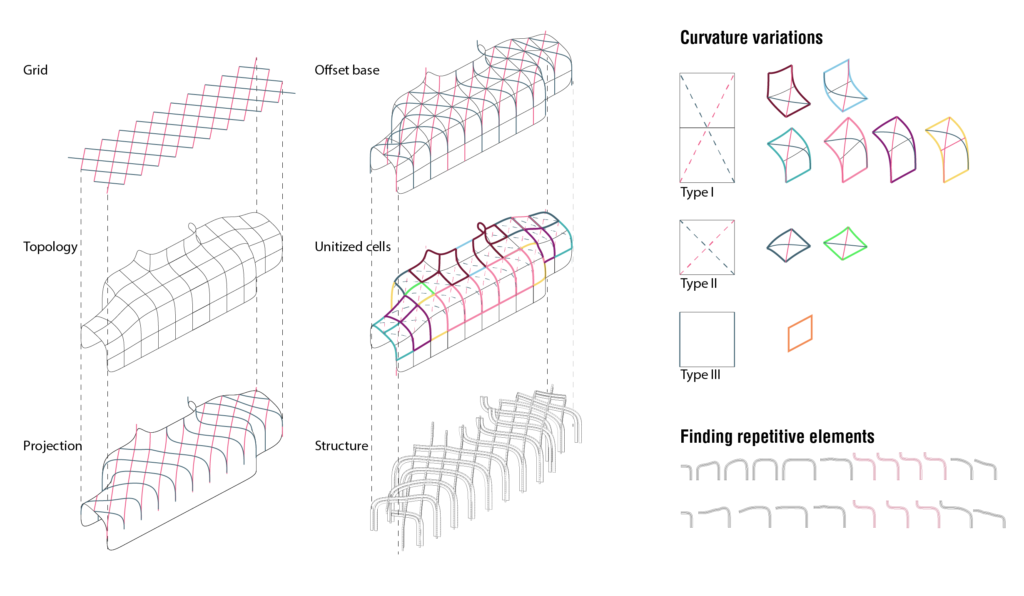
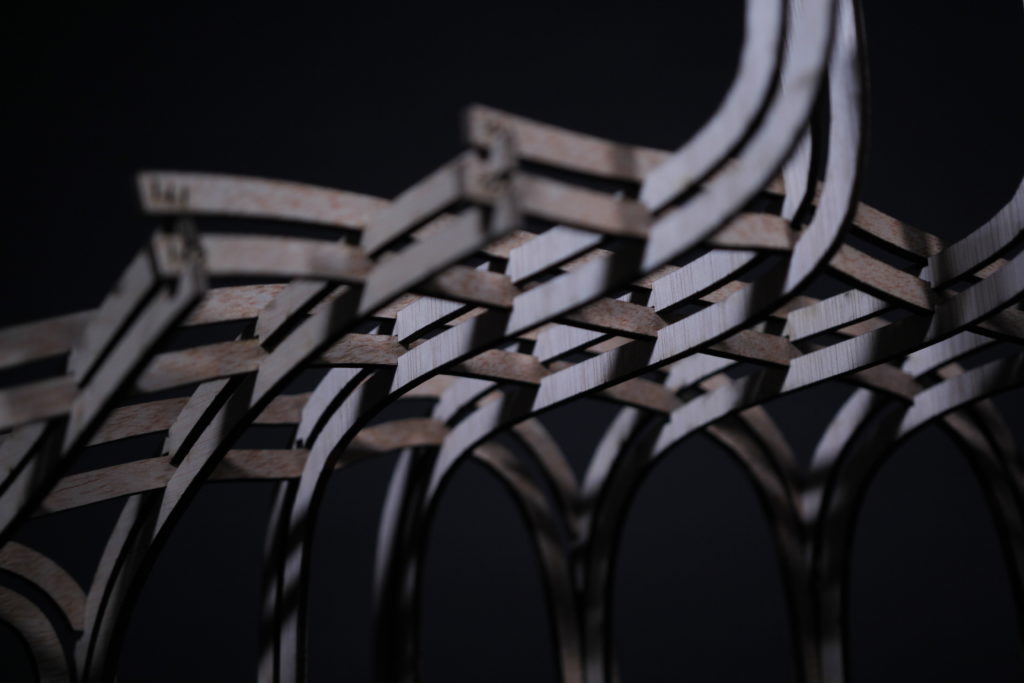
Standardization of structural units
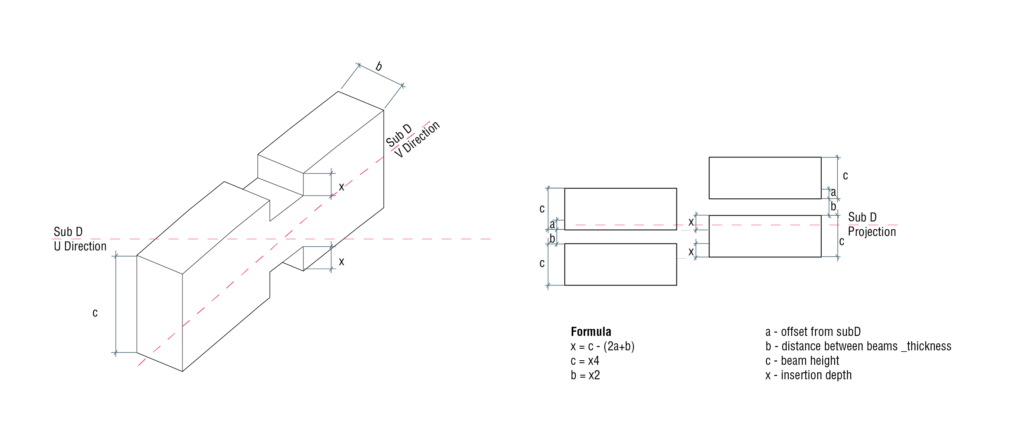
Unit joint and offeset calculation
Structural elements were parametrized with key variable of insertion depth. The remaining indicators were expressed trough equation that allows to calculate dimensions of the beam and at the same time to control the offset from the base grid. Therefore by defying single parameter one can regulate whole structure, insuring to get proper interlocking in joints. Overall, achieved structural system depends on subdivisions of initial forms and can be modified by changing number or size of the cells.
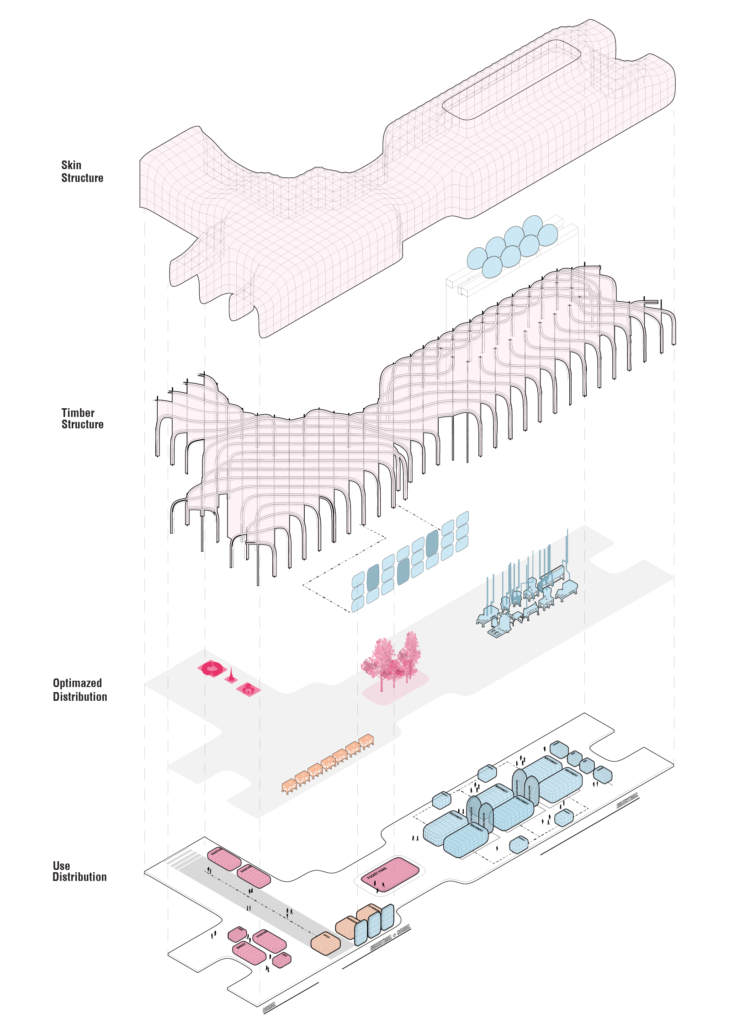
Diagramatic Logic of the Spaces, Distribution and Construction
7_ Dust Collection
Dust Collection System – Facade
The skin of the building serves as air purification and dust collection system. There are two type of panels – air pillows and dust bags. As all elements within the structure, these elements are based on typology, taking one or two cells unit.
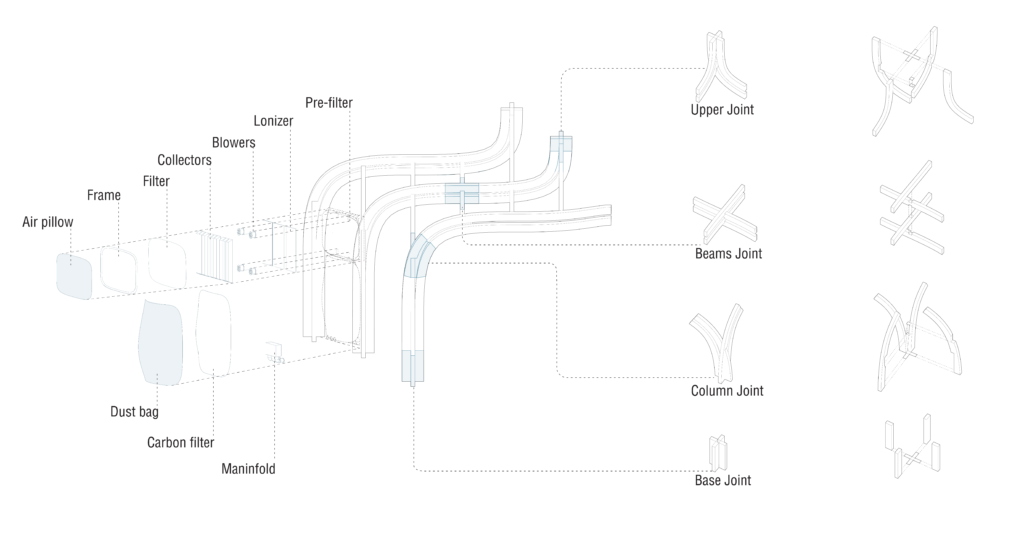
Construction detail and Air purification system wall panels
Air filtering prevents unwanted emissions from going outside the recycling station thus protecting surrounding areas; whereas dust collection system allows portable connection of the machines to enable more more flexibility in organization of inner space.
The air circulation inside panels makes an illusion of a facade breathing.
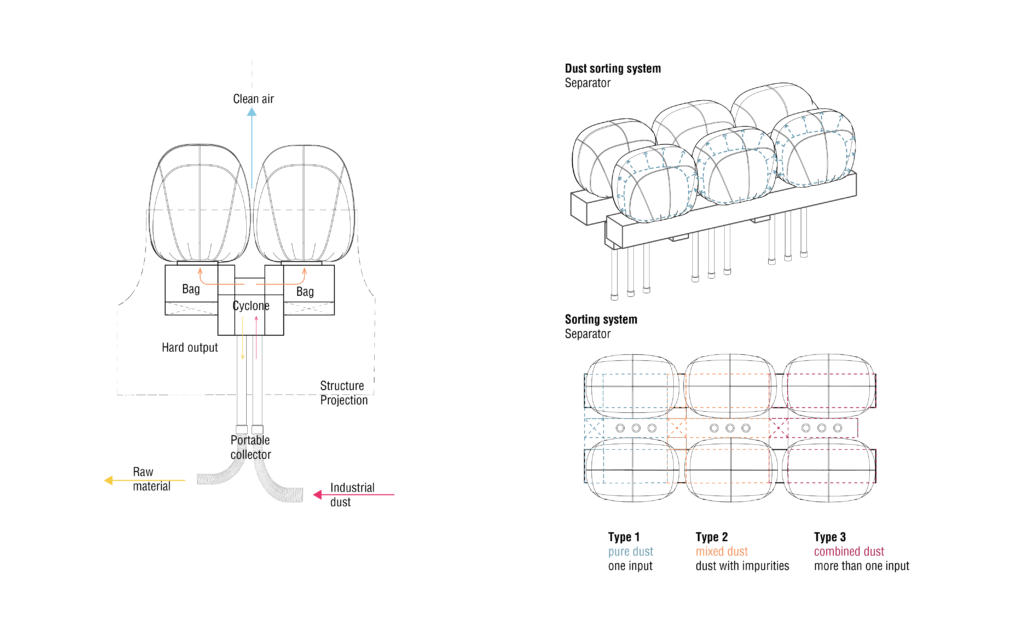
Dust Collection System – Roof
To allow full material cycle the material waste has to be collected, sorted and prepared as a raw material for the following stage. The problem with industrial dust is that it can not be sorted and therefore recycled, since the process of dust collection does not provide the separation of incoming dust streams during the use of machines. Therefore in project was developed dust sorting system. It allows three different inputs for pure dust, mixed dust (dust with impurities such as glue) and combined dust (when more than one material is used in the same machine). After passing sorting system pure dust gets through the process of shredding and milling that ends up with two optional stages: receiving hard dust or soft dust. The system is placed inside special opening and can be connected to the machines via flexible tubes. At the same time system works as an art installation. Air circulation inside of the panels makes bags wave which gives an impression of a working factory. It translated a message of importance of waste management – bags contain production waste and protect residents.
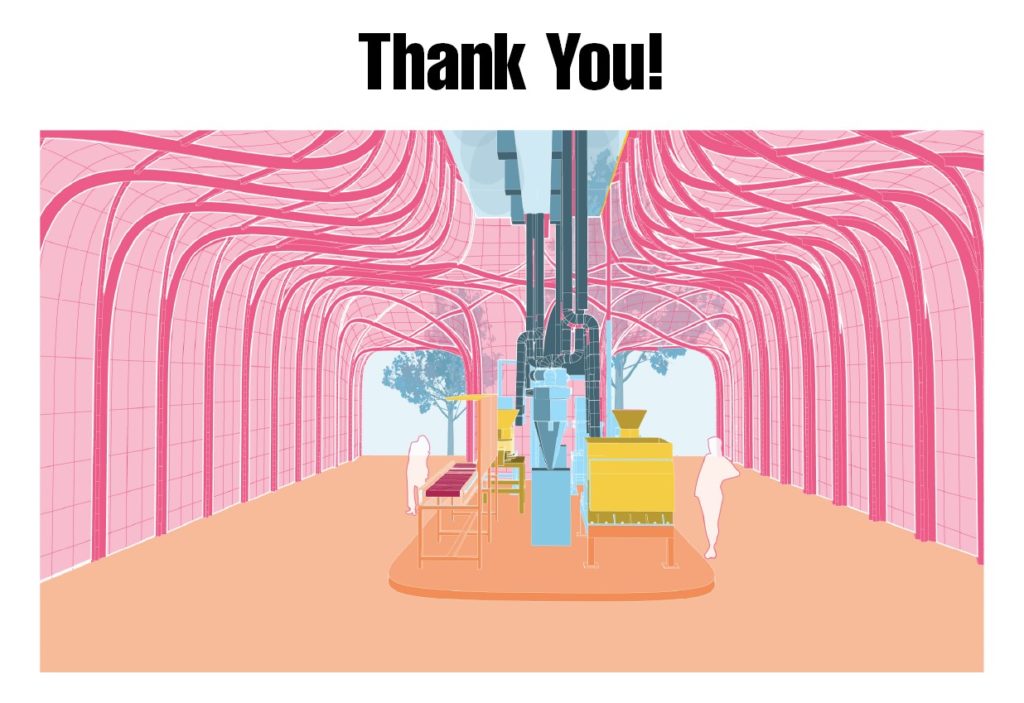
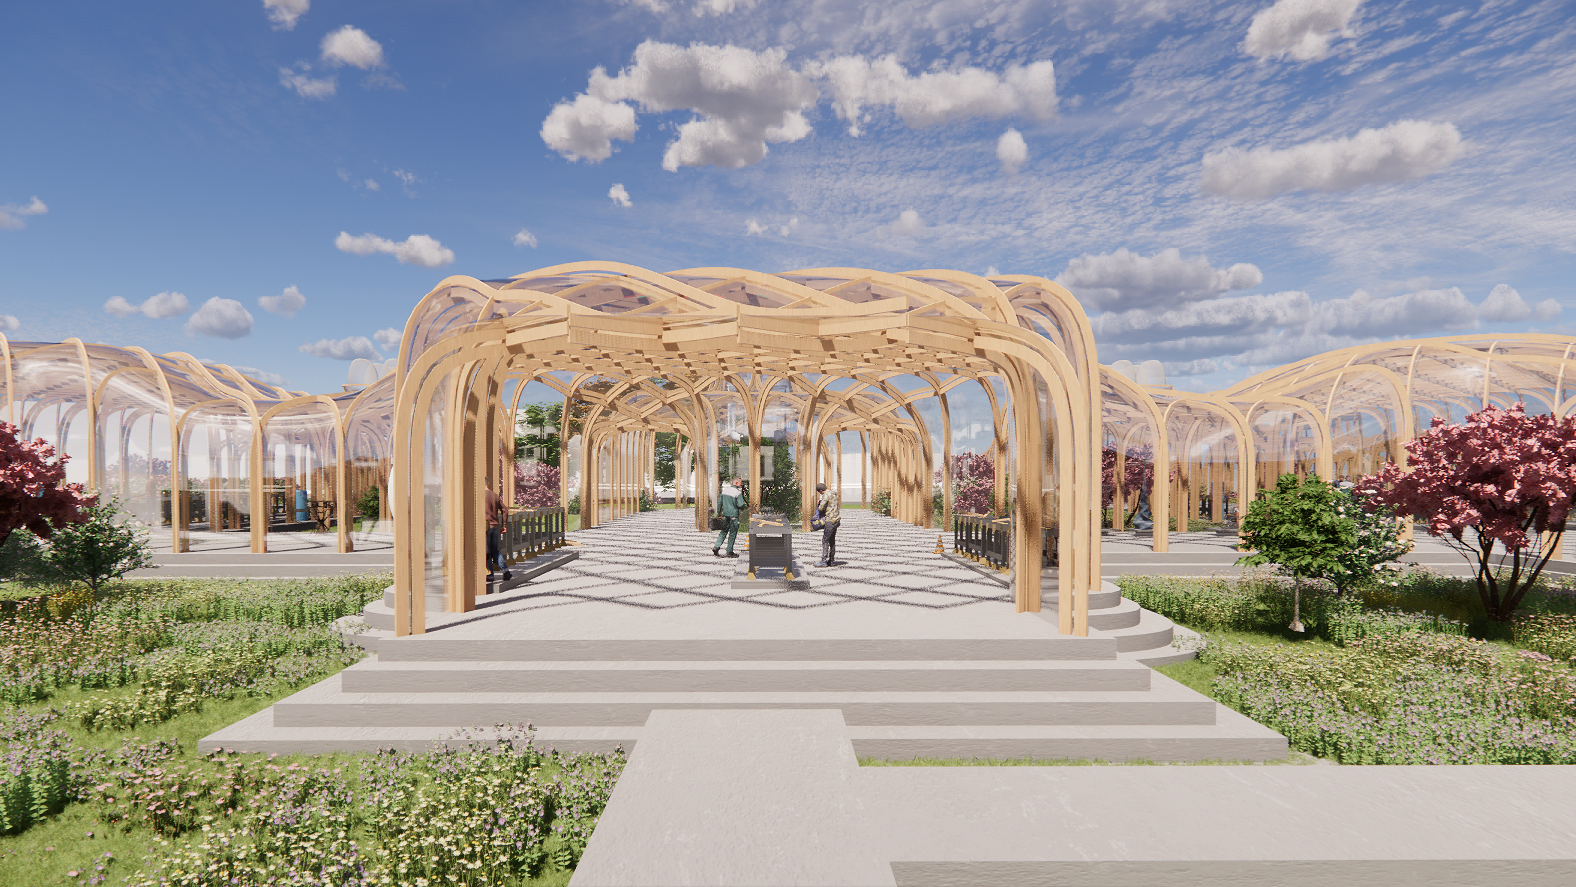
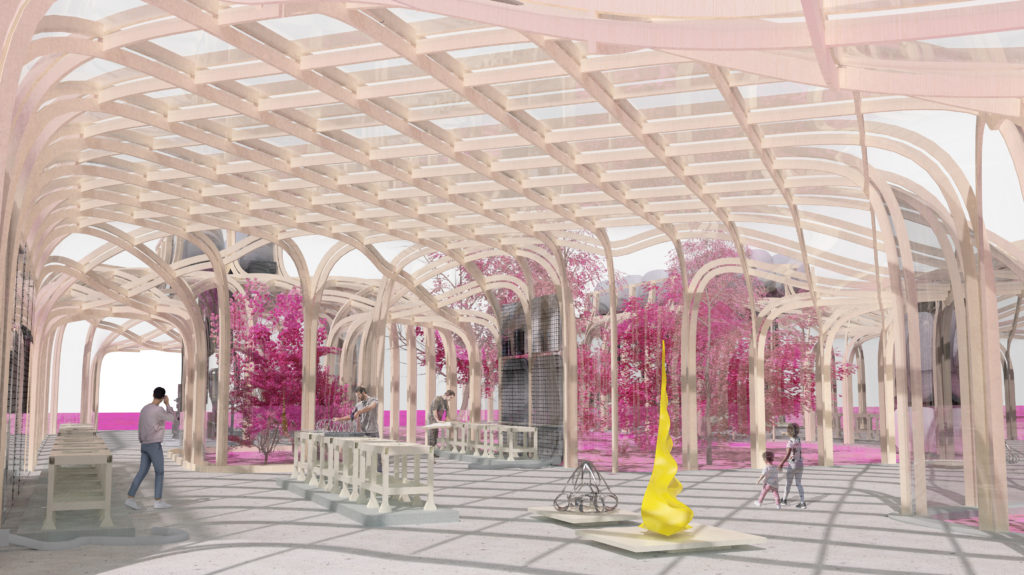
8_ Renders
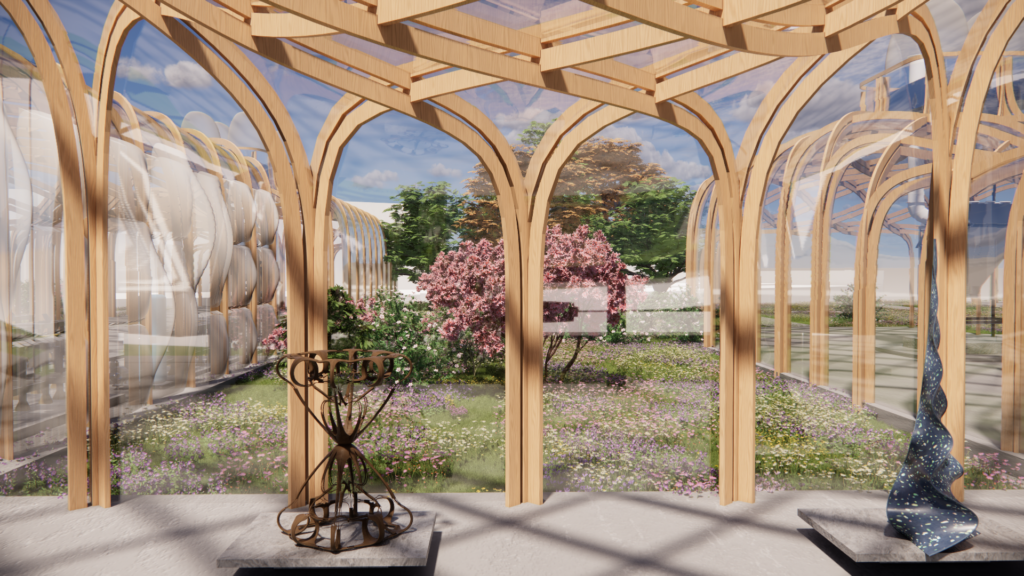
Newly greenery and the Dust Collection Panels
The Dust Collection System Panels marks the area reserved to the Social Exchanges
Laboratory and workshop area
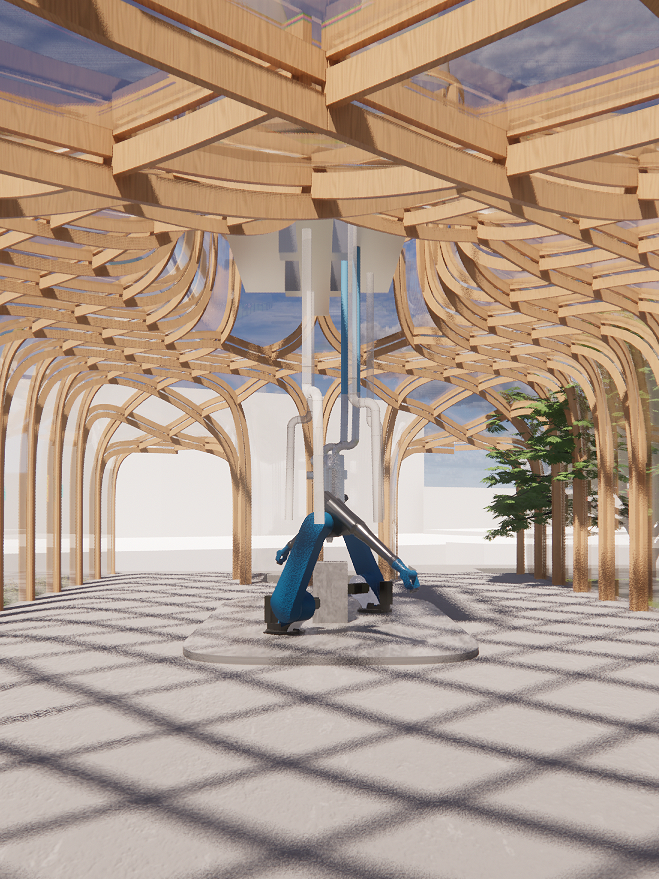
Plastic Recycle Area: Kuka Robot
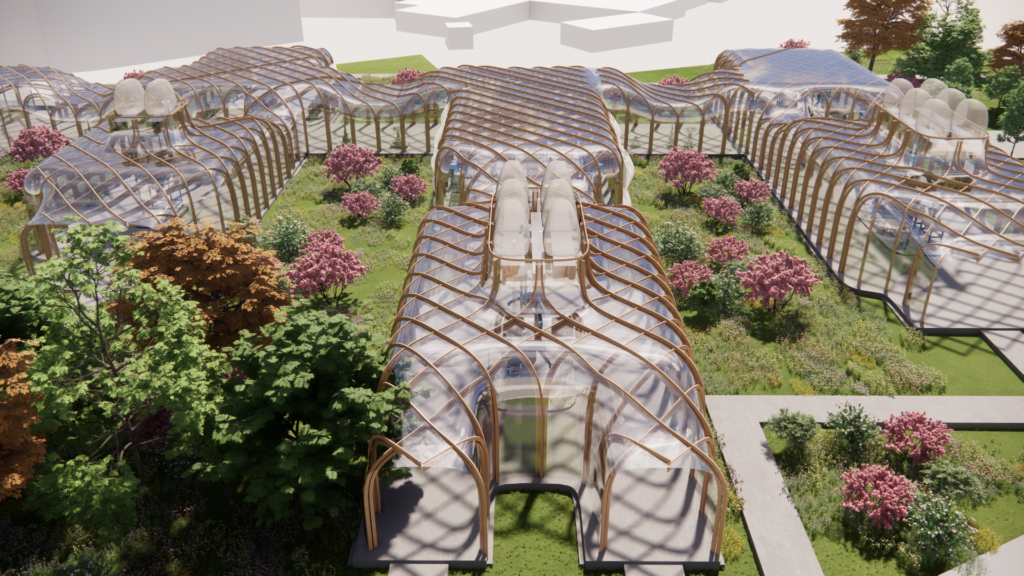
The Dust Collection System Bags marks the area reserved to the Industrial Processes
Within this final render it is highlighted the relationship between the spaces
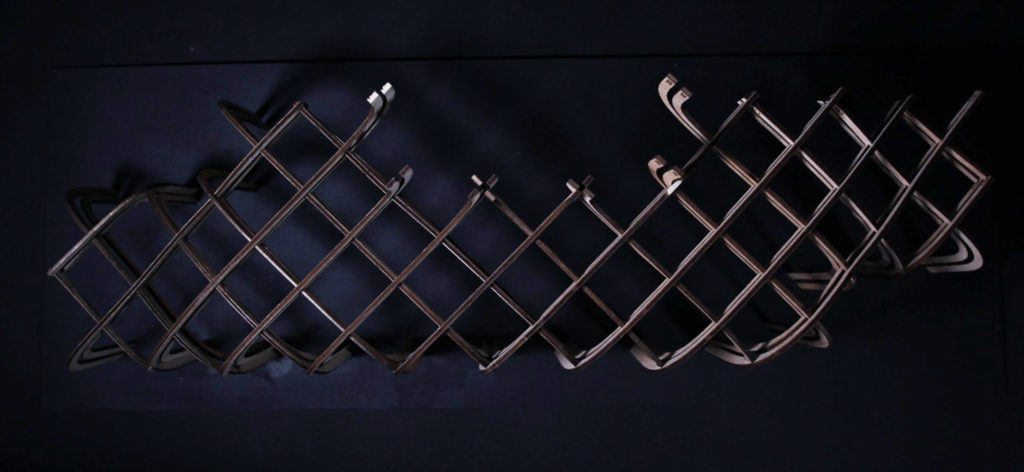
9_ Physical Model
10_ Video
11_ AR Model Experience
By scanning the following QR code, everyone will have the possibility to navigate and explore the physicity of two modules which compose the project.
The model is a semplified version of the main one, that has been created to allow the public with the possibility of understanding, tap by tap, the spatiality and how does the structure works.

12_Instagram
To follow step by step the process that lead to the ultimation of this project, and to be in touch with the Authors, scan and visit our Instagram page: zero.edge.bcn