The source dataset provided for this project is derived from the 2016 NYC Yellow Cab trip records, which were made publicly available on the Big Query platform of the Google Cloud. The data was originally collected and published by the New York City Taxi and Limousine Commission (TLC). This dataset serves as the foundation for predicting the duration of each trip in the test set, based on various trip attributes such as pickup and drop-off locations, trip distance, and time of day. By analyzing these factors and training a predictive model on the data, accurate estimations can be made for the length of each taxi ride.
Understanding the data
Scatterplot colormap based on the pick-up and drop-off time
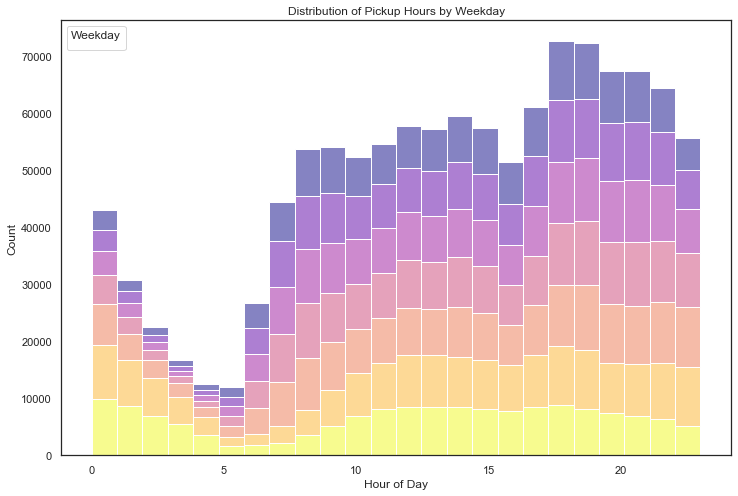
Scatterplot colormap based on the pick-up and drop-off weekday
Understanding the outliers
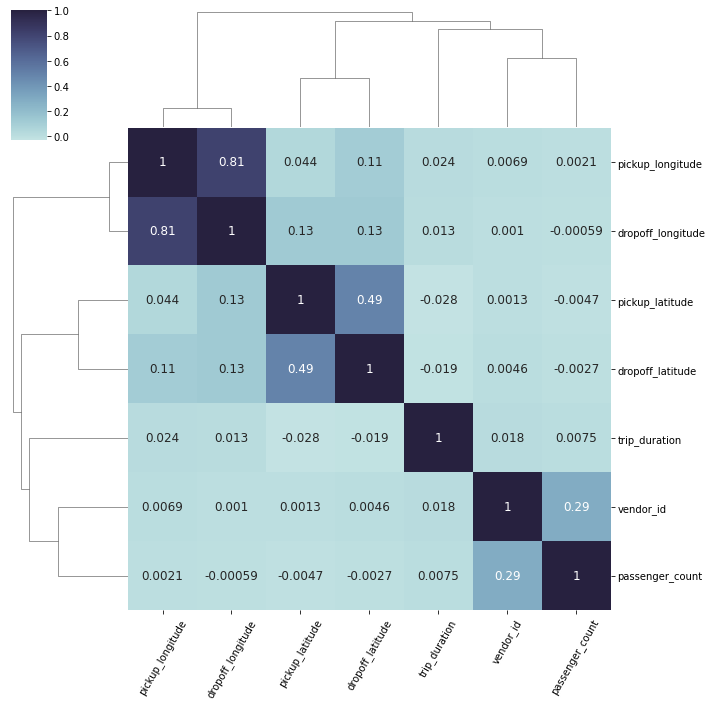
It is noticed the above matrix of box plots that there are significant number of outliers in the data of the columns of passenger count, pickup longitude and latitude, drop off longitude and latitude, trip duration and trip distance. To clean the outliers, the columns trip duration and trip distance was chosen to further analyse the data which is represented below.
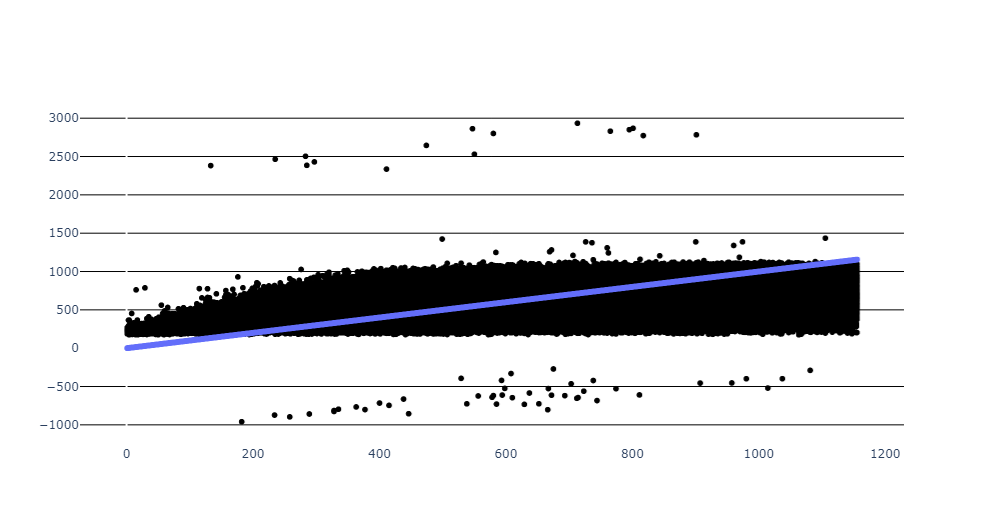
Scatter plot of the data of trip distance vs trip duration showing the before and after removing outliers in the quantile of 0.95 and 0.9 respectively
Running the linear regression model to the above cleaned data to predict the trip duration