The work presented in this blog post explores how code and visual tools can be used to create and represent the data central to this research group’s main project in the Research Studio. It focuses on integrating data-driven design methods to support sustainable façade development while aligning with environmental guidelines. By emphasizing the creation and visualization of structured datasets, the research addresses the challenges of ecological design during the early stages of architectural development, where the potential for carbon reduction is greatest.
We have structured the work in three different steps:
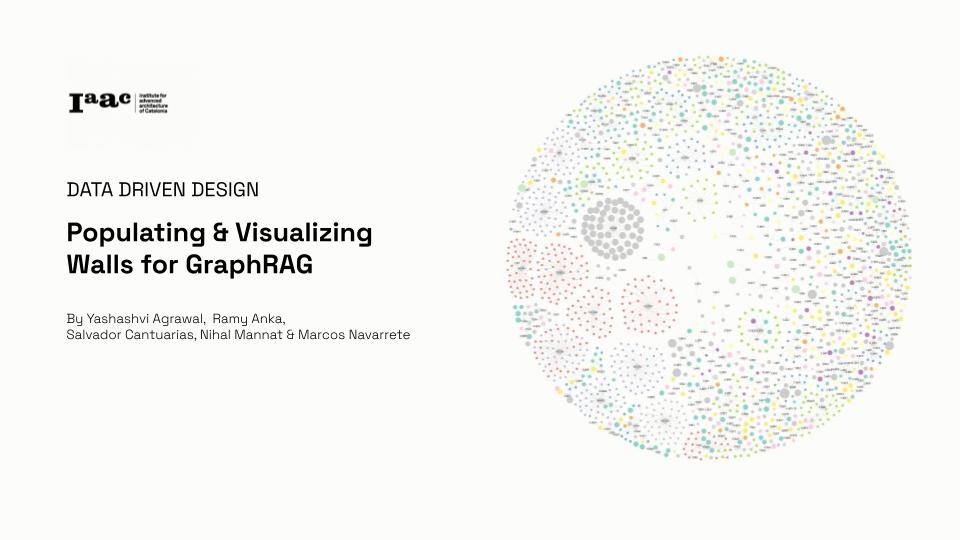
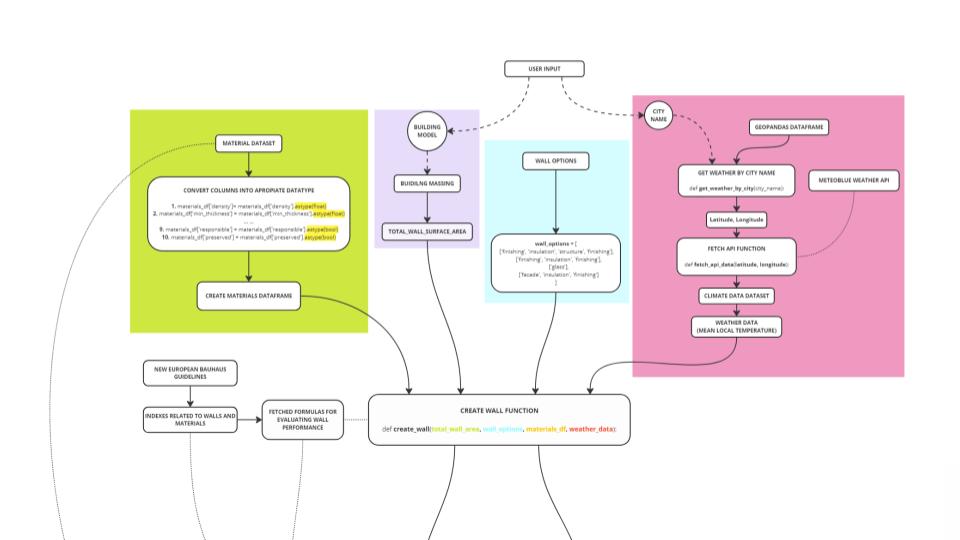
1) Back-End Development: Creation and refinement of datasets and algorithms to populate relevant facade data, incorporating metrics like embodied carbon, cost, and thermal resistance.
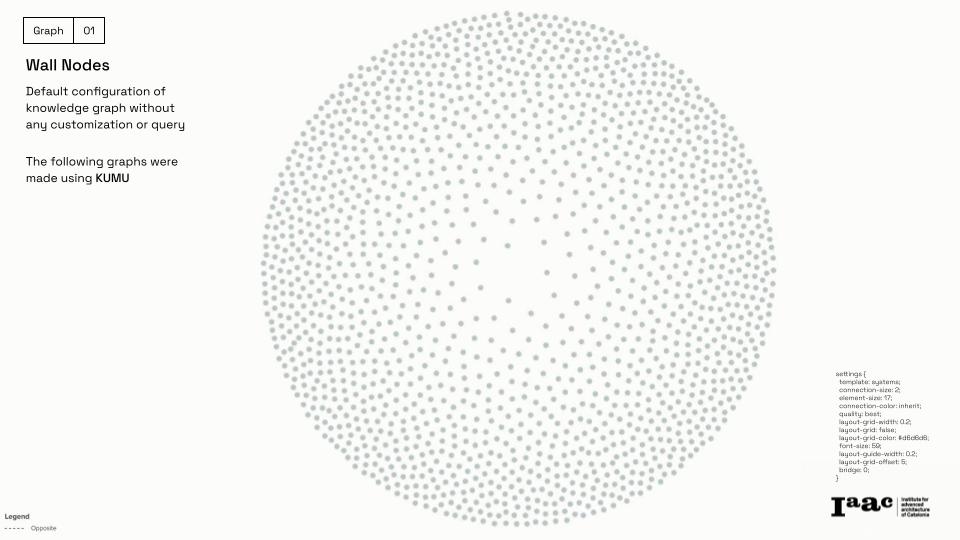
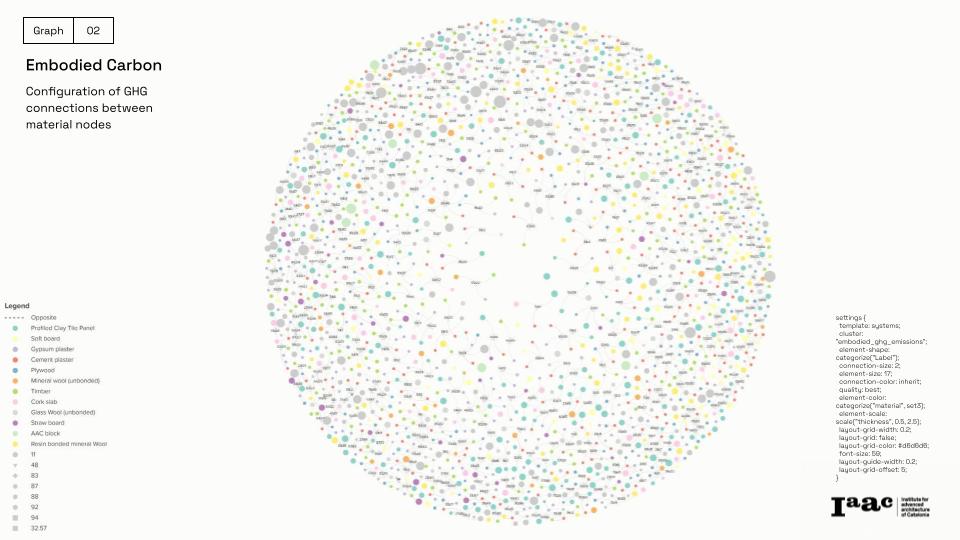
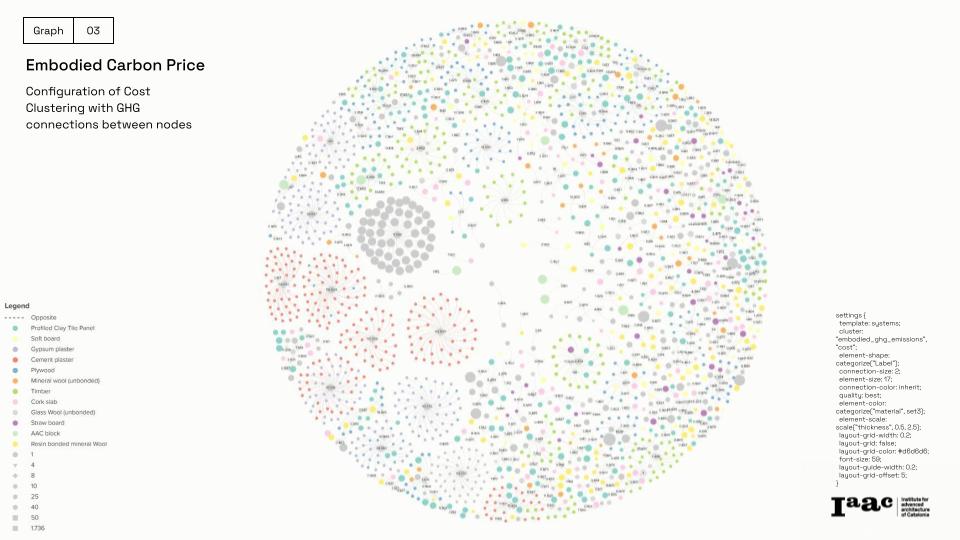
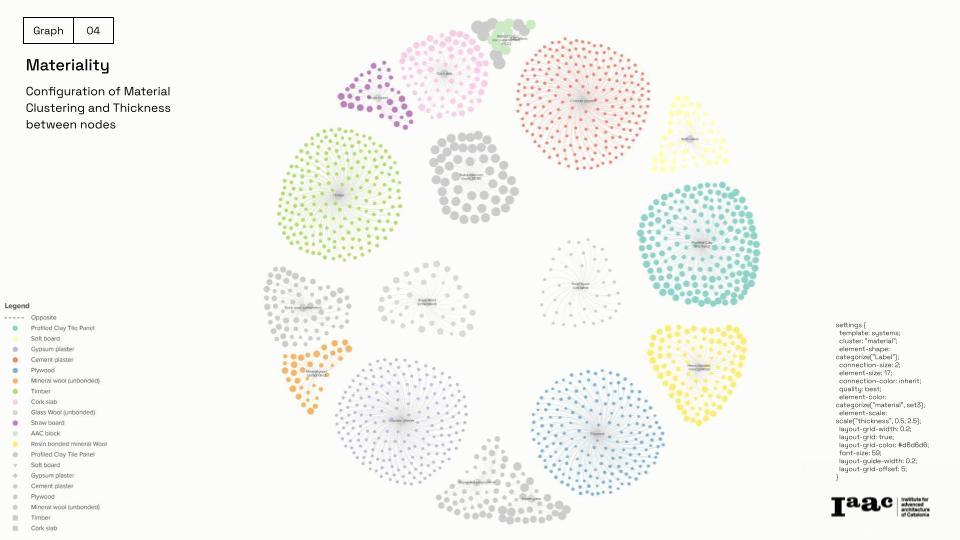
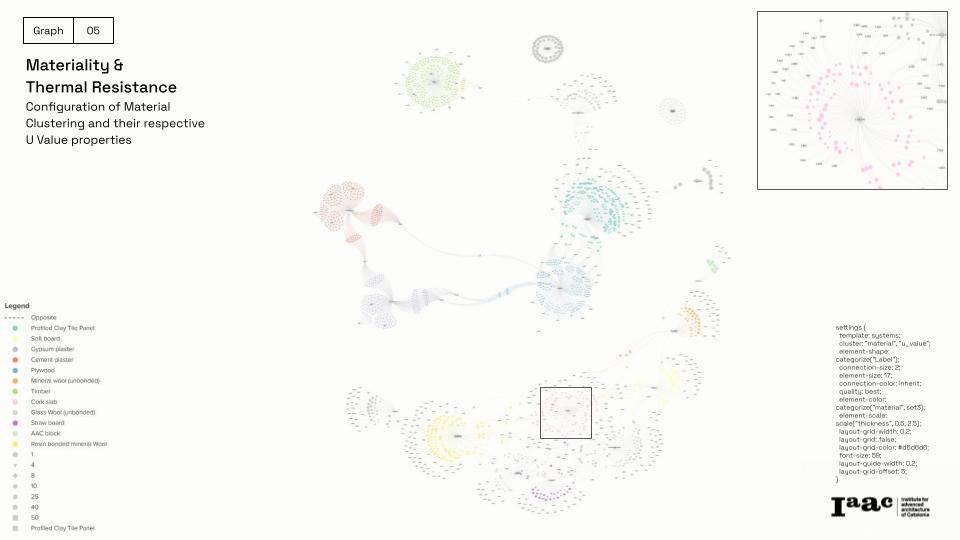
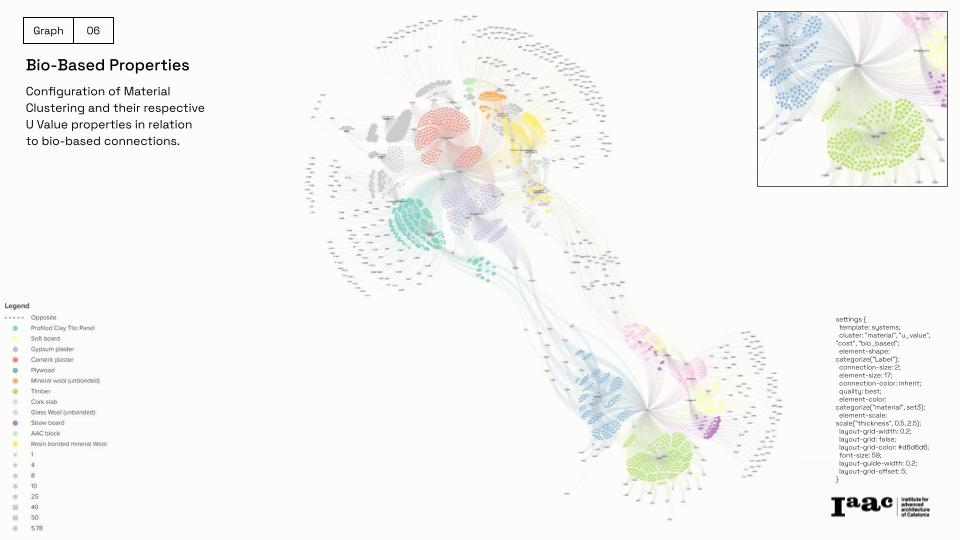
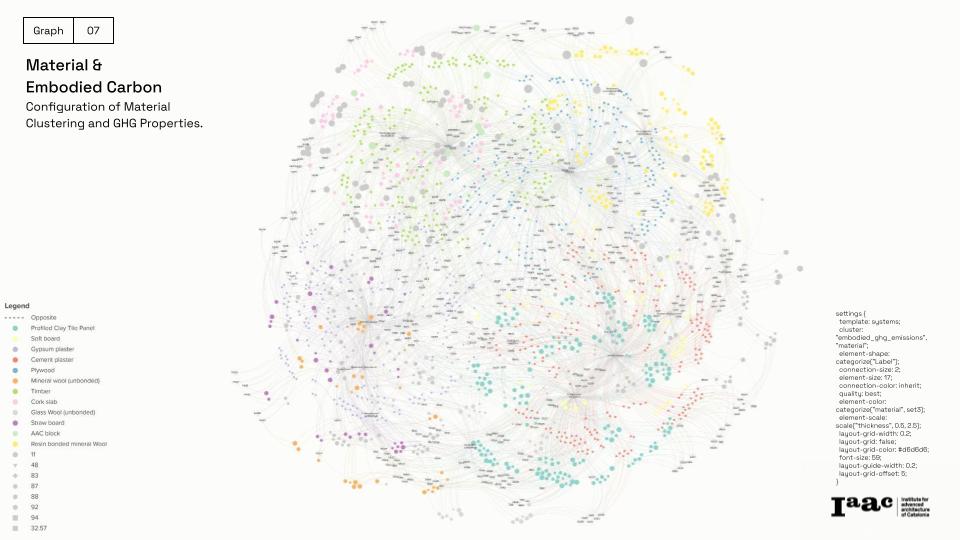
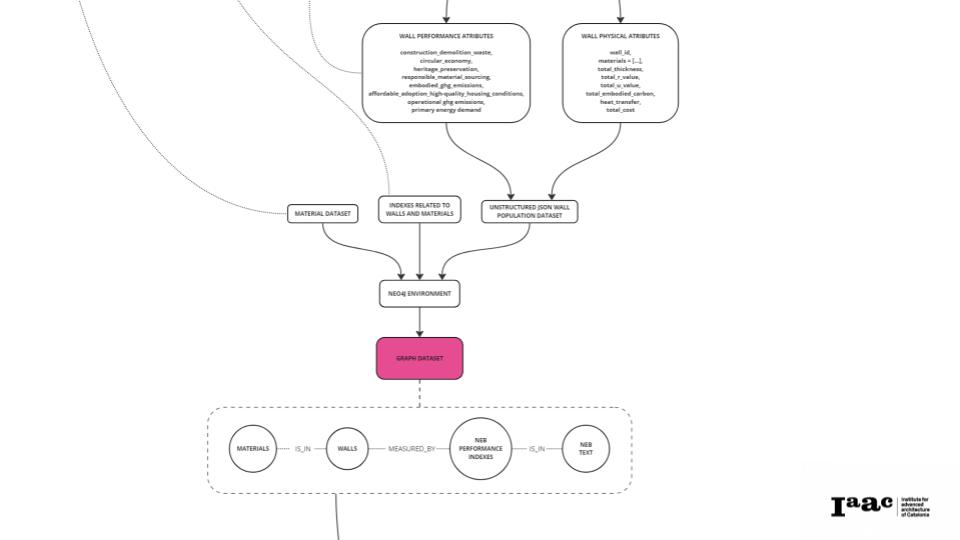
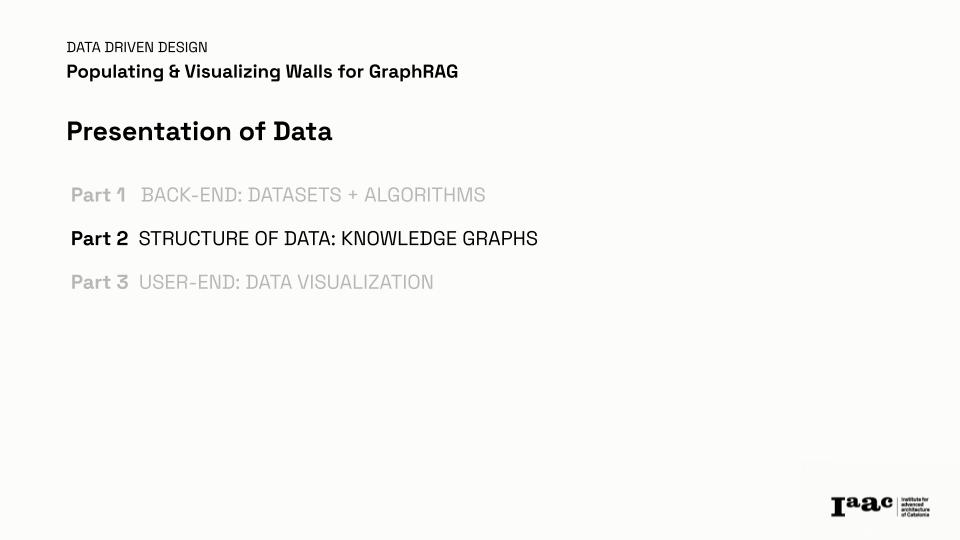
2) Knowledge Graphs: Structuring data into interconnected nodes and clusters using advanced visualization tools, enabling deep analysis by specific advanced users or developers of design platforms.
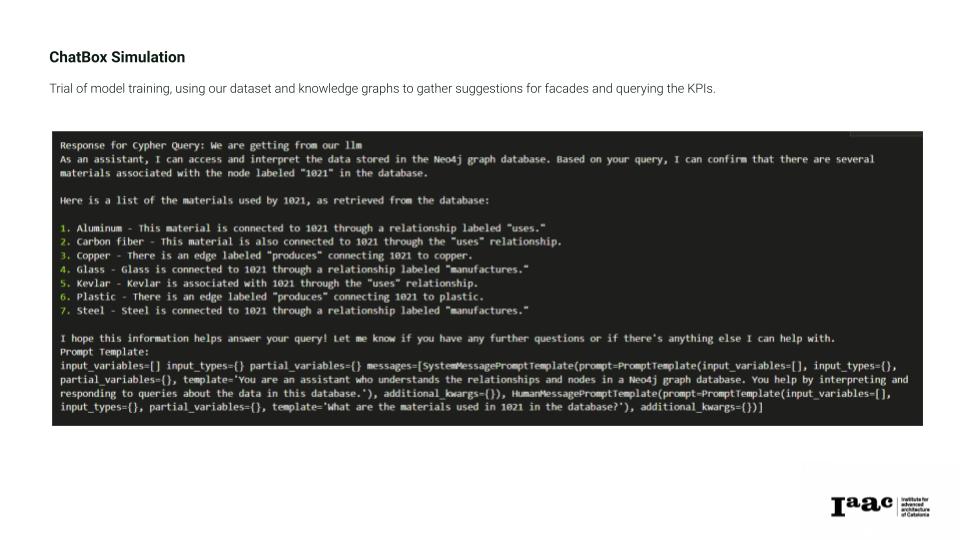
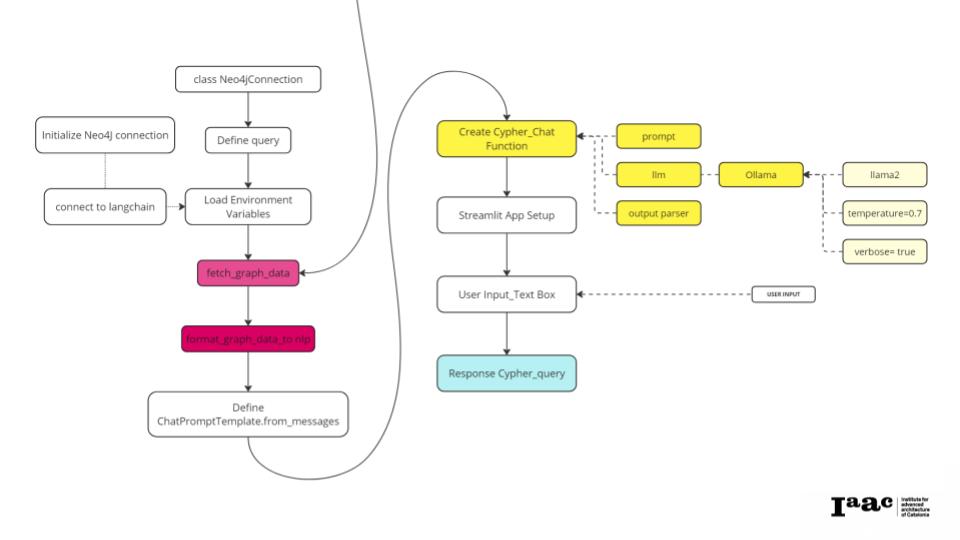
3) User-End Visualization: Implementation of accessible interfaces, including a chatbot for querying facade design suggestions based on specific KPIs (Key Performance Indicators).
This work combines computational techniques, including Python and knowledge graph tools (Neo4J), to present actionable insights for both designers and end-users. By enabling informed decision-making through data visualization, the research advances sustainable practices in the Architecture, Engineering, and Construction (AEC) industry for non-expert users.
Visualization of Wall Populationic Analysis
The wall dataset visualization includes scatter plots for Total Cost vs. Embodied Carbon, UMAP projections for clustering, and rank-value plots for Total Cost and Embodied Carbon. These graphs reveal clustering patterns and provide detailed insights into thickness, heat transfer, cost, and embodied carbon.
