Abstract:
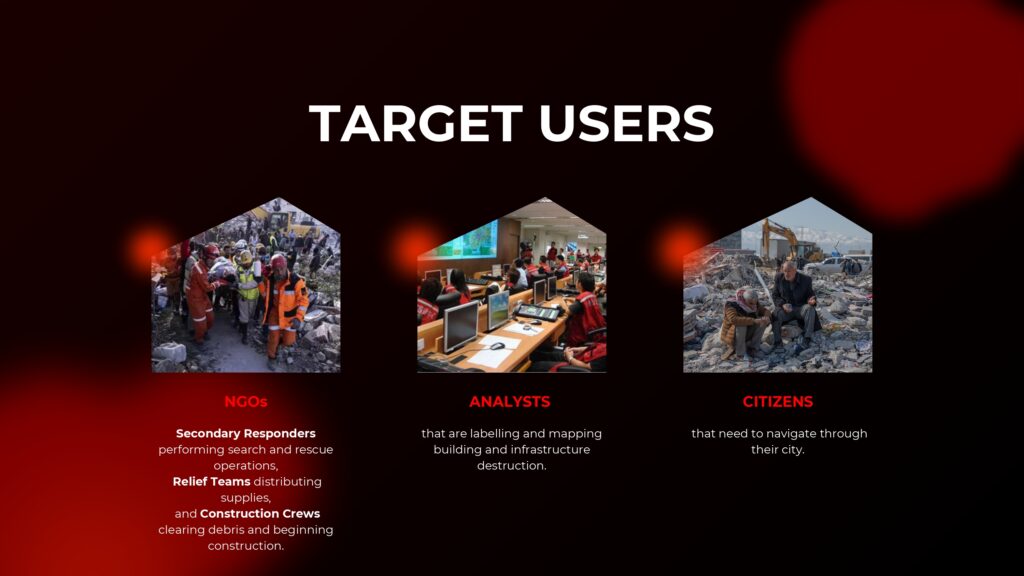
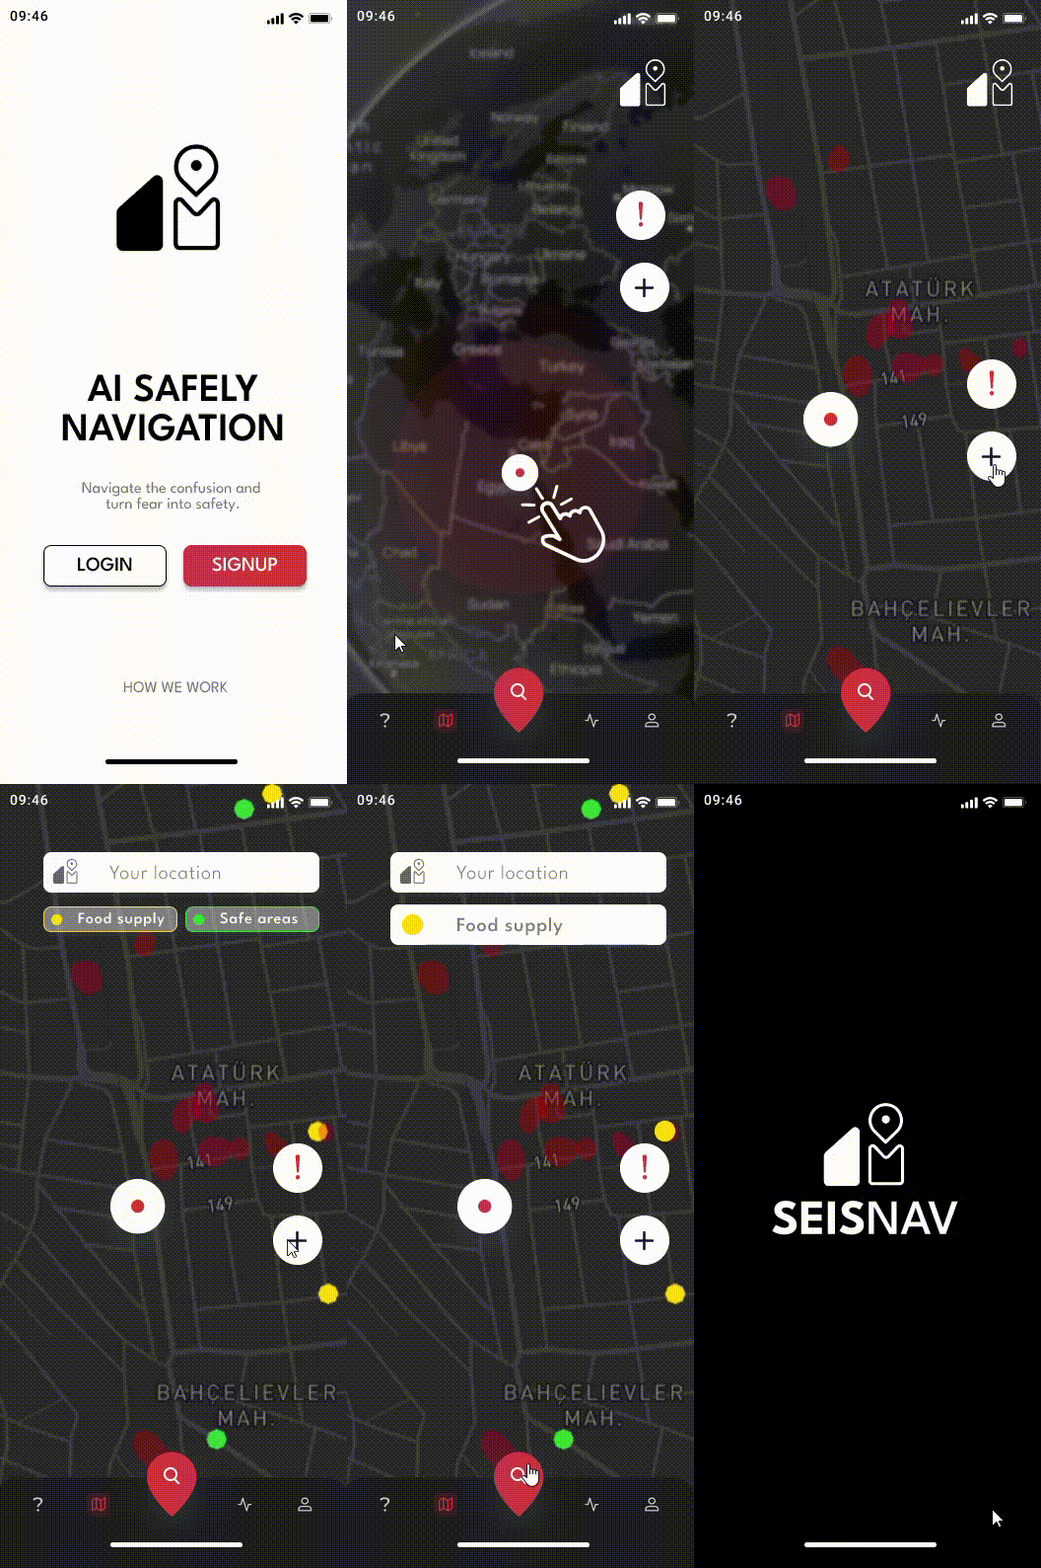
Natural disasters, especially earthquakes, often leave roads blocked, buildings collapsed, and maps outdated, making navigation and response efforts highly challenging, That’s where we operate. Our project SeisNAV is an AI-powered platform that combines satellite imagery and computer vision to detect collapsed structures and road blockages, providing real-time mapping and navigation tools for disaster response teams, NGOs, and civilians. By automating the identification and mapping of obstructions, we aim to reduce reliance on time-consuming manual analysis and ensuring rapid updates as new data becomes available. Ultimately SeisNAV aims to improve disaster responses by bridging the gap between data and decision-making, enabling safer and more efficient rescue operations.

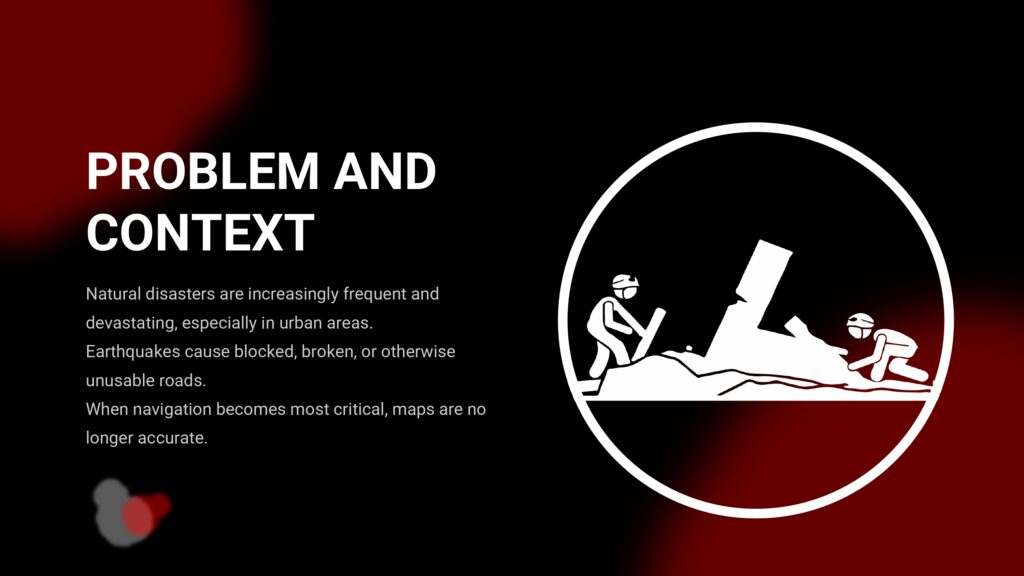
After an earthquake, analysts map collapsed buildings and blocked roads from satellite images for disaster teams, NGOs, and citizens. This slow, labor-intensive process must be repeated as the satellite images are updated.

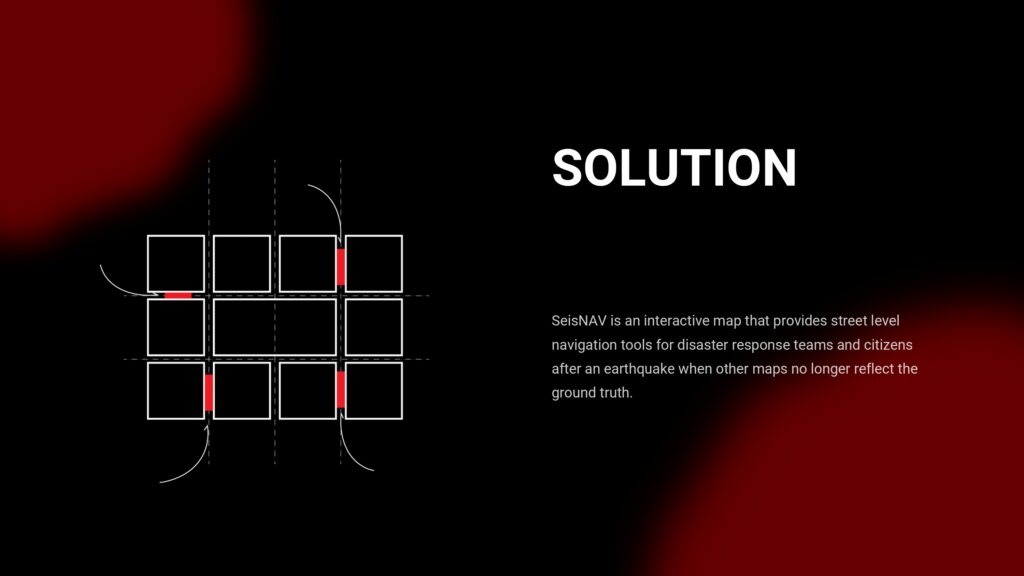
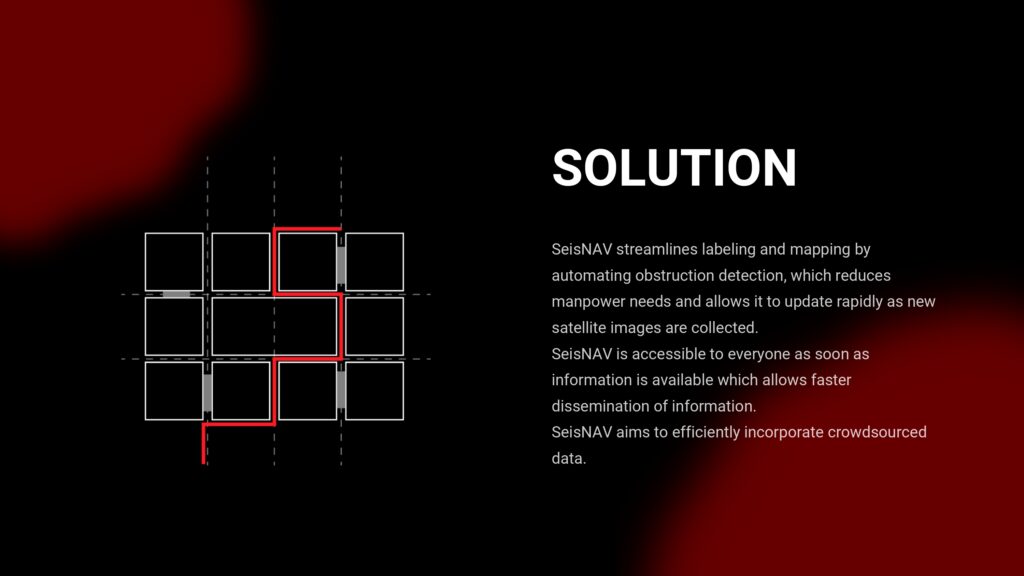
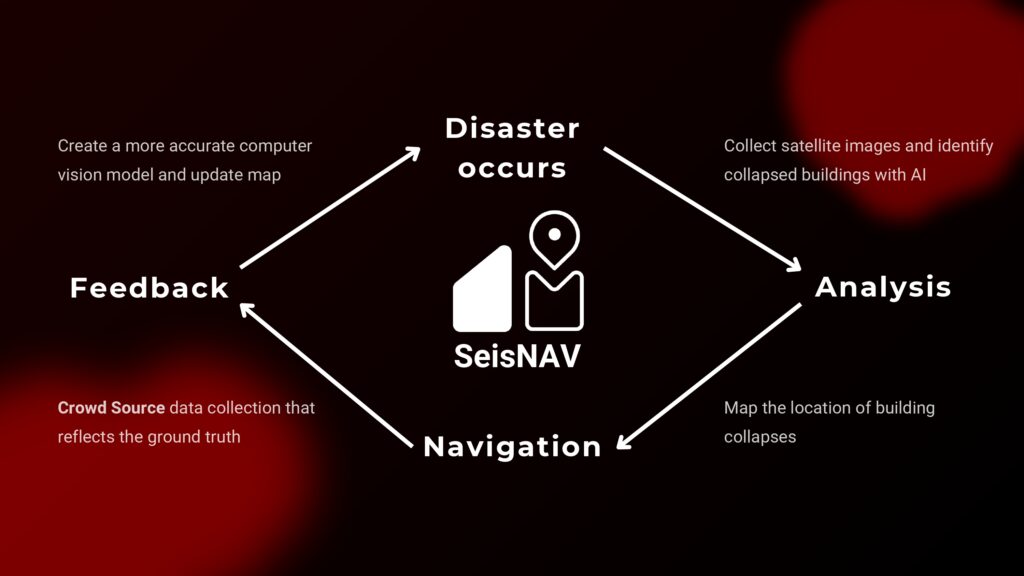
This is the cycle that we want to integrate
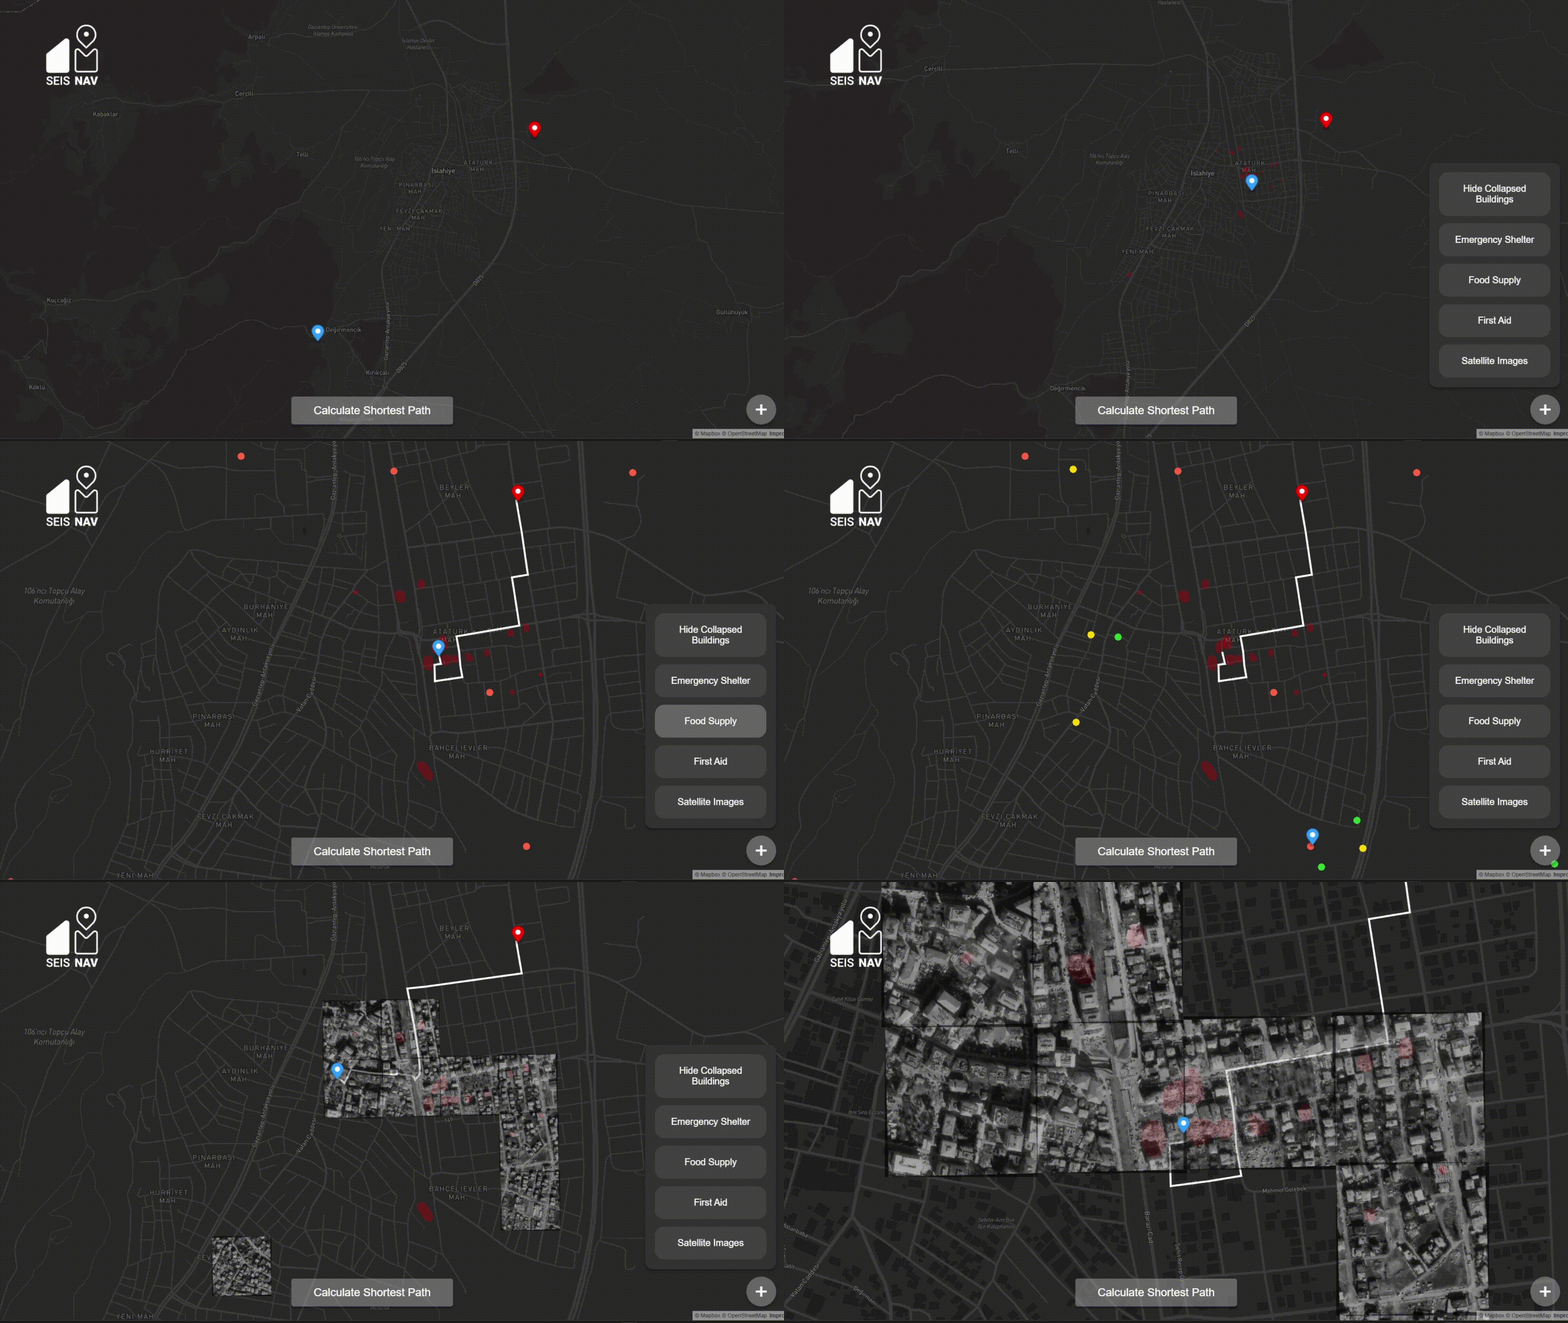
Interface Demo
Our process
Step 1:
COLLAPSE DETECTION
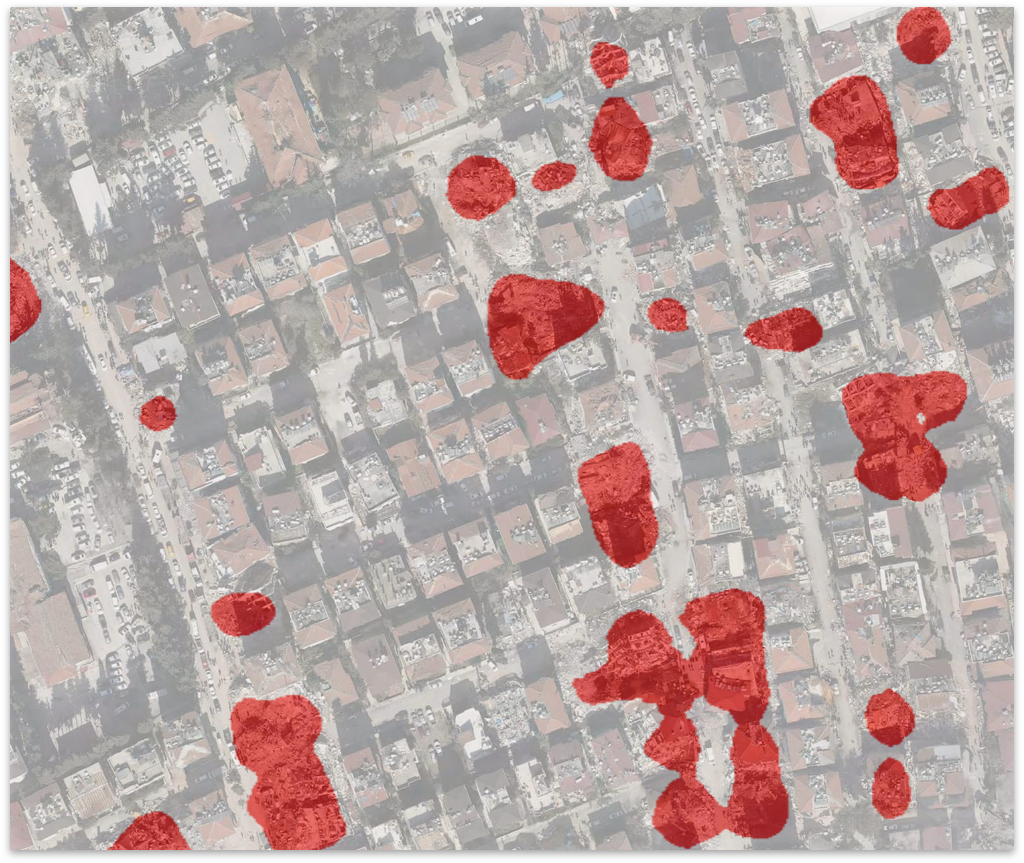
Our first objective is to build a computer vision system that can detect the outline of collapsed structures and their debris from satellite images
Dataset
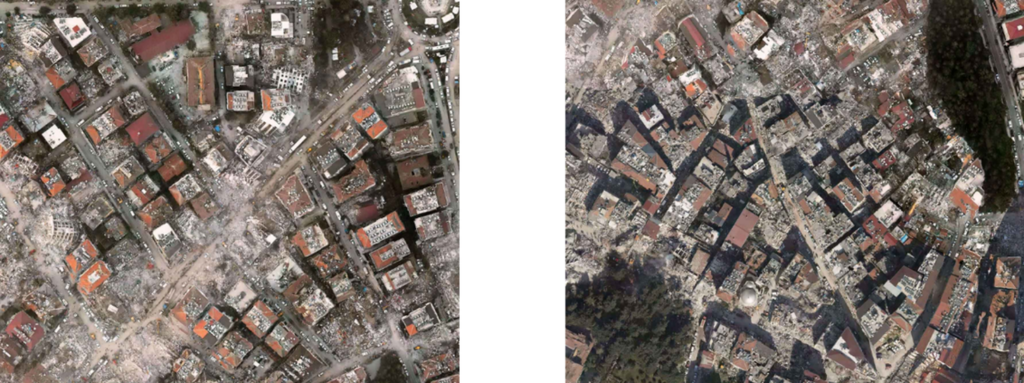
Maxar is a satellite company that takes images of areas that have been devastated by natural disasters to aid with emergency response. They provide an open source dataset on their website with images from most major disasters going back to 2010.

COMPUTER VISION PLATFORM
Roboflow is an online computer vision platform that allows us to detect collapsed buildings, tunnels, bridges, and their debris

RUNNING THE TRAINED MODEL
This is the output of our trained model. A mask containing the polygons of the detected collapsed buildings (here in red) overlayed on the image that the model has run the inference on.
Step 2:
COLLAPSE MAPPING
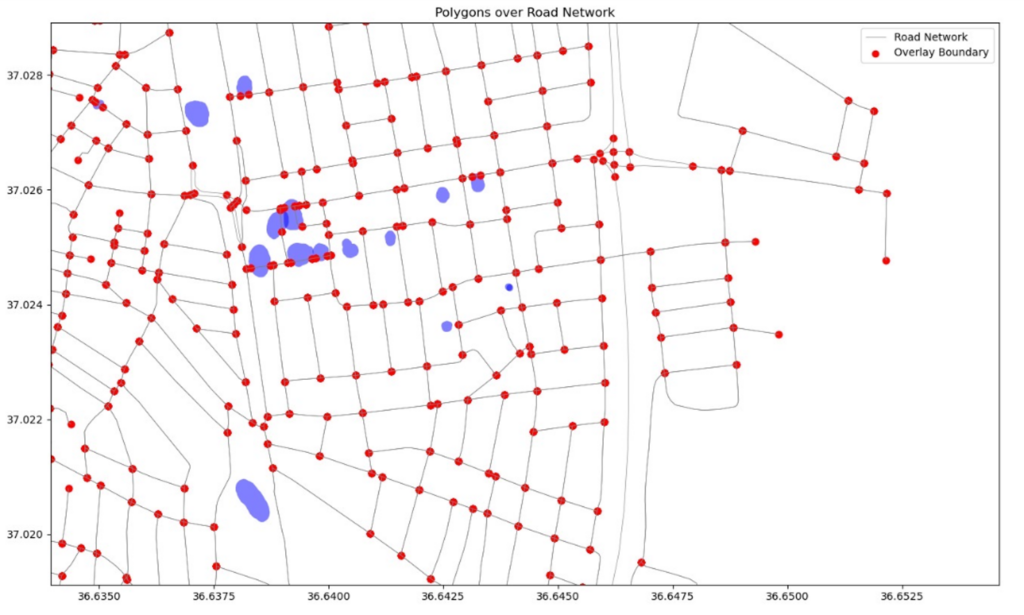
Our second objective is to migrate the collapsed building polygons to OpenStreetMaps
Road Network
OpenStreetMap not only provides data on roads and transportation infrastructure, but also has data on police, fire, and ambulance stations, hospitals, and other relevant disaster response infrastructure.
COLLAPSE POLYGONS OVERLAID ON OSM
Step 3:
TESTING AND EVALUATION
Our third objective is to evaluate and improve the accuracy of blockage detection.
MODEL PERFORMANCE
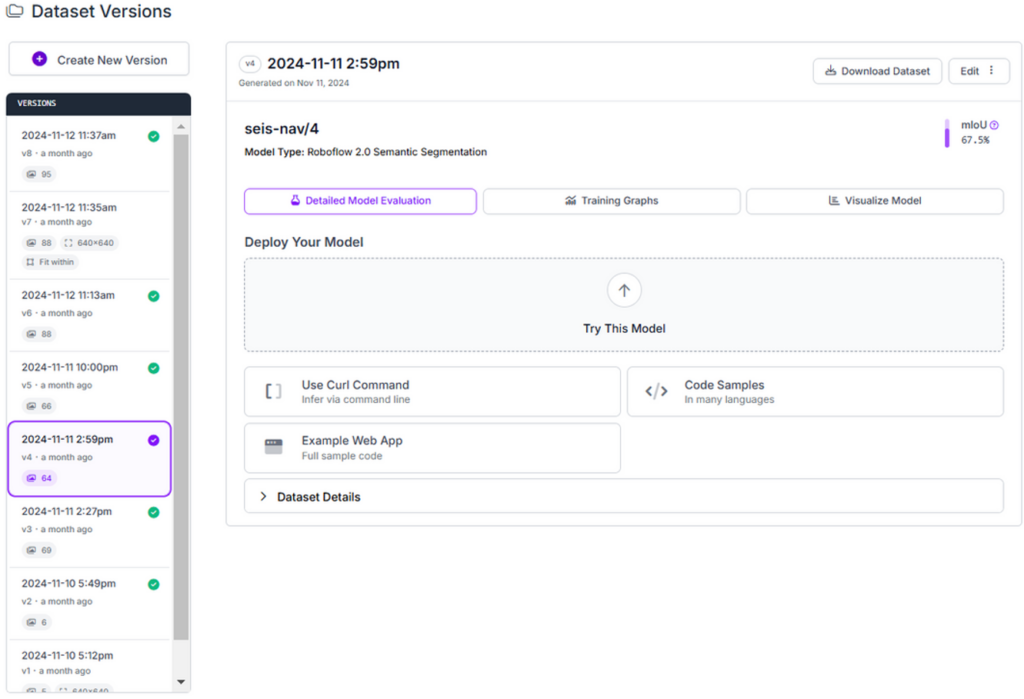
To get the most accurate model, we experimented with 6 different training methods. Taking into consideration image annotation methods, as well as different preprocessing tools and augmentation parameters.
We have ended up with different accuracy readings ranging from 16% to 67.5% mIoU.
Step 4:
USER INTERFACE
FUTURE RESEARCH DIRECTIONS
Direction 1:
INCORPORATING DRONES
The second possible path is to identify critical infrastructure, bottlenecks, and suggestions for how cities can prepare themselves for disasters based on data analysis of digital disaster simulations.
Technical diagram

Direction 2:
URBAN PLANNING FOR DISASTER CONTINGENCIES
The second possible path is to identify critical infrastructure, bottlenecks, and suggestions for how cities can prepare themselves for disasters based on data analysis of digital disaster simulations.
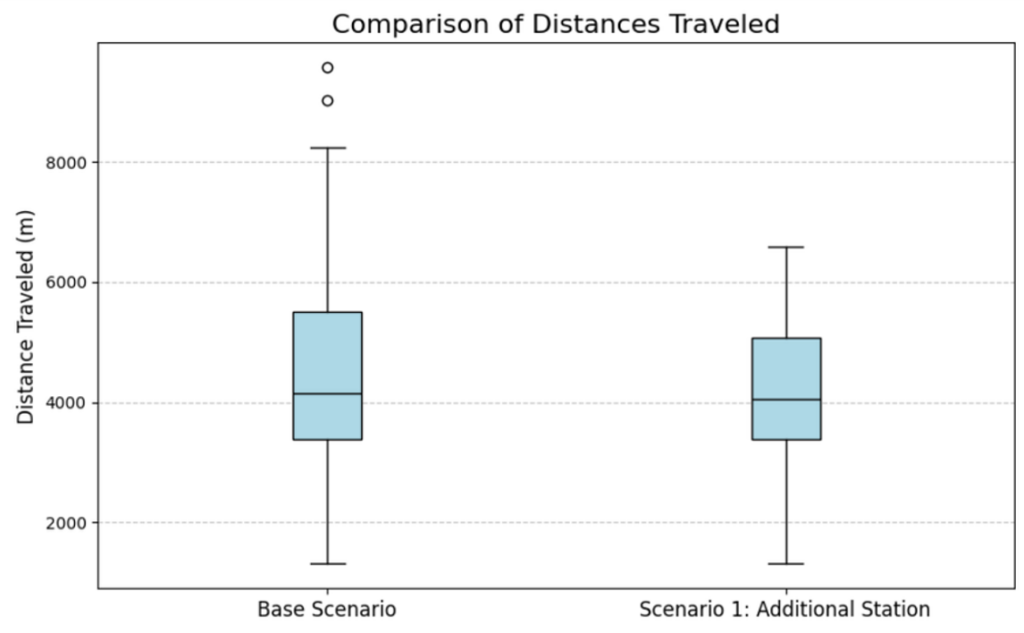
Scenario 1:
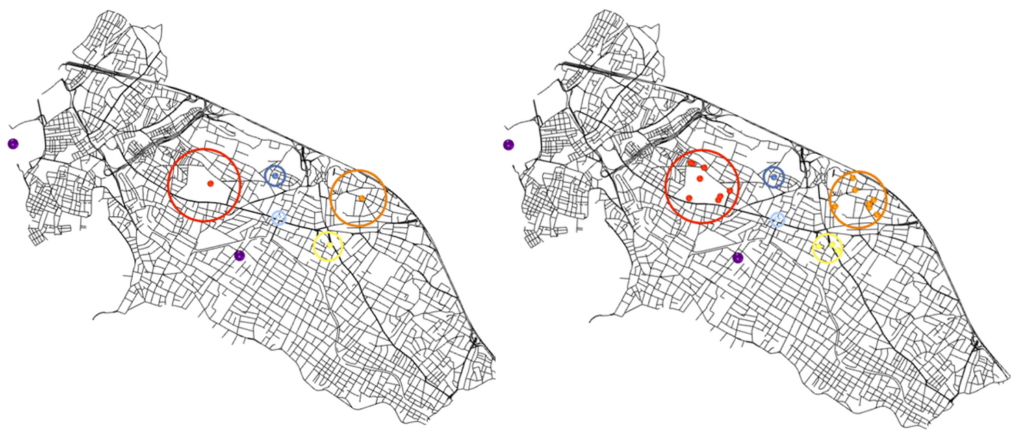
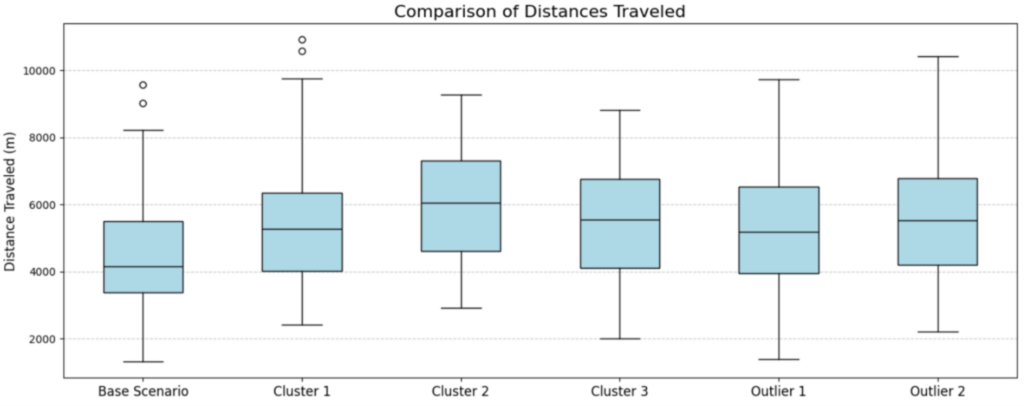
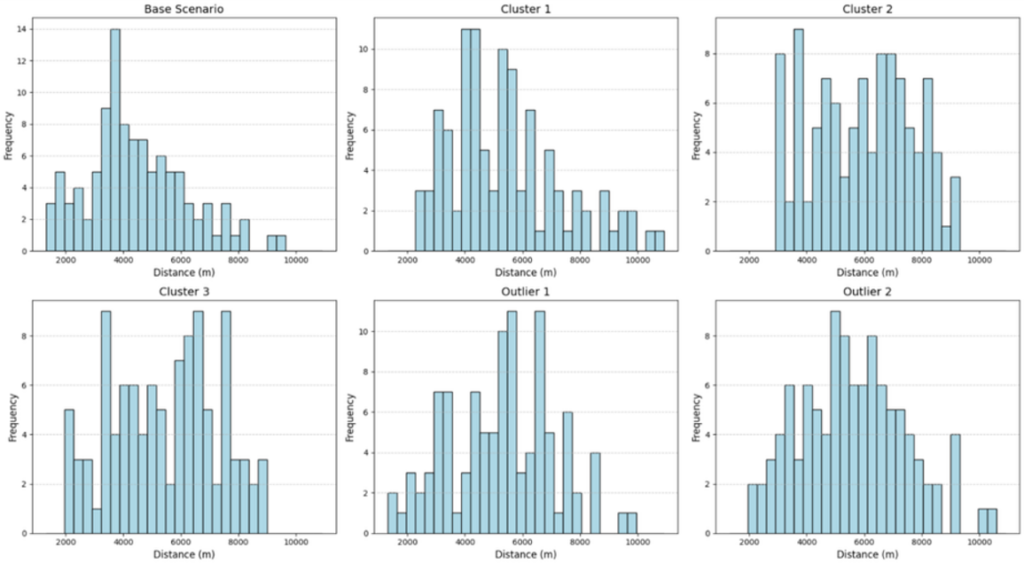
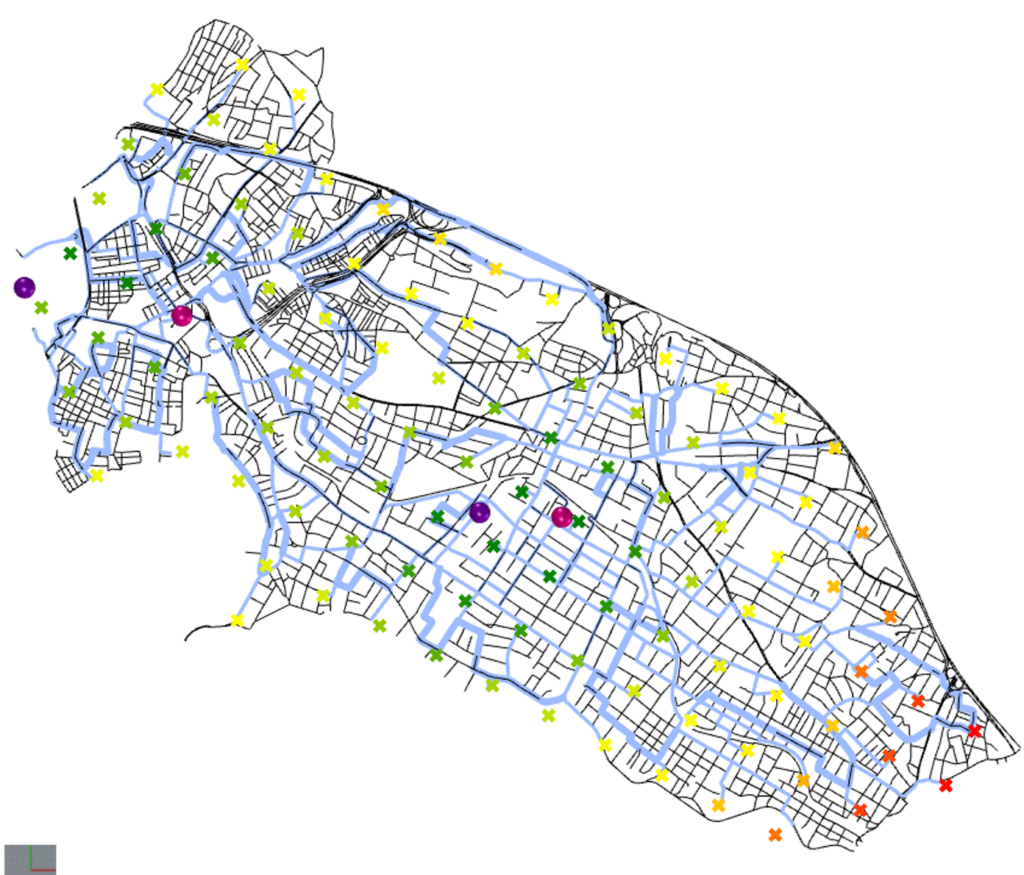
Our first scenario imagines that Istanbul allocates funds to construct a third ambulance station in the Kadikoy district, and planners want to ensure that the additional ambulance station optimally reduces emergency response times in that district. Our task is to determine where to place the additional ambulance station to optimally reduce ambulance response distances.
Scenario 2:
This scenario imagines that the city of Istanbul decides to consolidate the two ambulance stations in Kadikoy into one location and planners want to ensure that the consolidated ambulance station increases emergency response times by as little as possible. Our task is to determine where to place the consolidated ambulance station to minimize the increase in ambulance response distances.
