Introduction
In an era of rapid urbanization, the Hyper-Building concept emerges as a response to the complexities of modern city life. Rather than viewing it as a single architectural entity, we approached it as an interconnected urban system—a city within a city. Like any urban environment, it must address challenges related to accessibility, functionality, and livability. As the Services Team, our primary focus was to enhance access to amenities and integration of green and open spaces, ensuring a well-connected and vibrant living environment.
This vision aligns with the Hyper-Building’s design philosophy, which is deeply rooted in traditional Japanese architectural principles. Inspired by:
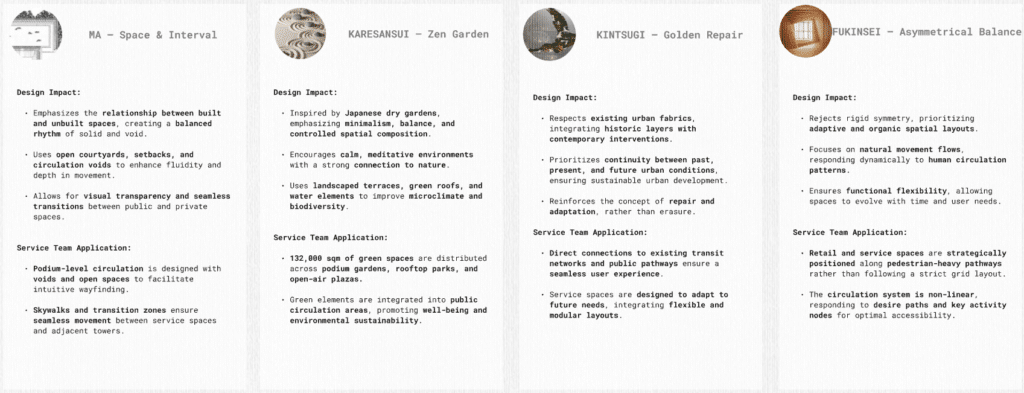
- MA – Space & Interval (Emphasizing spatial relationships and fluid transitions)
- KARESANSUI – Zen Garden (Balancing simplicity and contemplation in spatial design)
- KINTSUGI – Golden Repair (Emphasizing adaptation and resilience in built environments)
- FUKINSEI – Asymmetrical Balance (Creating harmony through irregularity and organic movement)
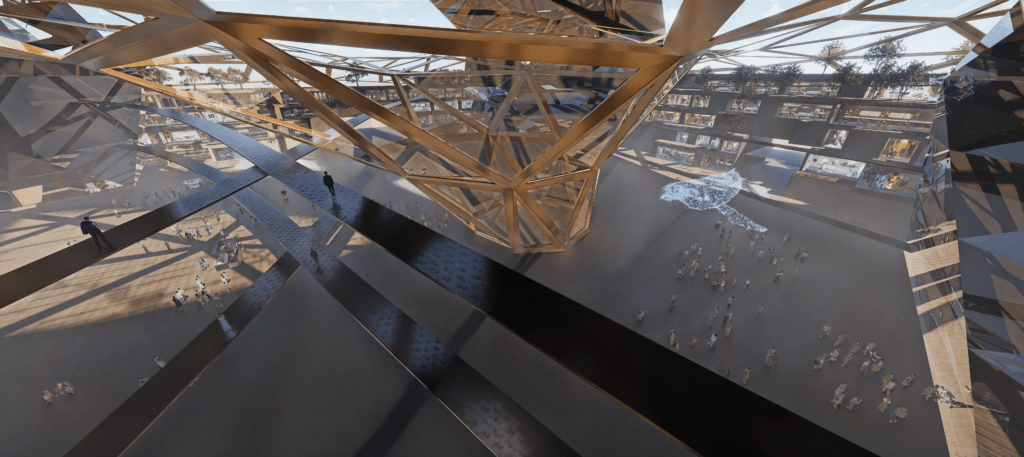
The image below illustrates how service design incorporates these principles, shaping the building’s spatial, functional, and circulation strategies.
Scope of Work
Our work revolved around defining and optimizing circulation, accessibility, and service integration within the Podium—the essential hub of the Hyper-Building. This involved:
- Establishing program requirements through design research.
- Establishing Key Performance Indicators (KPIs)
- Developing geometrical explorations in Rhino and Grasshopper to refine spatial strategies.
- Collaborating with other teams to collect travel distance and accessibility data from residential and bridge sections.
Program Development
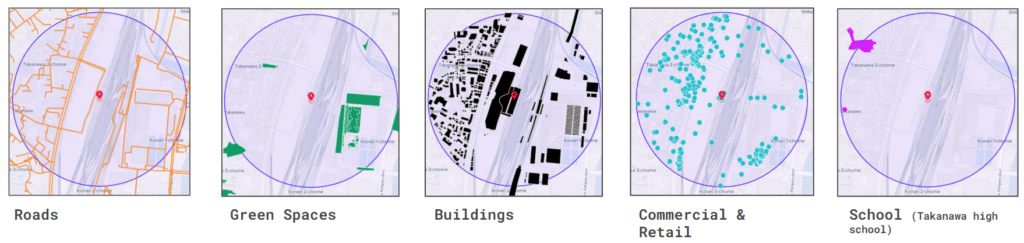
We began our study with background research, focusing on a 500-meter radius around the site. We examined amenities, green spaces, roads, buildings, commercial retail facilities, and schools. This research laid the foundation for the next phase of program development.
The various requirements we identified were based on this initial study and the projected number of inhabitants within the Hyper-Building.
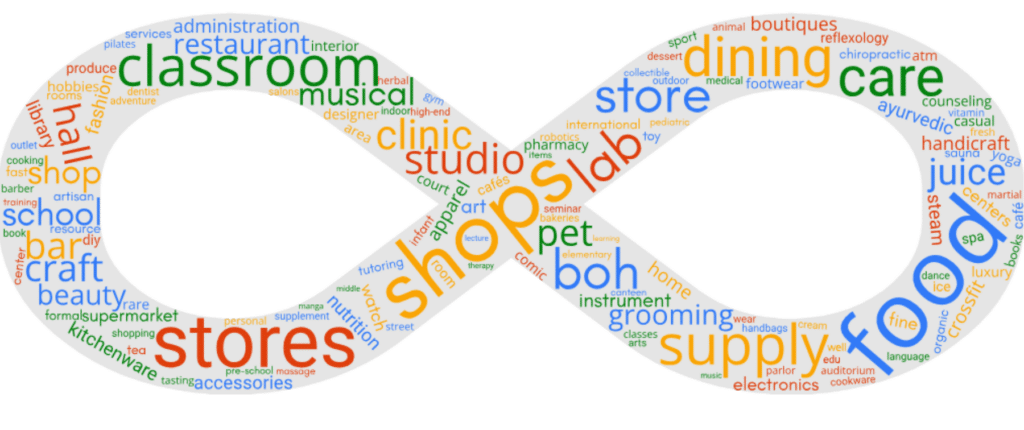
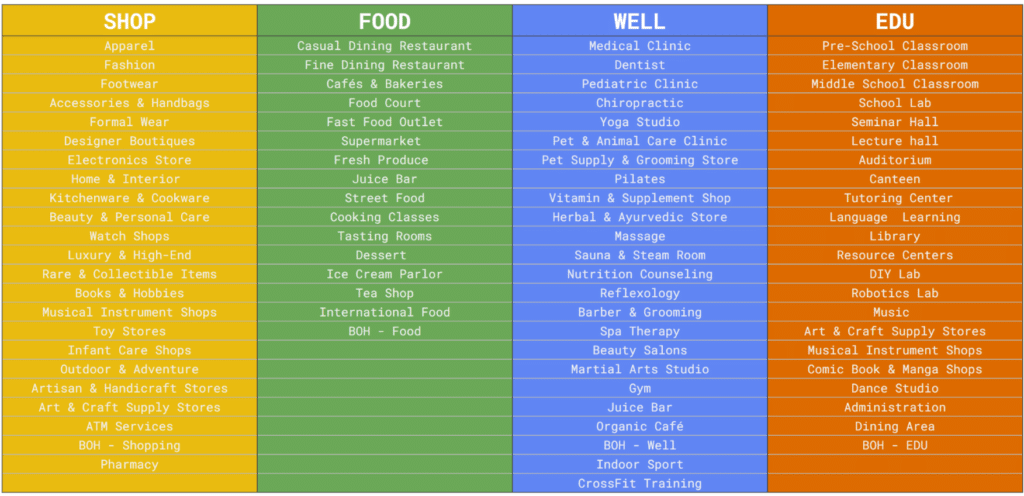
These requirements were then categorized into four broader sections:
- Education – Schools, libraries, and learning centers
- Wellness – Healthcare facilities, fitness centers, and recreational spaces
- Shopping – Retail stores, markets, and convenience outlets
- Food – Restaurants, cafes, and grocery stores
Key Performance Indicators (KPIs)
To ensure our design decisions met real-world needs, we set specific KPIs to measure the impact of accessibility and spatial integration, including:
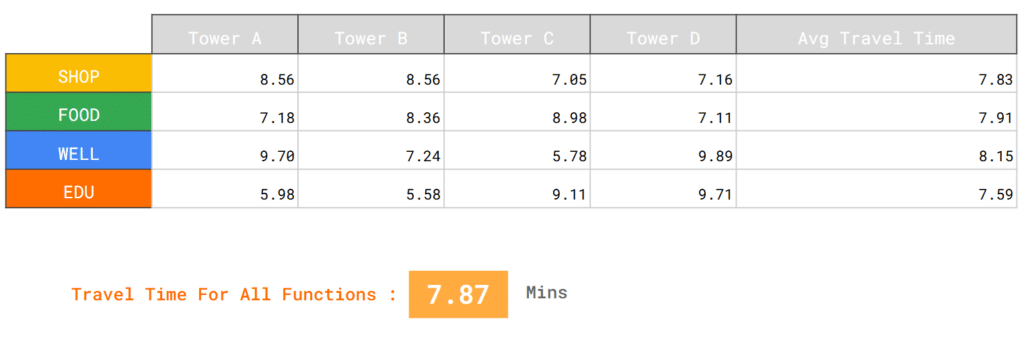
- Travel time efficiency between key nodes within the Hyper-Building.
- Ratio of green/open spaces to built-up areas to enhance environmental quality.
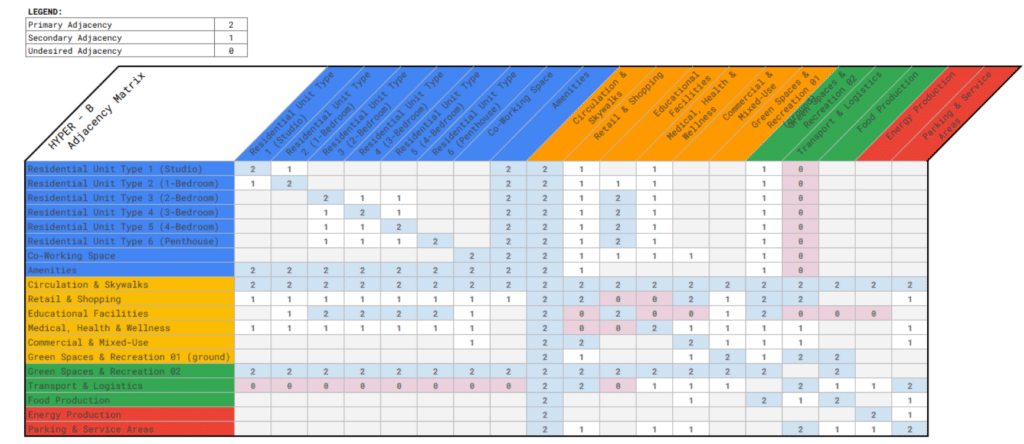
For travel time efficiency, we first conducted an adjacency matrix analysis, which helped us determine the optimal placement of functional programs. This analysis provided an ordered structure for program distribution, ensuring that key amenities remained accessible.
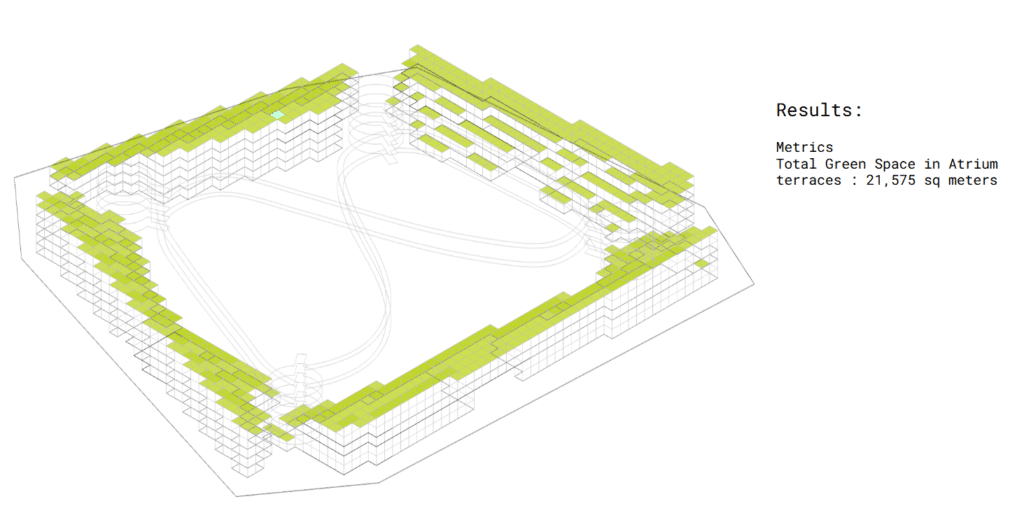
One key decision we made was prioritizing green spaces as a primary goal for the residents. By integrating accessible green and open spaces within the Podium, we aimed to enhance well-being, encourage social interaction, and contribute to environmental sustainability.
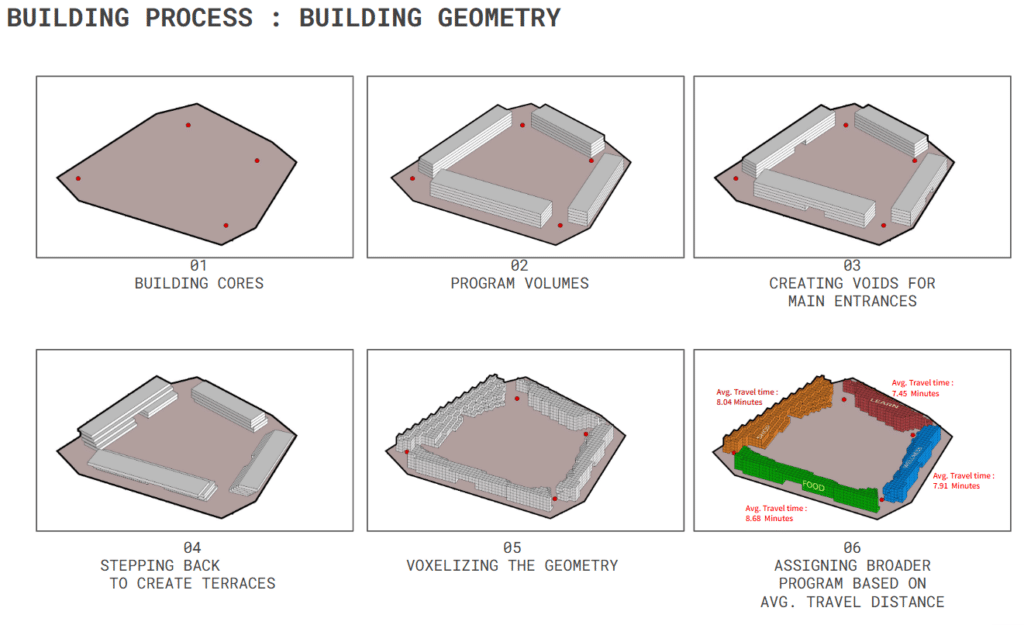
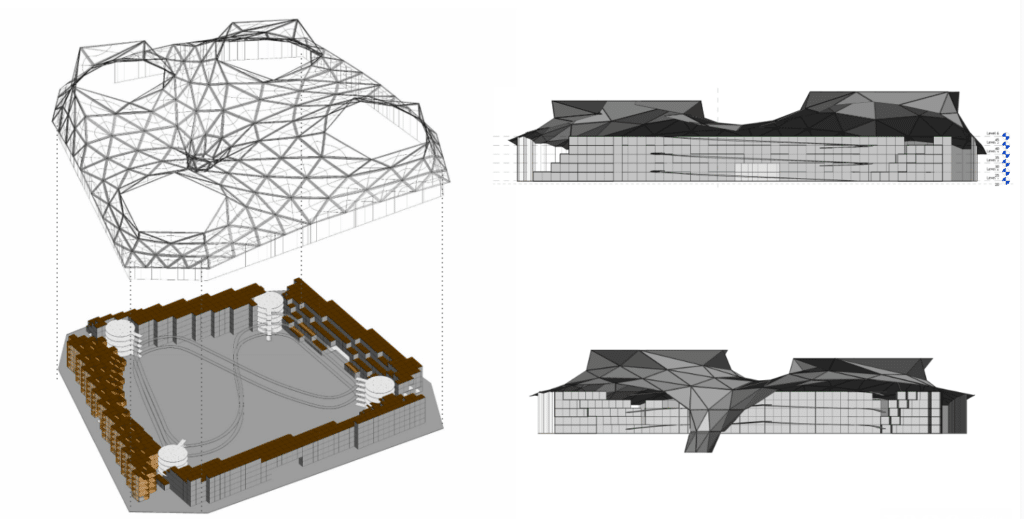
Building Process:
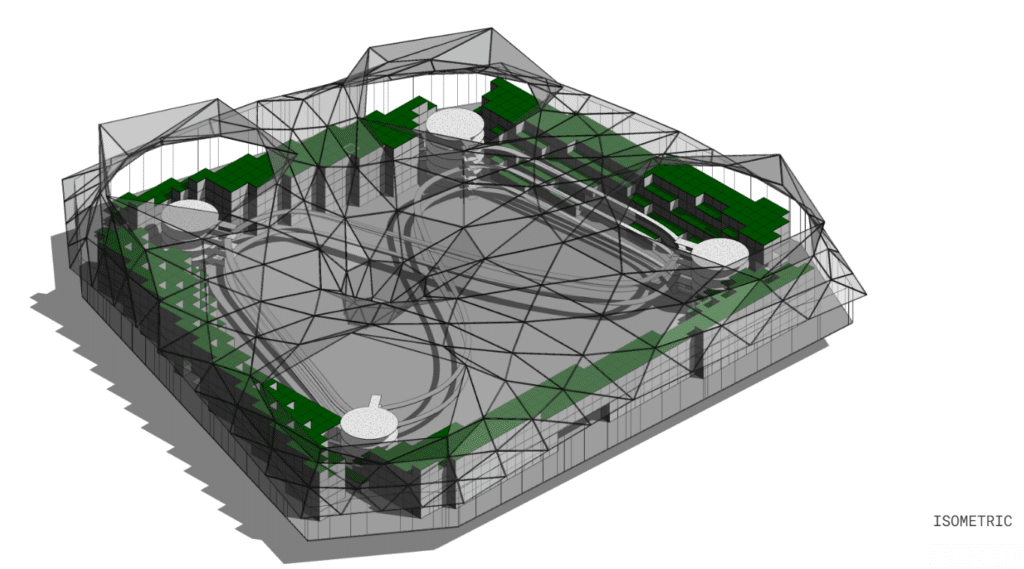
The building process was guided by KPI requirements, with the form strategically stepped back to create green terraces and program blocks assigned based on average travel time. The following process diagrams illustrate this approach.
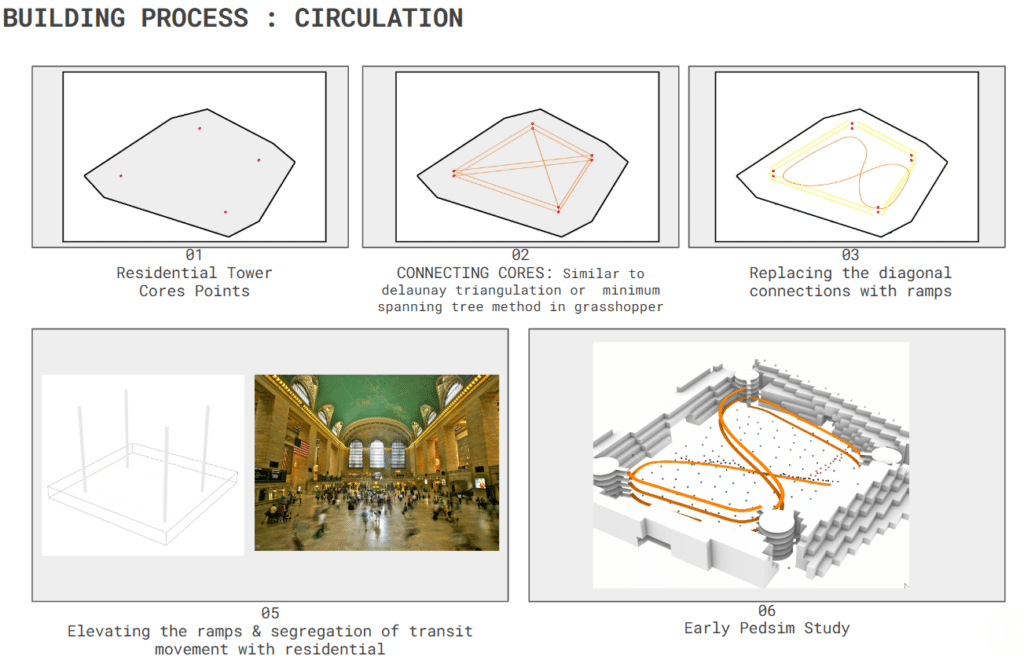
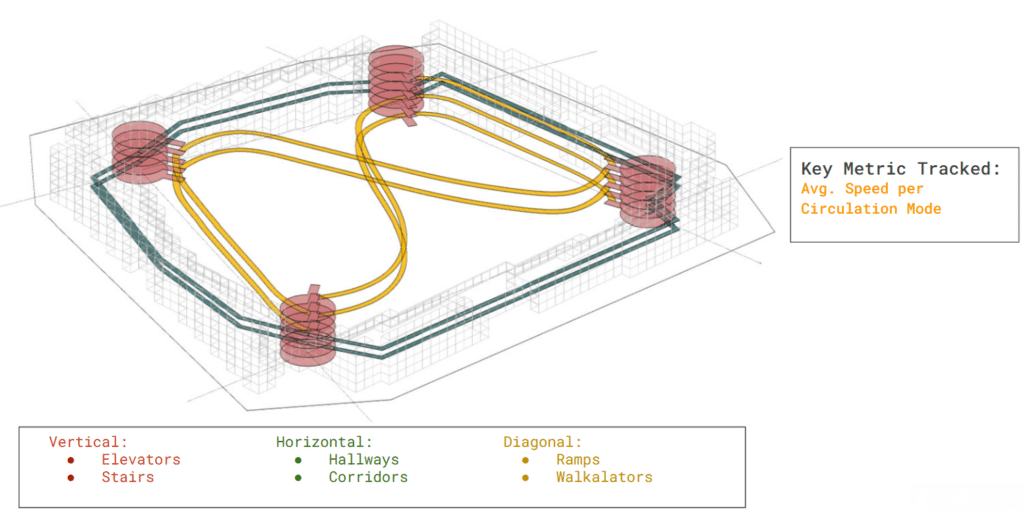
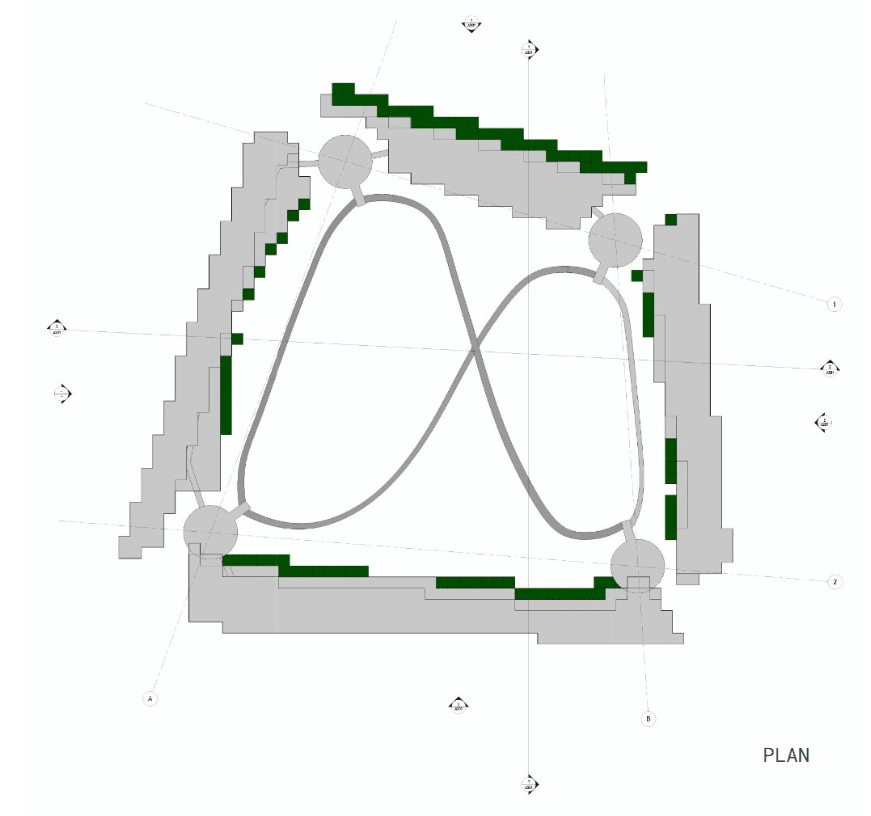
To optimize circulation within the Hyper-Building, we explored how to efficiently connect the four tower cores. We employed computational methods similar to Delaunay triangulation and minimum spanning tree algorithms in Grasshopper, ensuring that every point was connected efficiently. This approach minimized unnecessary circulation paths while maintaining strong connectivity, improving movement flows between key functional areas.
Collaboration & Data Integration – We established dynamic links between Google Sheets and Grasshopper to track and update geometrical data in real-time.
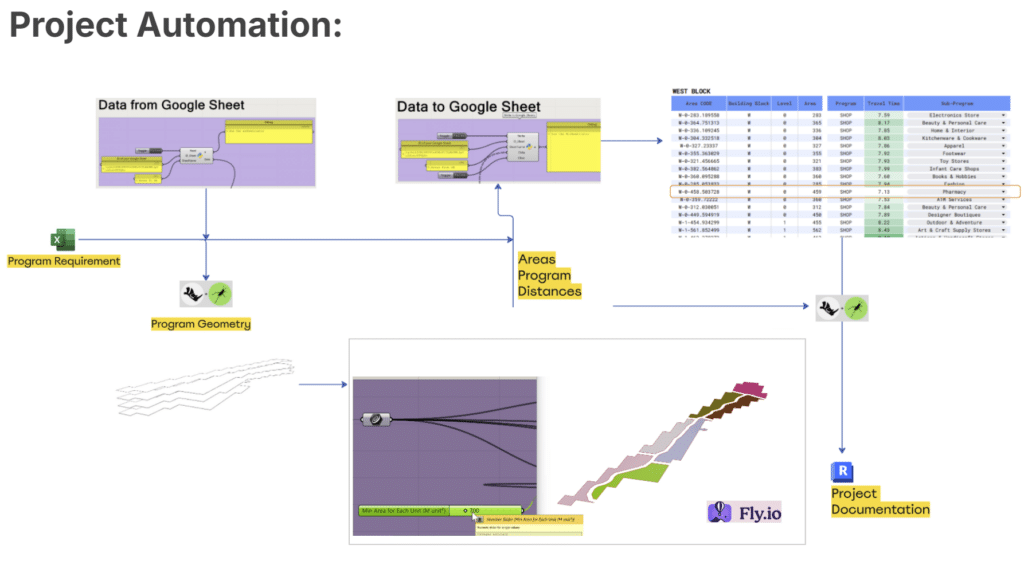
Refinement & Iteration – We continuously tested and refined circulation networks, service layouts, and access points to align with KPI targets.
Measuring Success:
We created a Power BI dashboard with real-time visualization of programmatic distribution, featuring a Speckle model viewer for interactive spatial exploration and automated data analysis to evaluate travel distances, program allocations
Detailed Design:
As we moved toward implementation: We finalized our documentation in Revit, ensuring design precision and presentation graphics were developed using D5 Render.
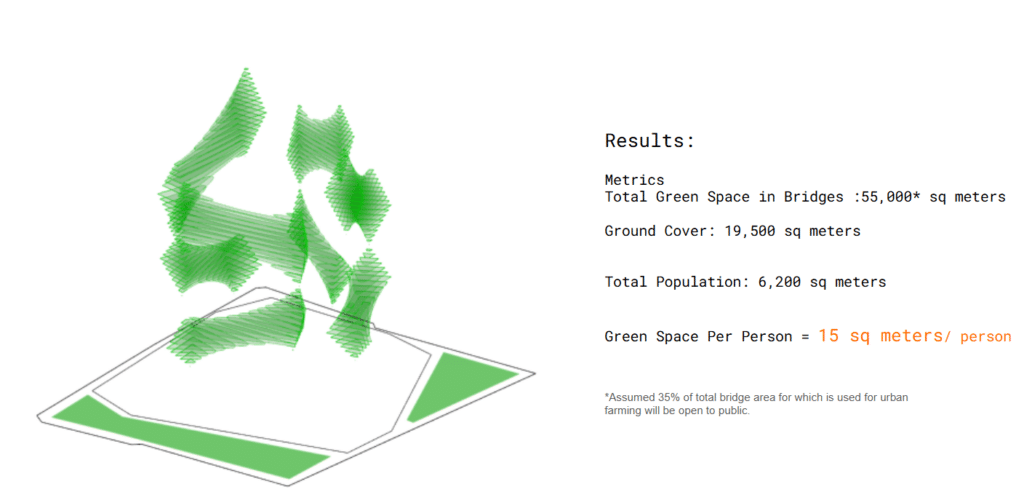
KPI OUTCOMES : Green Space Per Person
KPI OUTCOMES : Distance Per Function
Visualizations: