Petrópolis: Analysis & Strategic Responses for Flood-Vulnerable Contexts
1.1. History of the city
Summary – 1.1. History of the City
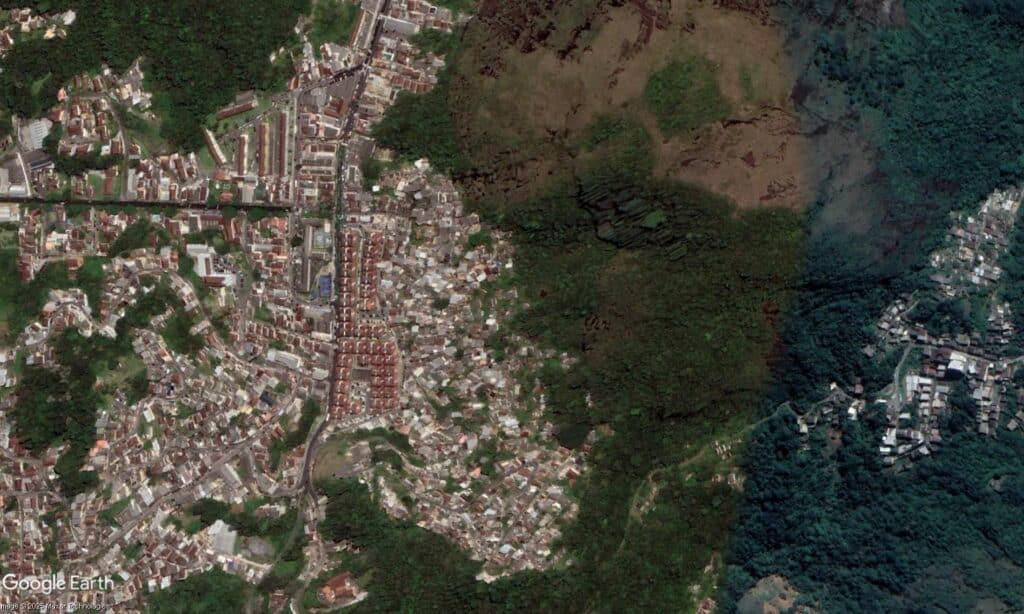
Petrópolis initially developed in valleys and along riverbeds, where construction was easier, but this laid the groundwork for future vulnerabilities. Located within the Atlantic Forest Biome, only 12.4% of its original forest remains due to deforestation and urban expansion since the 19th century.
Set in steep terrain and just over 60 kilometers from Rio de Janeiro, the city has attracted tourism and residential growth, but is also highly vulnerable to landslides, flash floods, and geotechnical risks. With a current population of around 305,000, Petrópolis faces a complex mix of ecological fragility, cultural heritage, and social inequality.
The ongoing loss of forest cover, occupation of steep slopes, and development in flood-prone areas highlight the urgent need for integrated urban planning that balances environmental risk management, social equity, and sustainable growth.
2.1. Urban Growth and Sprawl 1995-2023
As of 2023, 57% of the global population lives in urban areas—a figure expected to reach 68% by 2050. Latin America is the most urbanized region, with Brazil leading at nearly 88% urbanization. However, rapid and often unplanned urban expansion is pushing vulnerable populations into high-risk zones, especially in mountainous and flood-prone regions.
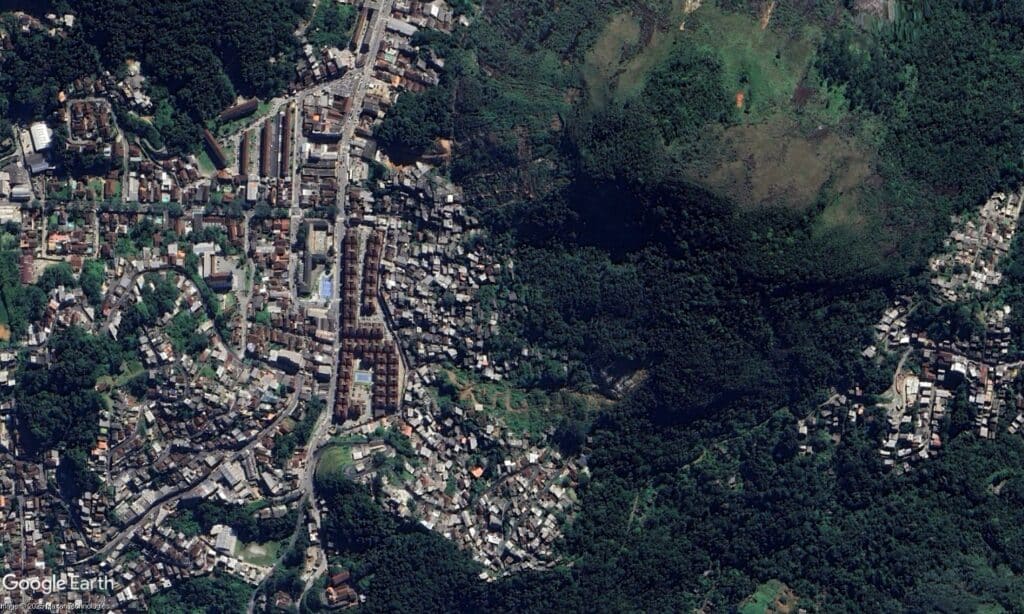
In Petrópolis, this trend is evident through informal settlements expanding into unstable slopes and ecologically fragile areas. These dynamics intensified disaster impacts, as seen in the devastating floods and landslides of February 2022. Affected communities not only lost homes but also vital social networks, weakening local resilience.
Between 1995 and 2020, despite a stable population, Petrópolis experienced vertical urban growth due to geographic limitations, housing pressures, and weak regulations. With flat land becoming scarce, development shifted to higher altitudes within the Serra do Mar range, often without proper oversight, increasing environmental and social vulnerability.
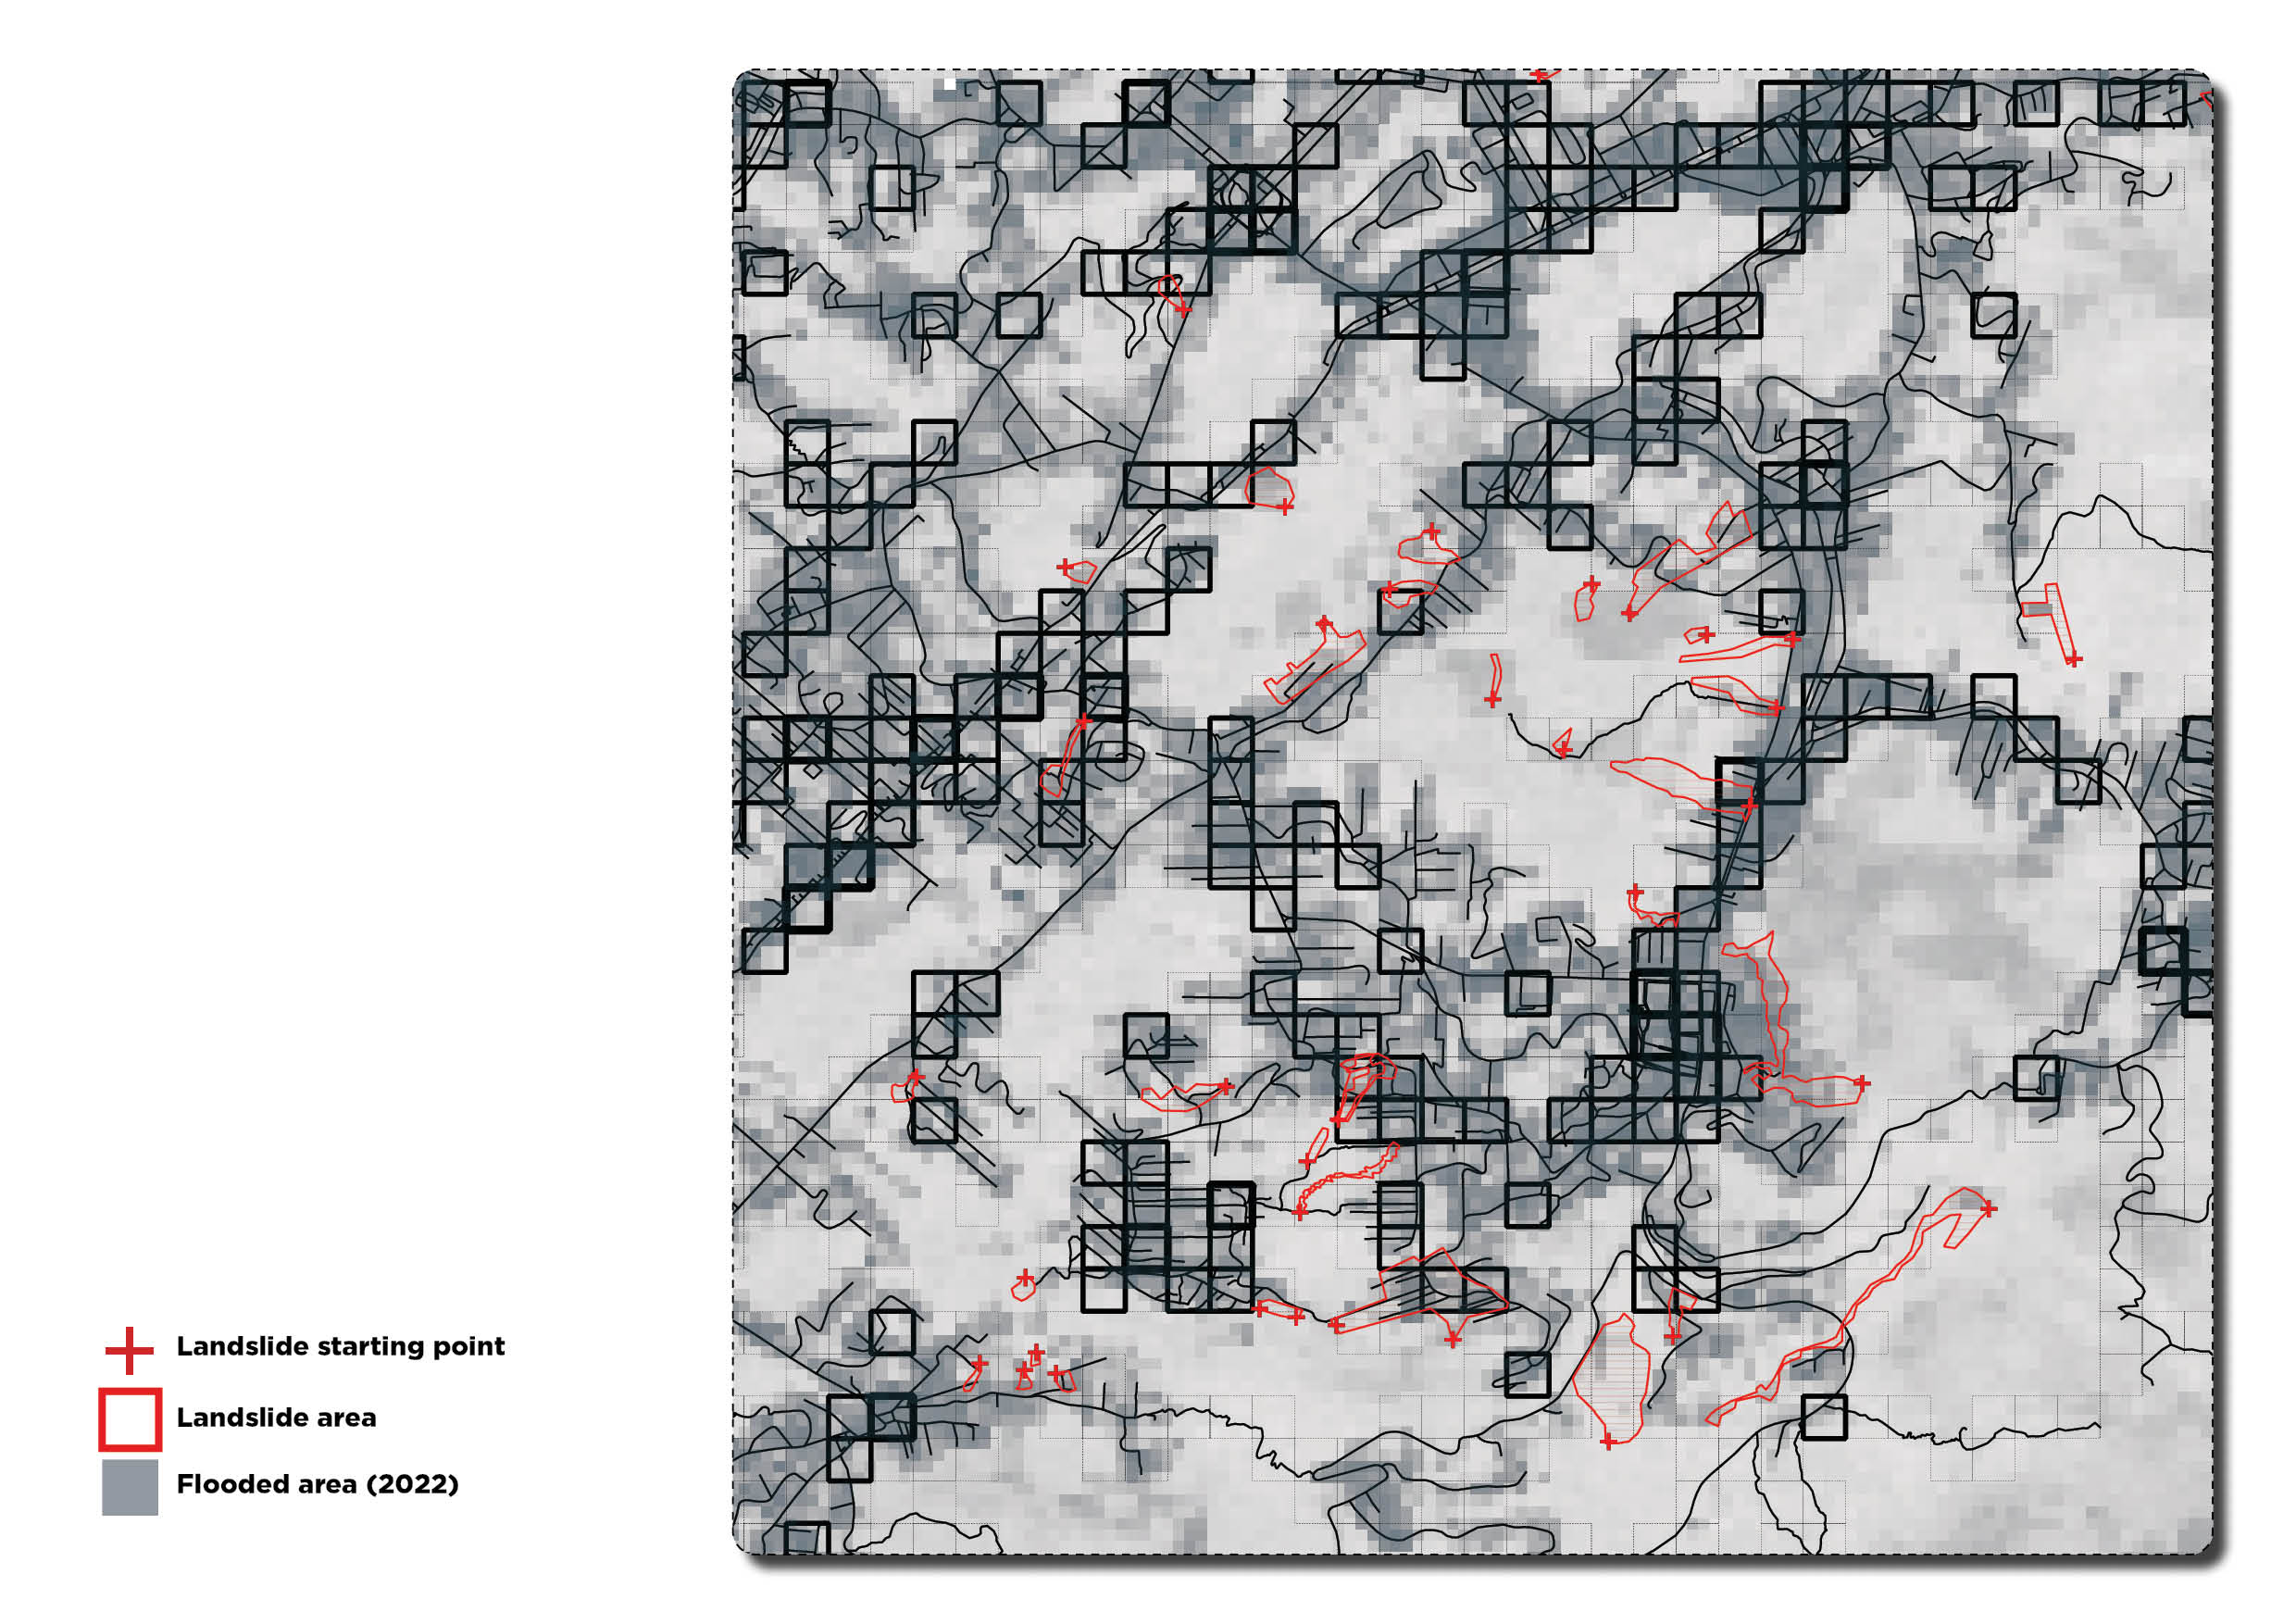
3.1. Landslides (February 2022)
Landslides are among the most devastating natural disasters, particularly in Latin America, where they cause significant loss of life. In Brazil, although less frequent, landslides lead to considerable human and economic impacts, often intensified by climate change and human-induced vulnerabilities.
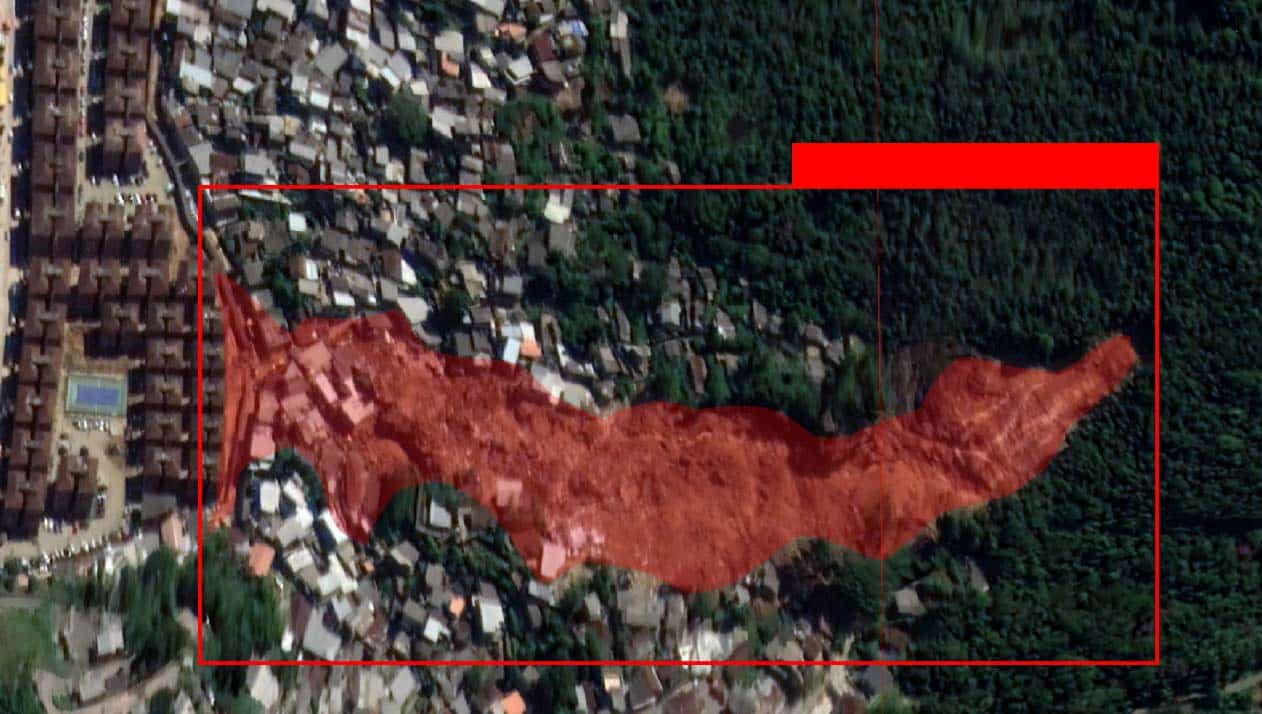
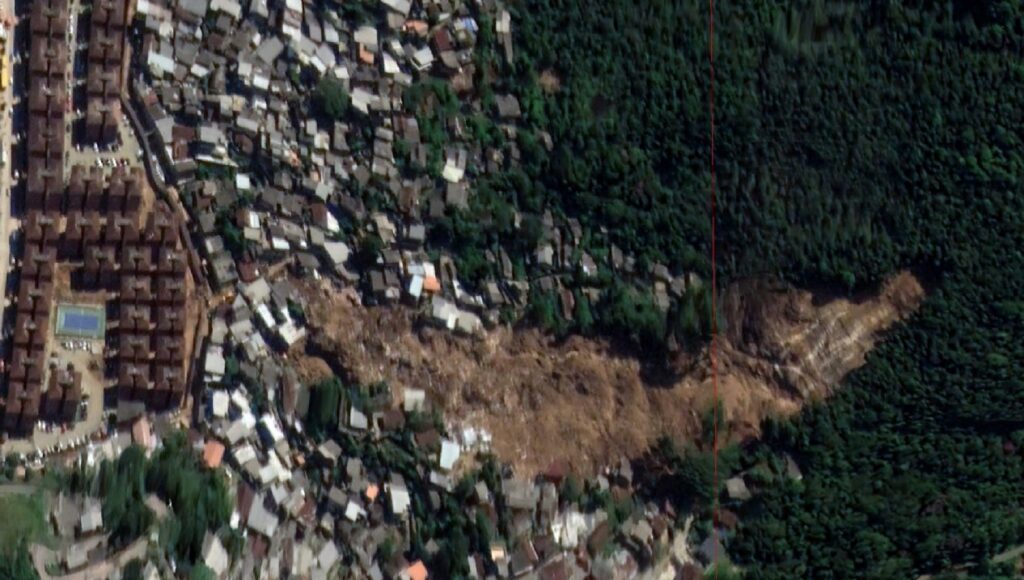
On February 15, 2022, Petrópolis experienced a catastrophic event when 258 mm of rain fell in just three hours due to a powerful mesoscale convective system. This extreme rainfall triggered flash floods and landslides, resulting in 231 deaths—the deadliest landslide disaster in the city’s history.
To understand the disaster’s causes, an analysis of urban morphology and infrastructure was conducted, focusing on factors like building density, road networks, and slope. However, there was a lack of precise data pinpointing the exact locations affected by the landslides.
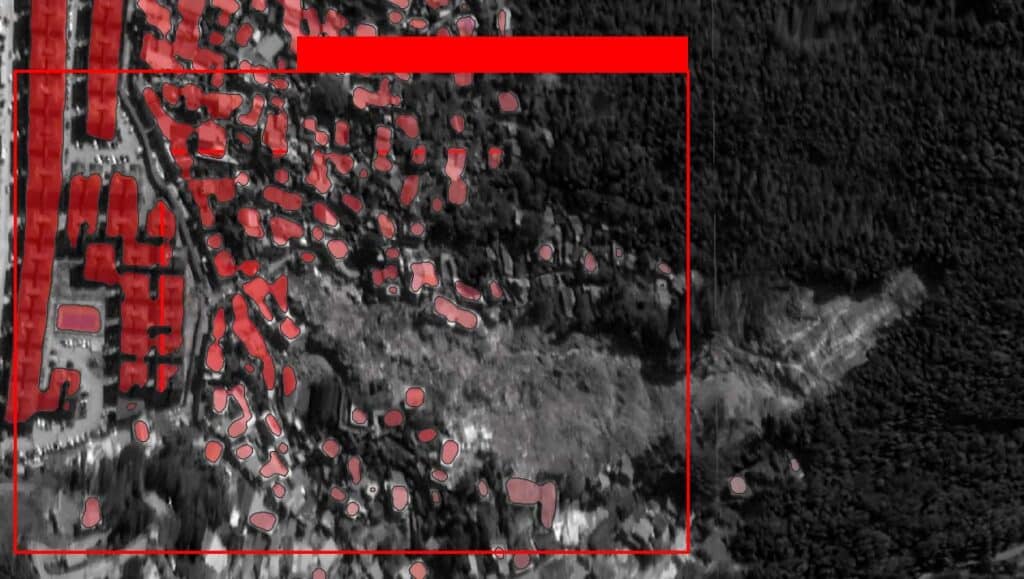
To overcome this, tools like Roboflow and Deepness were explored for detecting landslide-impacted areas via satellite imagery. The idea was to use AI models, particularly building segmentation, to compare pre- and post-event conditions. Yet, this approach faced limitations due to time constraints, inconsistent historical imagery, and the labor-intensive nature of data labeling.
Given these challenges, the team ultimately relied on manual analysis of satellite images from sources like Google Earth to identify landslide zones and assess the urban impact.
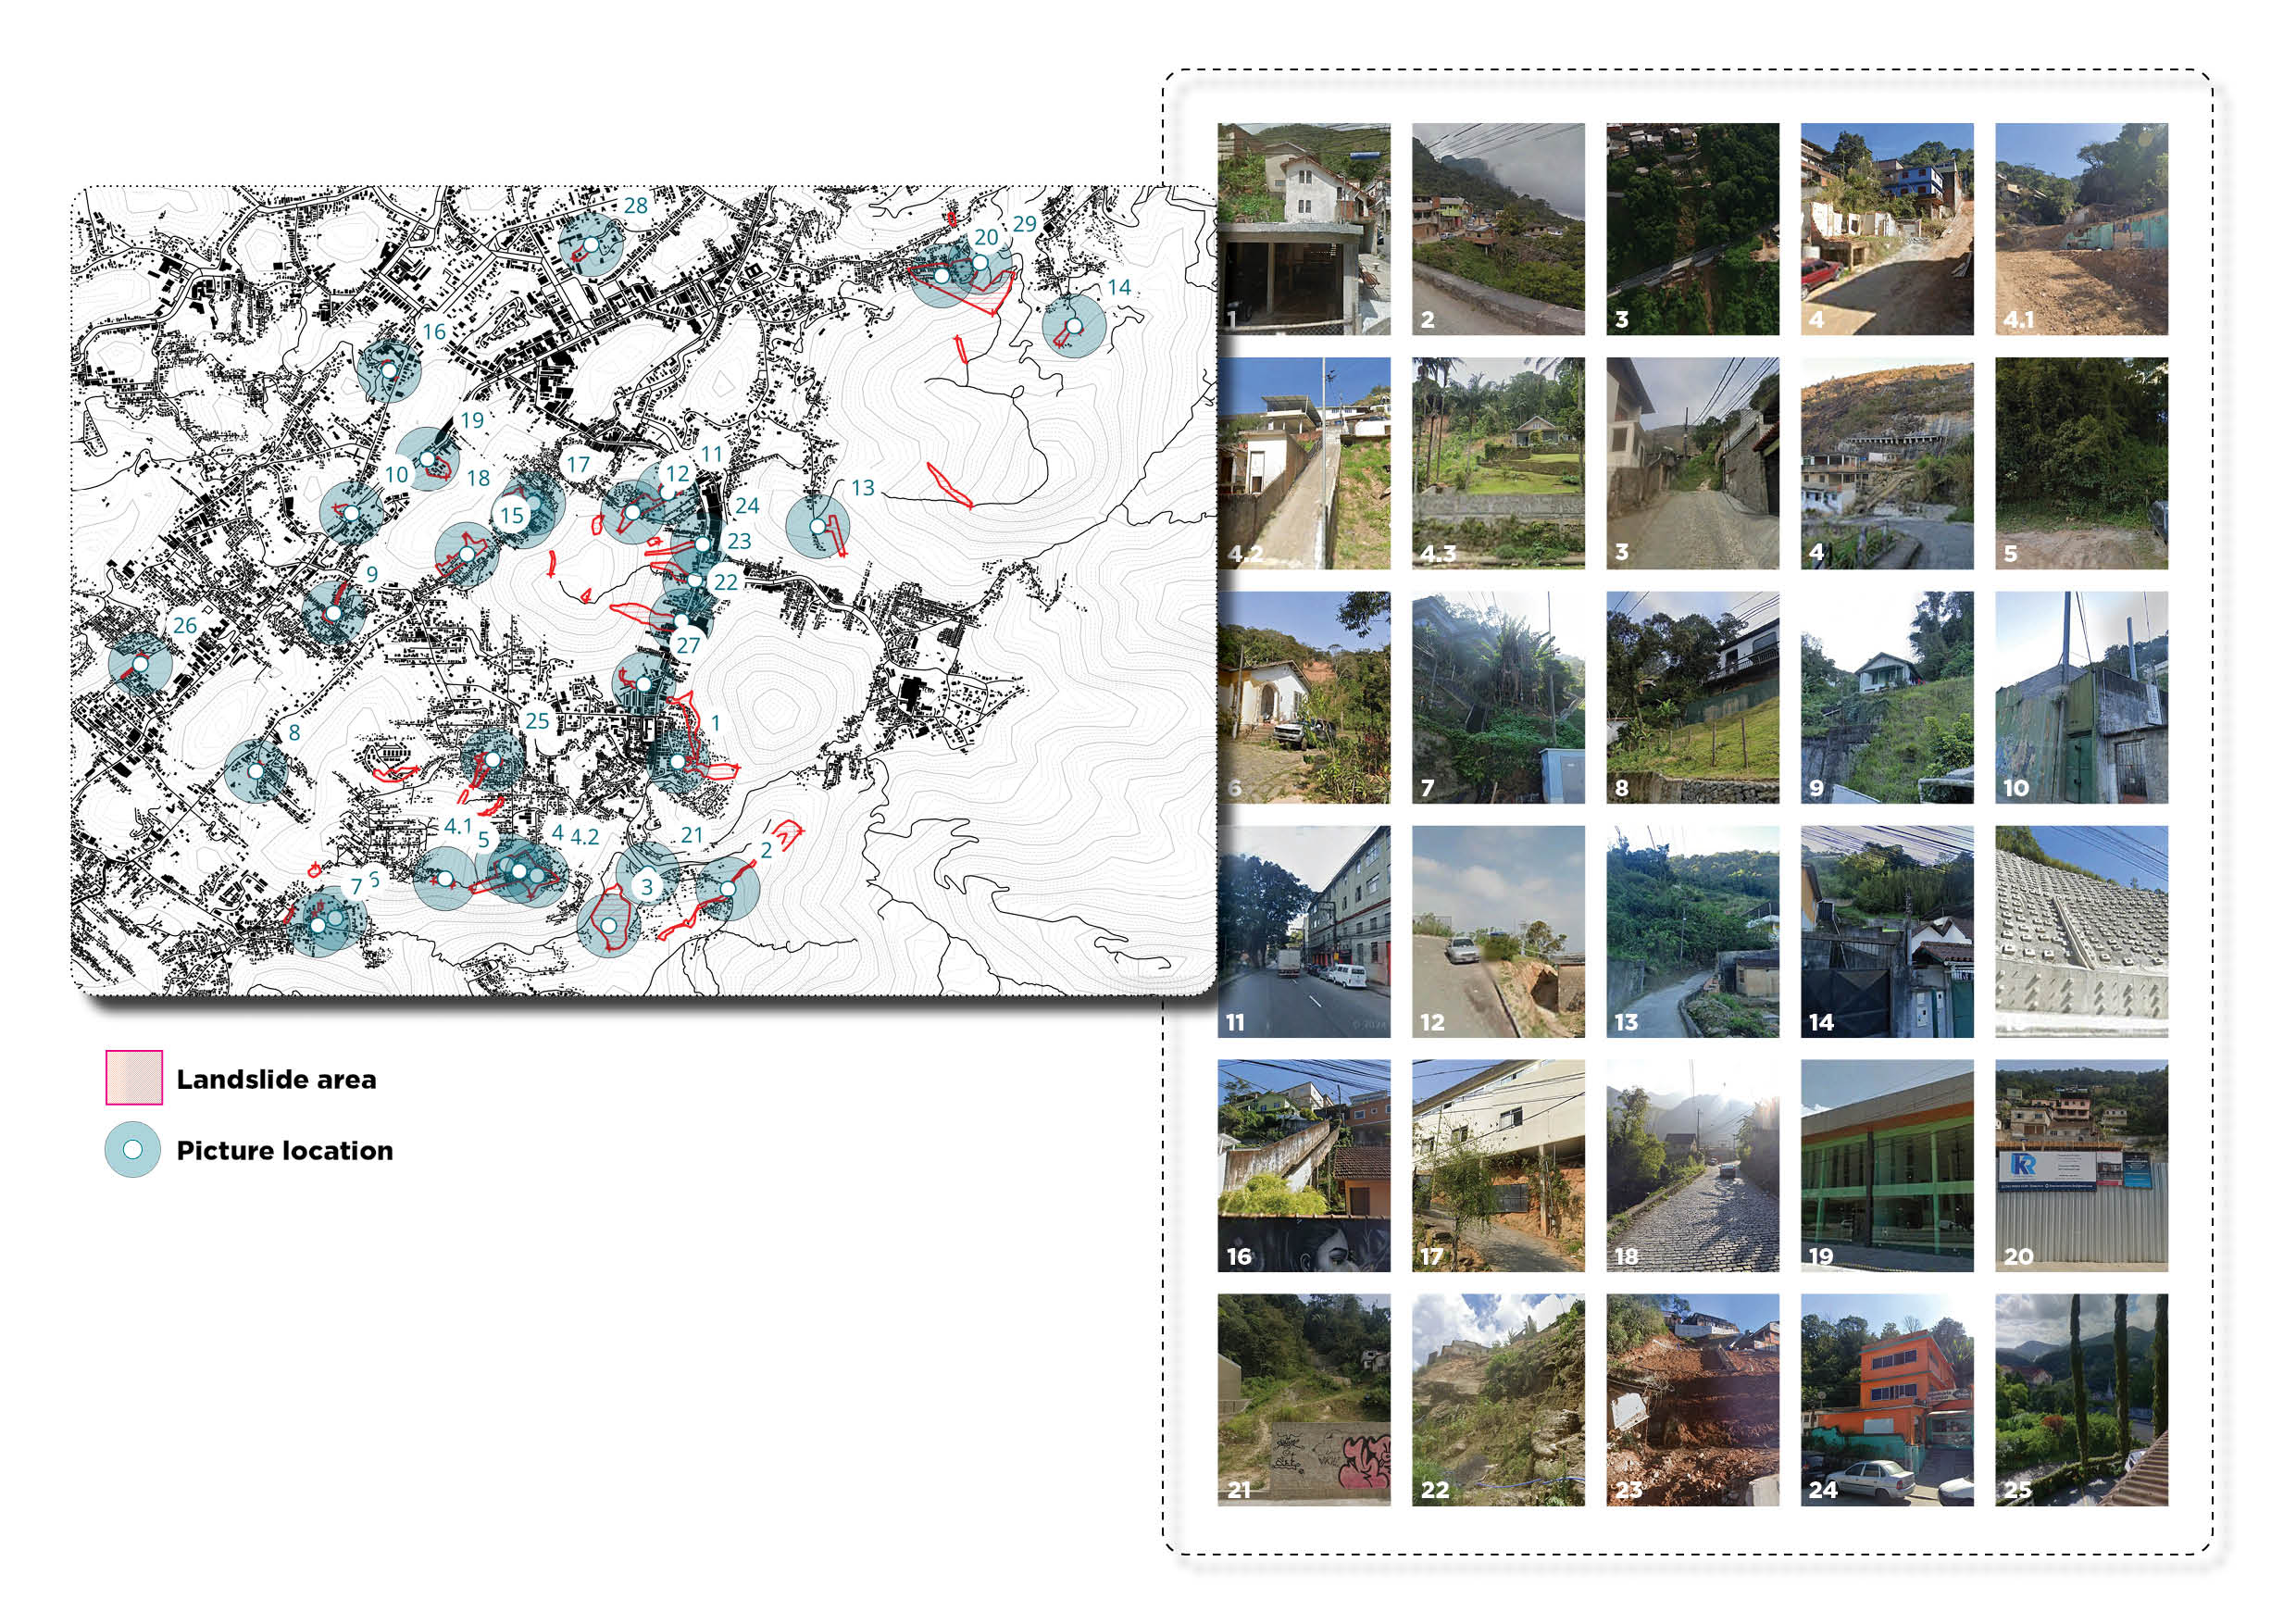
3.2. Computer Vision and Landslides
When we looked into the existing data, we discovered that there was a lack
in information with respect to places where exactly the Landslides or the
floods occurred. In order to scrape data and analyze the landslide affected areas
with respect to Urban morphology, we used computer vision like Roboflow and
deepness. Our objective was to train a Roboflow model that can detect landslide automatically from the satellite images as per diagram. As the process to train models take a long time, we tried to explore with the existing roboflow models like Building segmentation in Deepness. So we came up with a workflow where we can compare the number of buildings which
were present before the landslides as per figures.
Constraints
Using Roboflow to detect landslides from imagery of previous years involves
both time and data constraints. Historical satellite or drone imagery
must be collected, which can be time consuming and often lacks consistency
in resolution, clarity, or geographic coverage. Additionally, the annotation
process for landslide features is labor intensive, especially when dealing with
varied terrains and unclear boundaries in older datasets. Since Roboflow’s training accuracy depends heavily on labeled data, limited or poor-quality archival images can reduce model performance. Processing and training also require time for optimization, especially when tuning models to detect small or partially visible landslides from past events. As the workshop was like a analysis sprint, we then deployed to use the human vision , the manual process of analysing and detecting the Landslided areas from the previous satellite images which we got from google earth and maps.
2021

2022
2023
2024
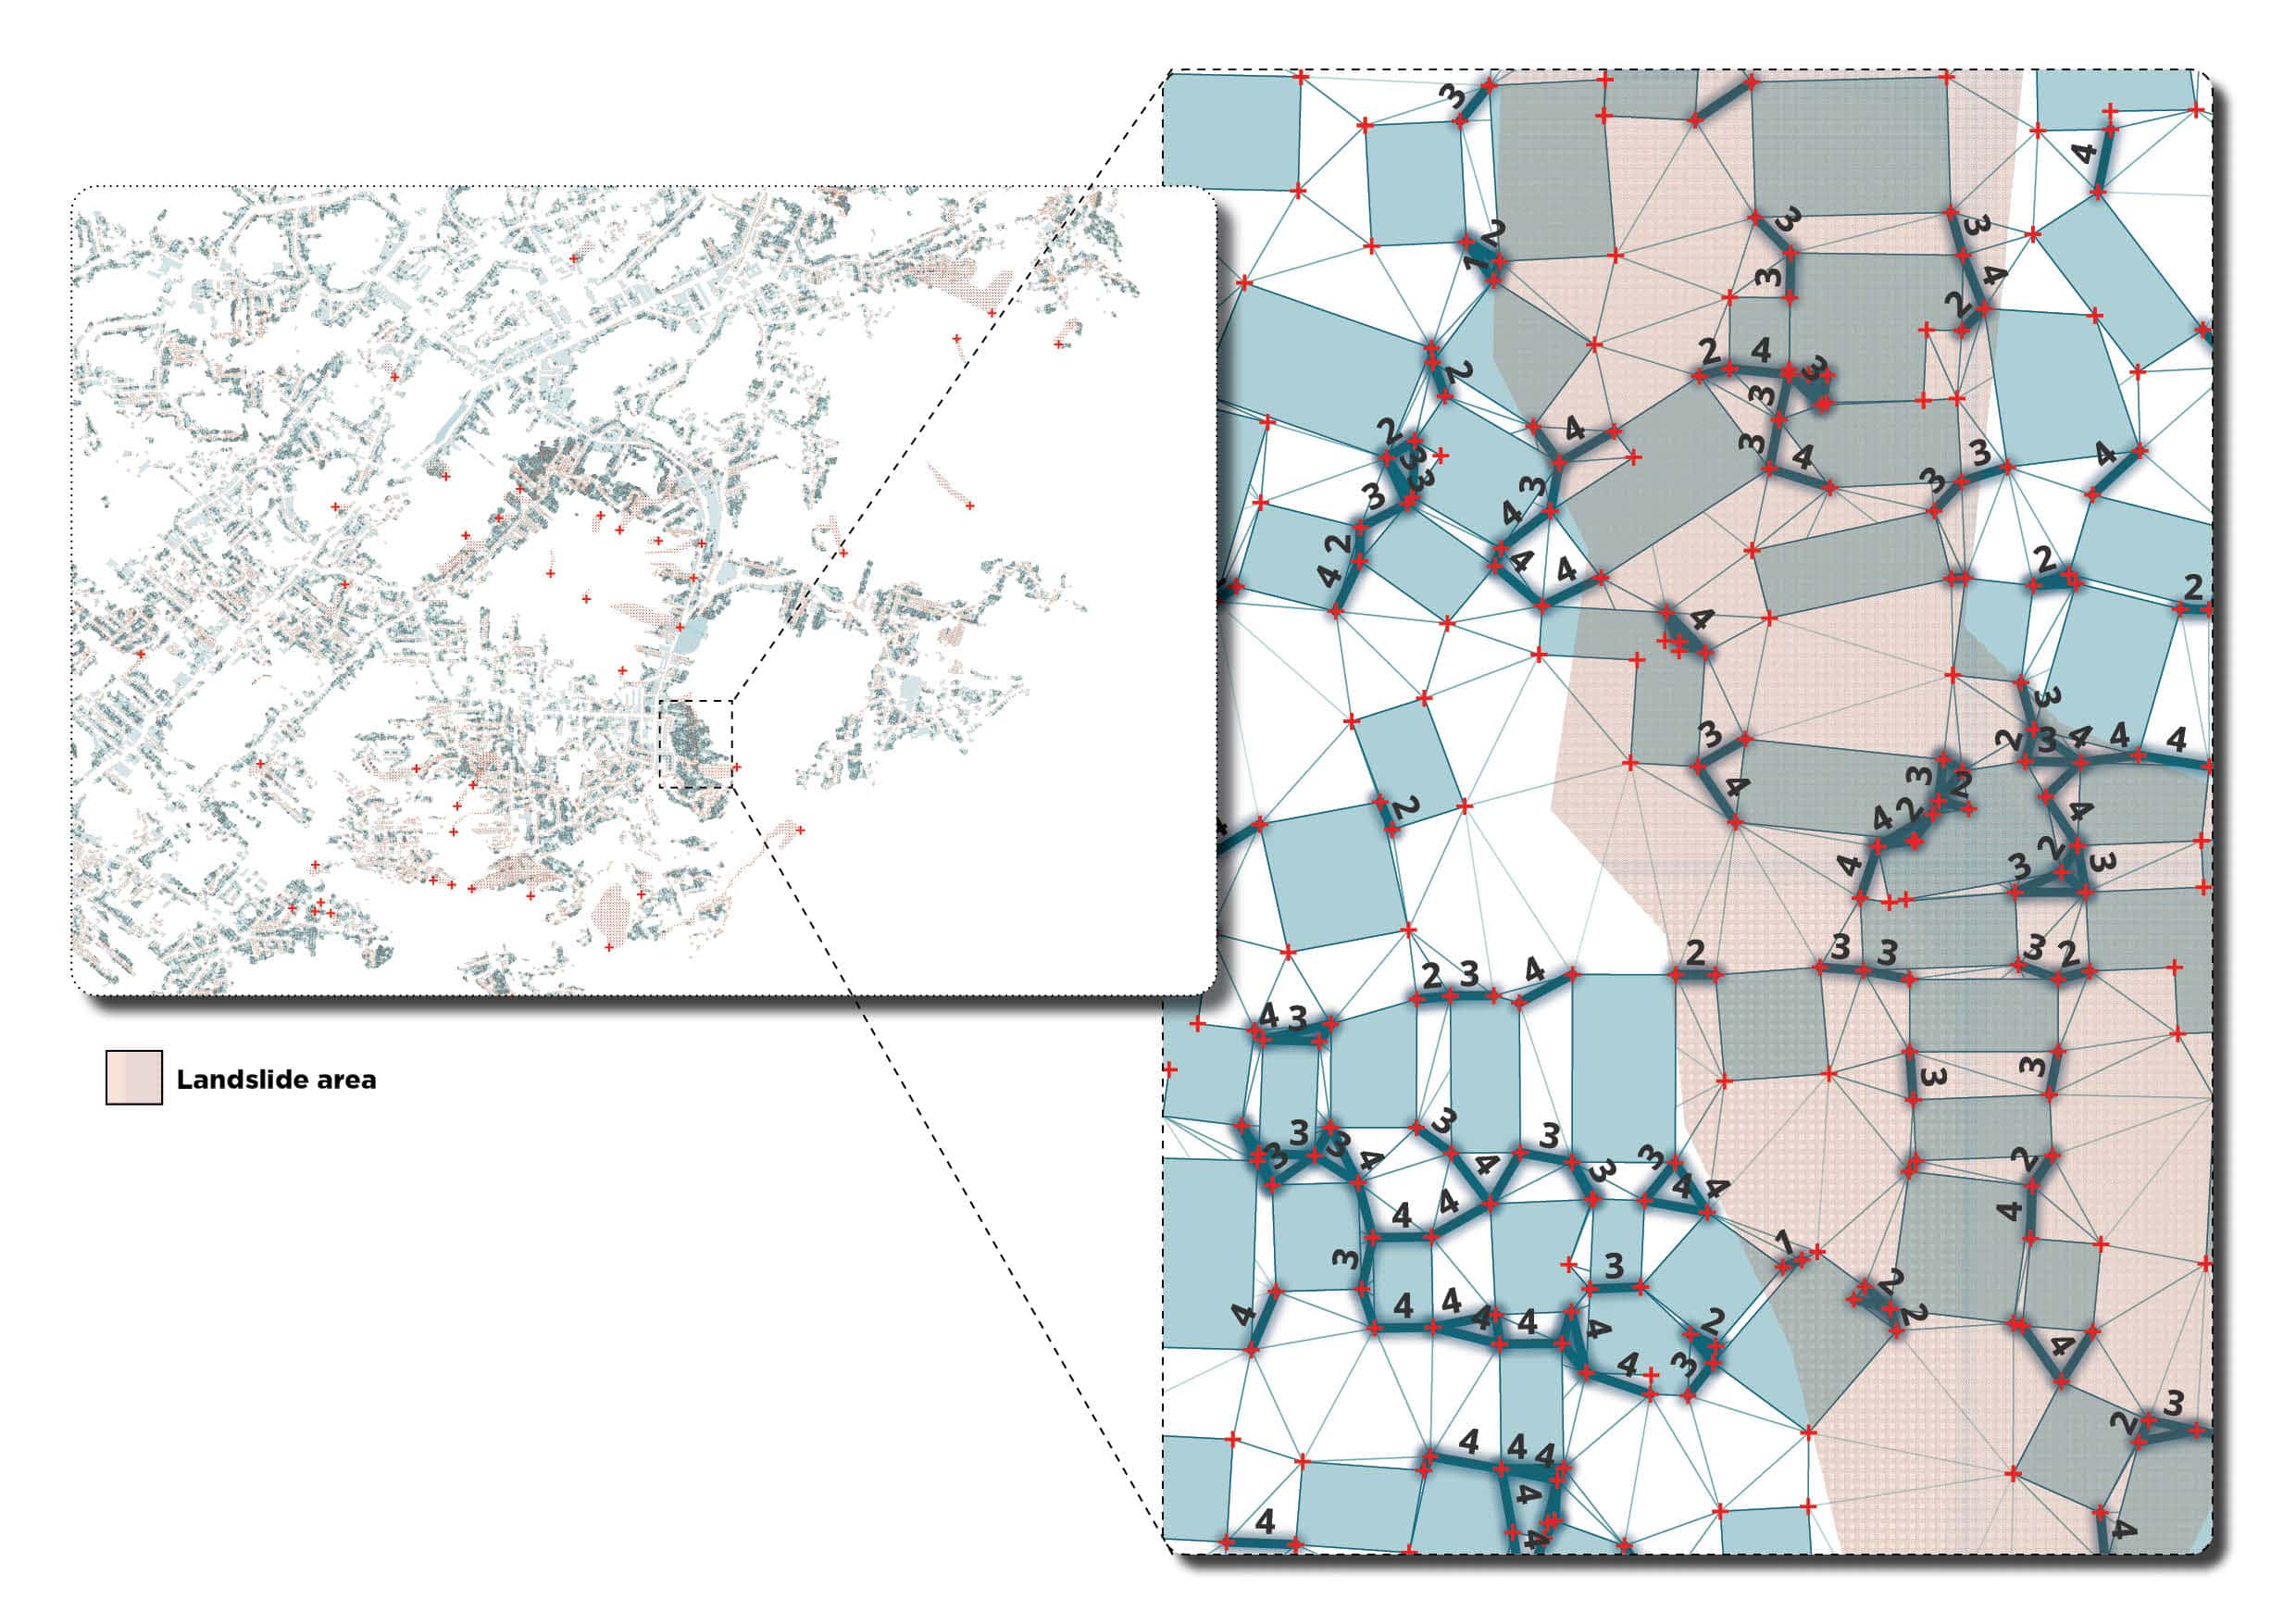
4.1. Distance Between Buildings
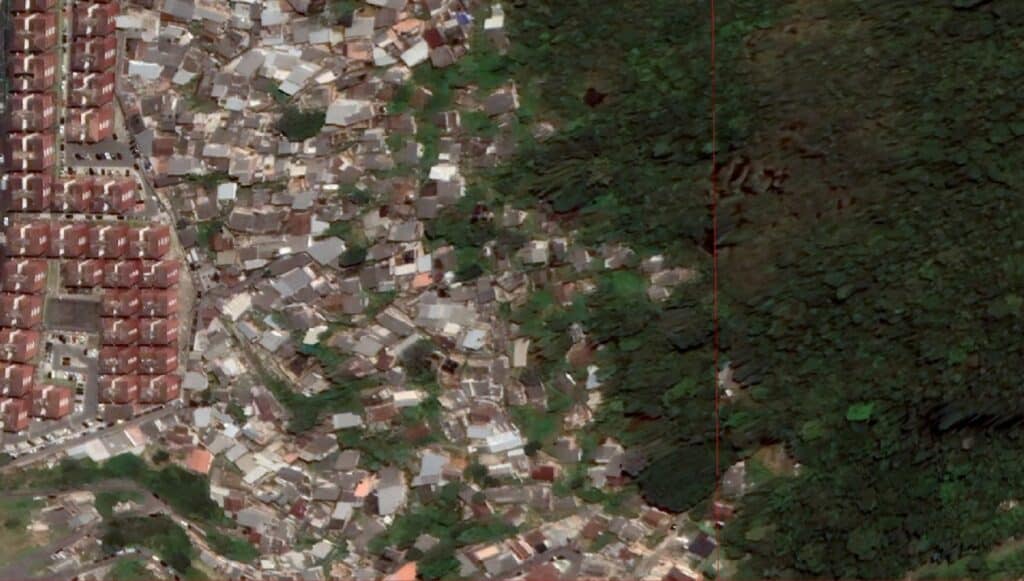
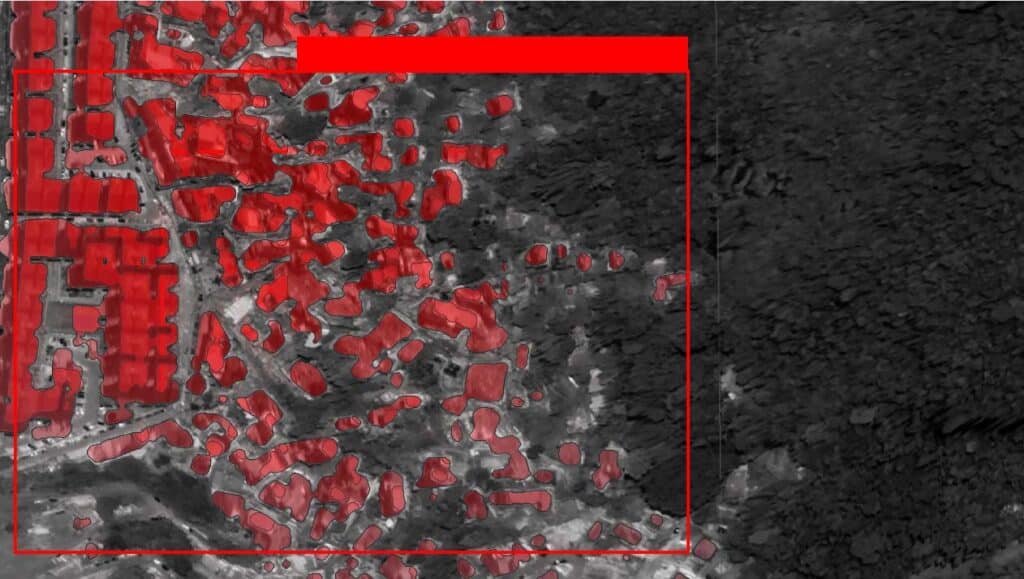
To assess vulnerability in landslide-affected zones, a spatial analysis of the distance between buildings was conducted. The resulting map revealed a dense and irregular urban layout, characteristic of informal settlements. In some areas, buildings are separated by as little as one meter, severely limiting access for evacuation and emergency response, and increasing the risk of structural collapse during extreme weather events.
Notably, some of these densely built areas are located atop sites previously affected by landslides, compounding the risk. To quantify building proximity, Delaunay triangulation was applied to building polygon vertices, creating a network of triangles that accurately measure distances between structures. This method helped identify clusters with extreme proximity, highlighting patterns tied to unregulated urban growth and elevated disaster vulnerability.
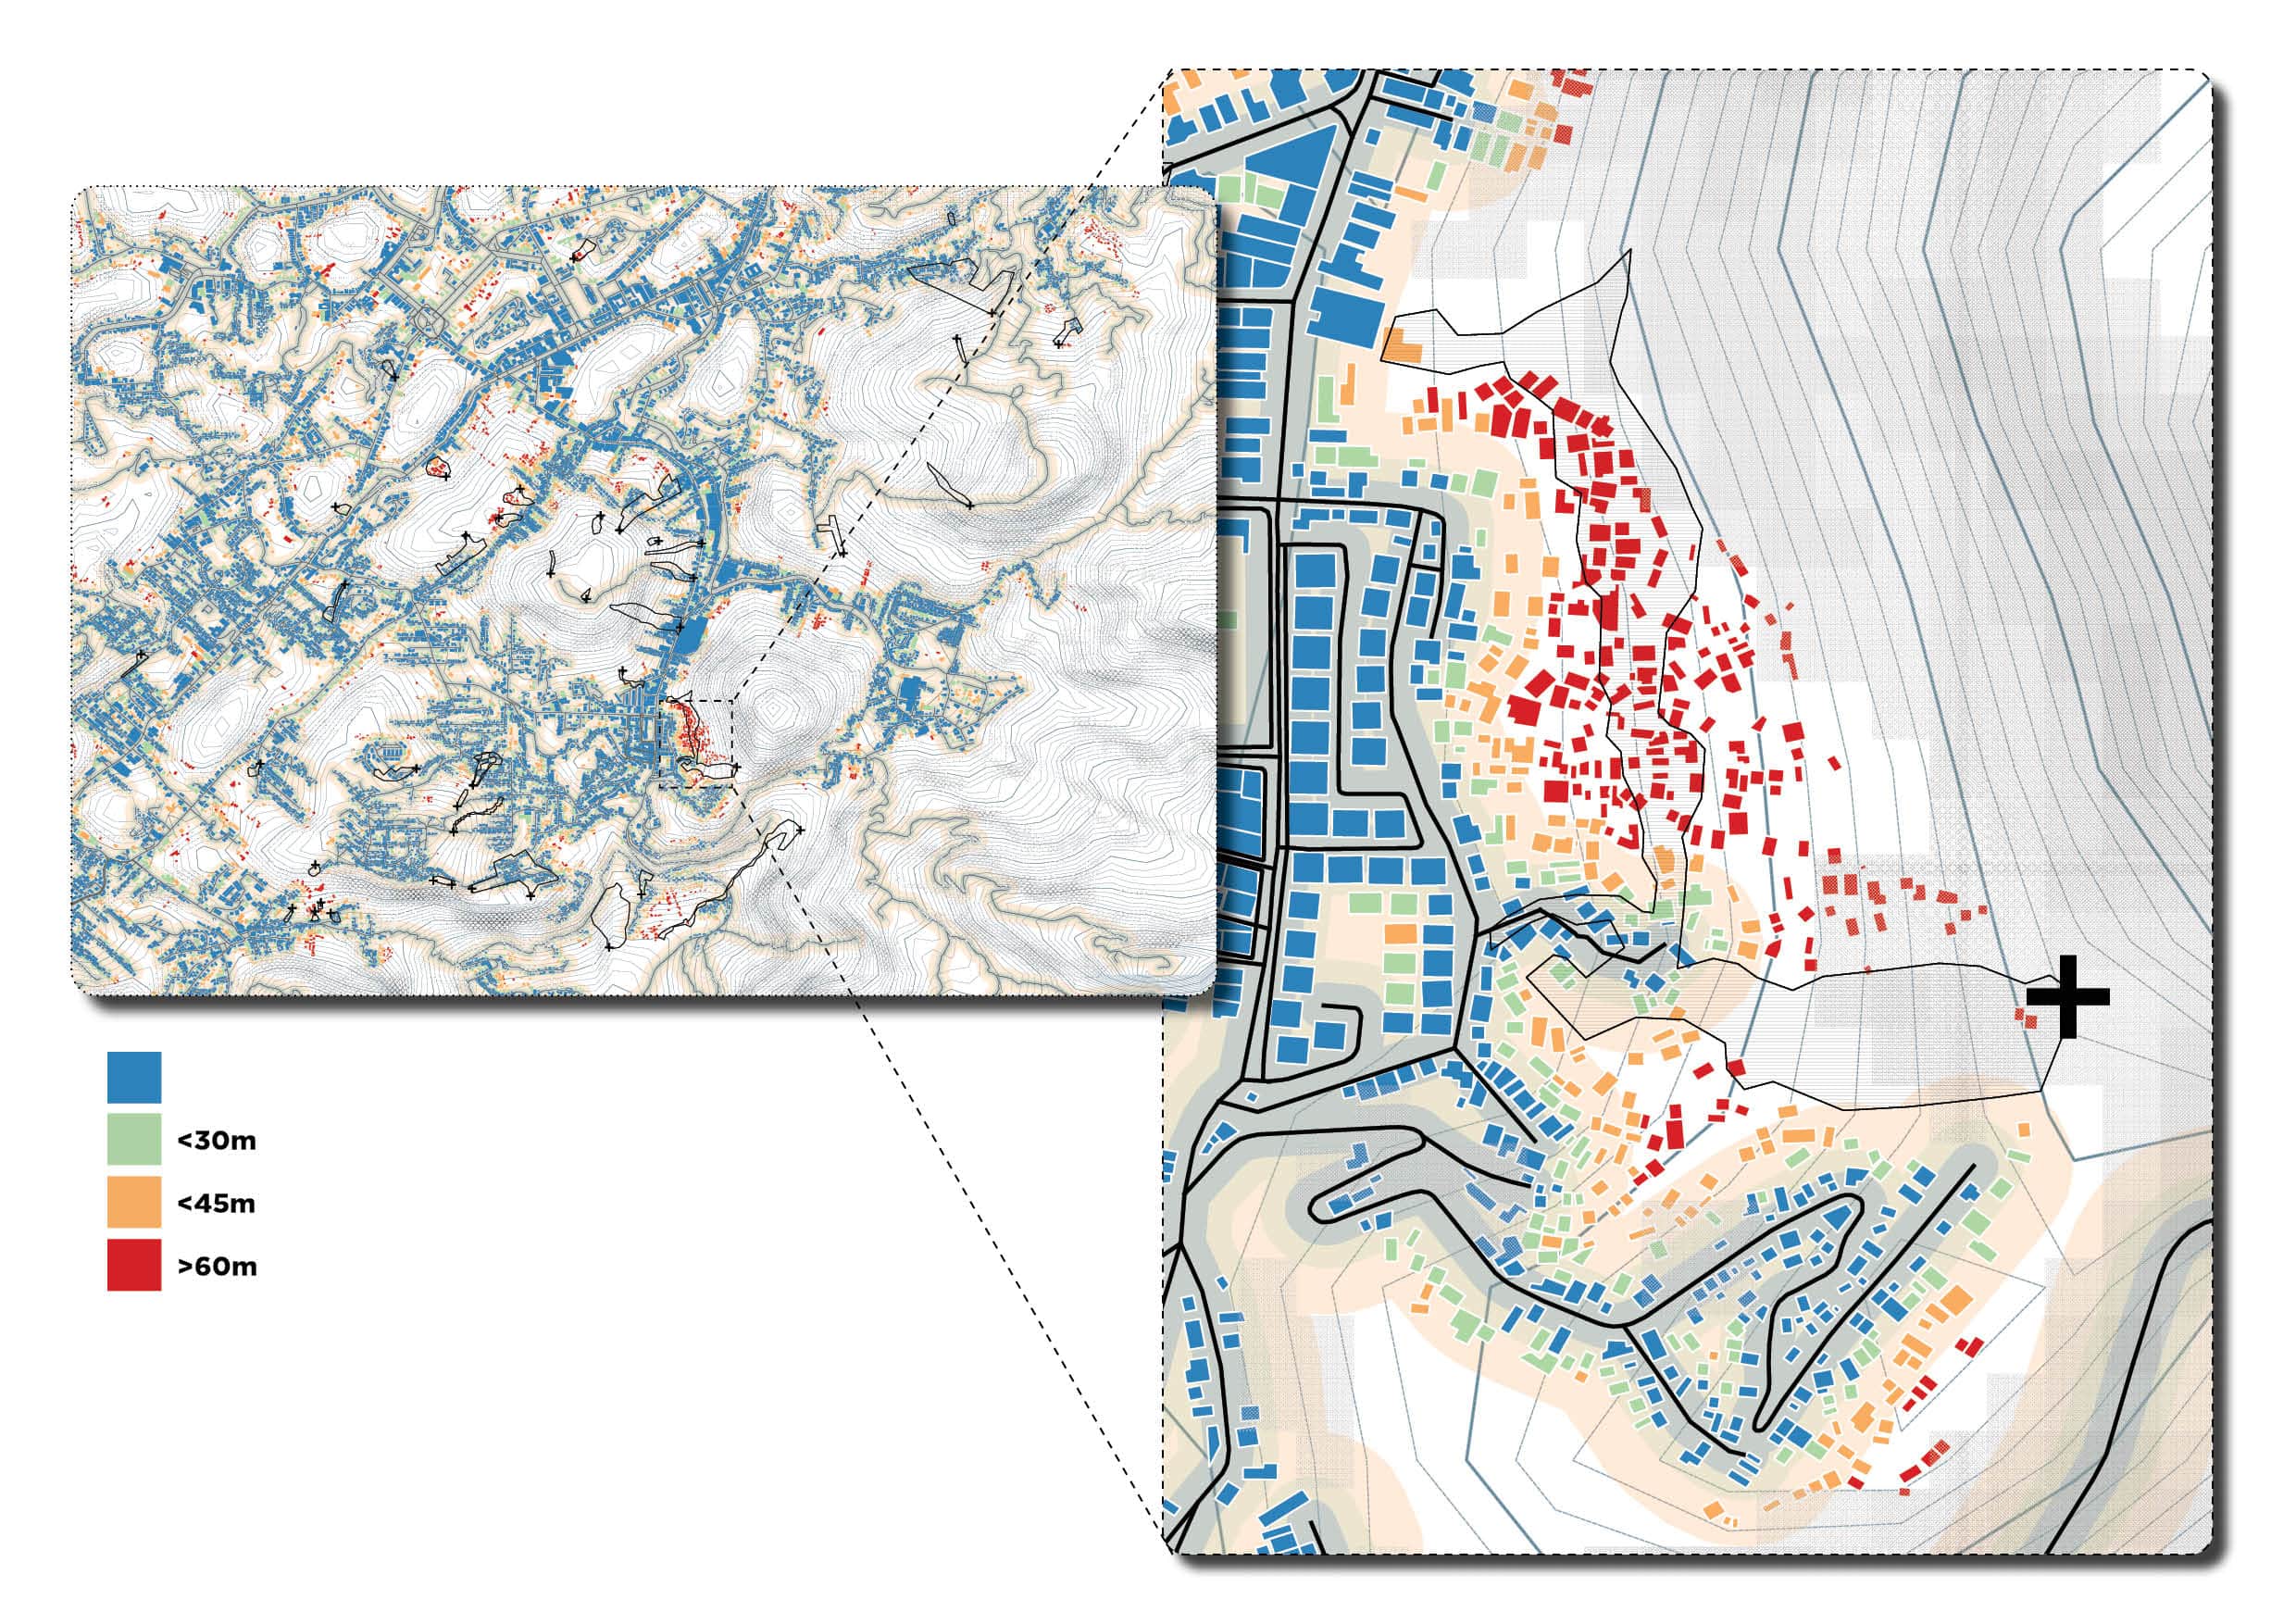
4.2. Building Height
To complement the analysis of density and layout, building heights were examined in landslide-affected areas of Petrópolis. The results show that most incidents occurred where structures are under 10 meters tall—typically low-rise, one- to three-story buildings common in self-built, informal settlements.
While low-rise buildings exert less pressure on unstable slopes compared to high-rises, their vulnerability is evident, there could be many possibilities for this reason: out of date engineering standards, particularly relating to proper anchoring or retaining systems. These deficiencies place the many families and children in peril because of the location of their homes.
The analysis utilized high-resolution data from the Global Human Settlement Layer (GHSL), which maps building heights and settlement characteristics at a 10-meter resolution. This allowed for accurate identification of vertical construction patterns linked to landslide risk and informal urban development.
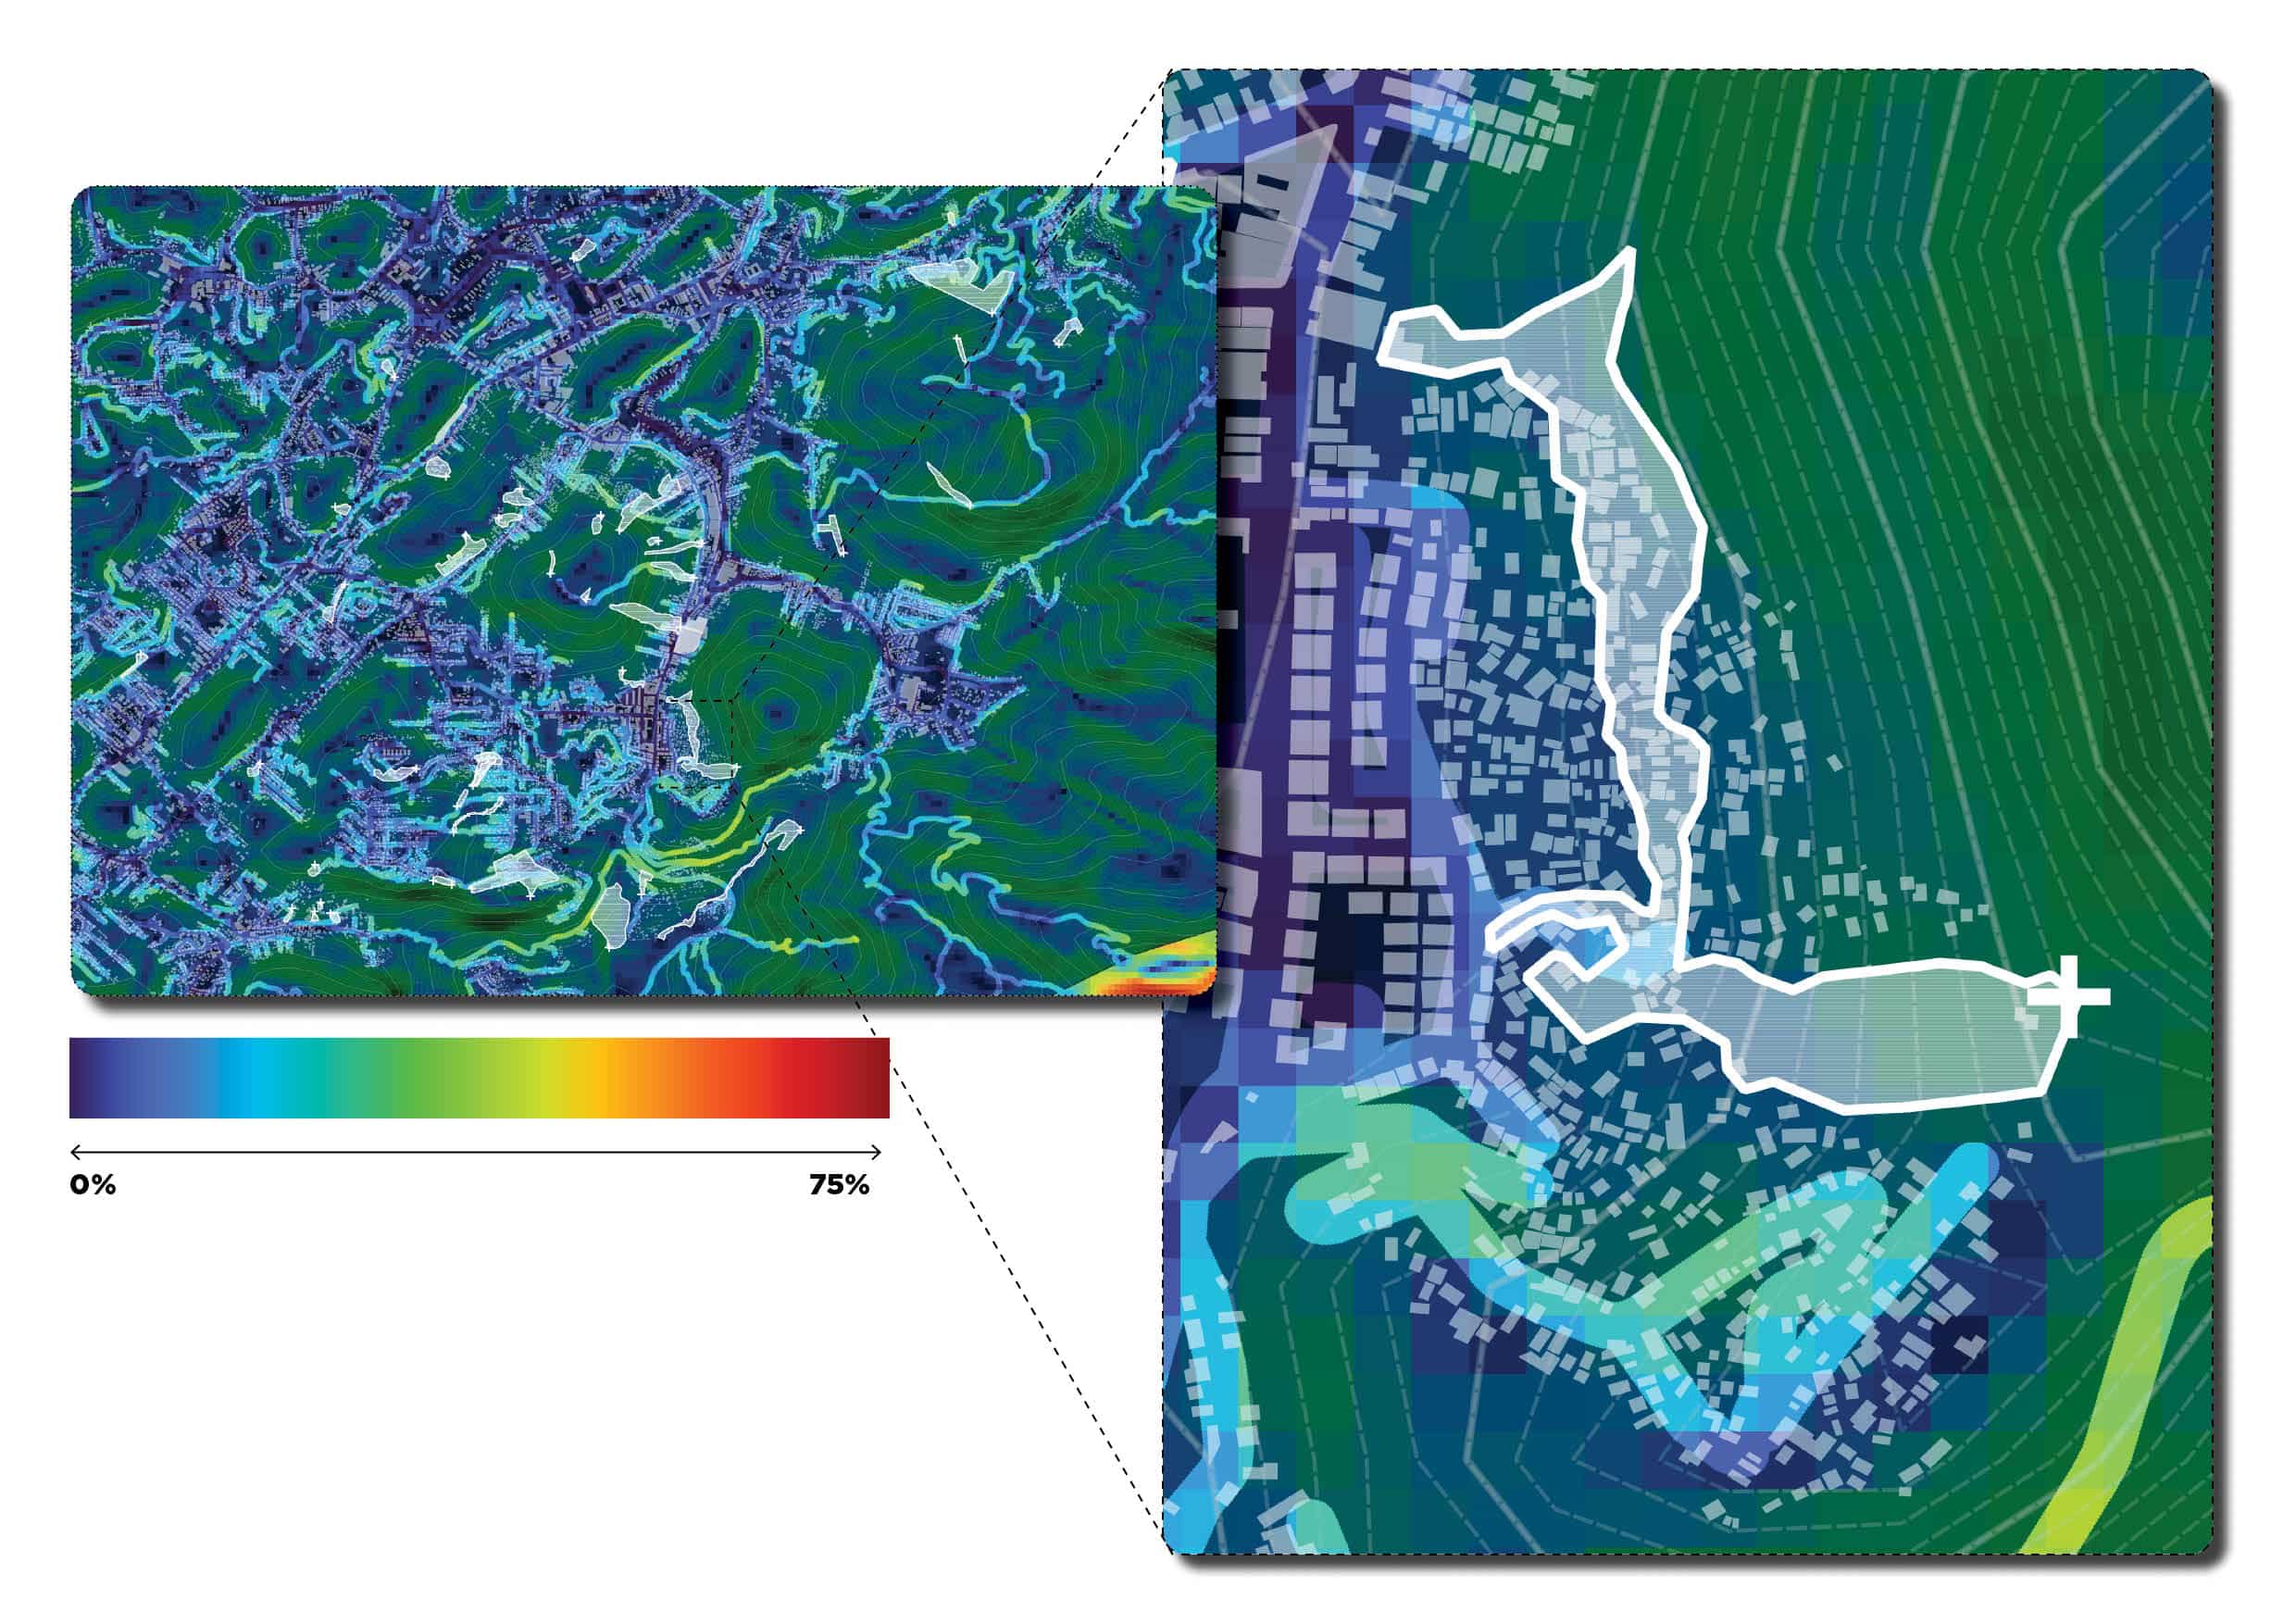
5.3. Distance Between Buildings and Streets
We assessed how the distance between buildings and streets affects both vulnerability and accessibility in landslide-prone areas. Road proximity influences daily access to services and becomes critical for emergency response and evacuation during extreme weather events.
Using Delaunay triangulation, distances from building polygons to the nearest roads were calculated, and buffer zones were created at intervals of 15, 30, 45, 60, and 100 meters from primary and secondary roads.
Findings show that many settlements are located up to 100 meters from the nearest accessible road, often situated on steep slopes. These areas are typically reachable only by footpaths or staircases, reflecting terrain constraints in the lived environment. Such limited access hampers emergency response and complicates the implementation of infrastructure improvements like drainage and slope stabilization.
5.1. Street Slopes
To understand the influence of physical geography on landslide dynamics, the study analyses road steepness within the study area. Steep roads, especially those serving as main transport routes, can intensify the effects of heavy rainfall by channeling surface runoff and increasing erosion, thereby elevating flood and landslide risks.
Road gradient also reflects broader urban patterns. Low-gradient areas tend to have structured layouts with organized street grids, while high-gradient zones are linked to irregular, informal development, often disregarding terrain suitability and increasing hazard vulnerability.
The analysis used a masking technique to isolate steep road segments within buffer zones, highlighting areas most at risk. This spatial overlay provided a clear visual link between steepness, unplanned urban growth, and potential landslide triggers.
5.2. Road Density
The analysis of road density in the study area highlights its impact on flooding risk. Results show that the highest road densities are concentrated in low-lying areas, which are more prone to flooding due to their location in floodplains and the presence of impervious surfaces. These dense road networks hinder natural drainage, leading to increased surface runoff during heavy rainfall.
Beyond contributing to flood vulnerability, road density patterns provide valuable insights for urban planning. High-density areas help identify zones at greater risk, inform the placement of drainage improvements, and suggest the use of permeable materials to reduce runoff.
Additionally, road density mapping supports emergency planning by identifying potential evacuation routes and roads that could serve as channels to redirect water flow. Some streets may already function as informal drainage paths, and recognizing them is key to enhancing flood management. Integrating this analysis with flood modeling enables targeted interventions that support both immediate disaster response and long-term resilience planning.
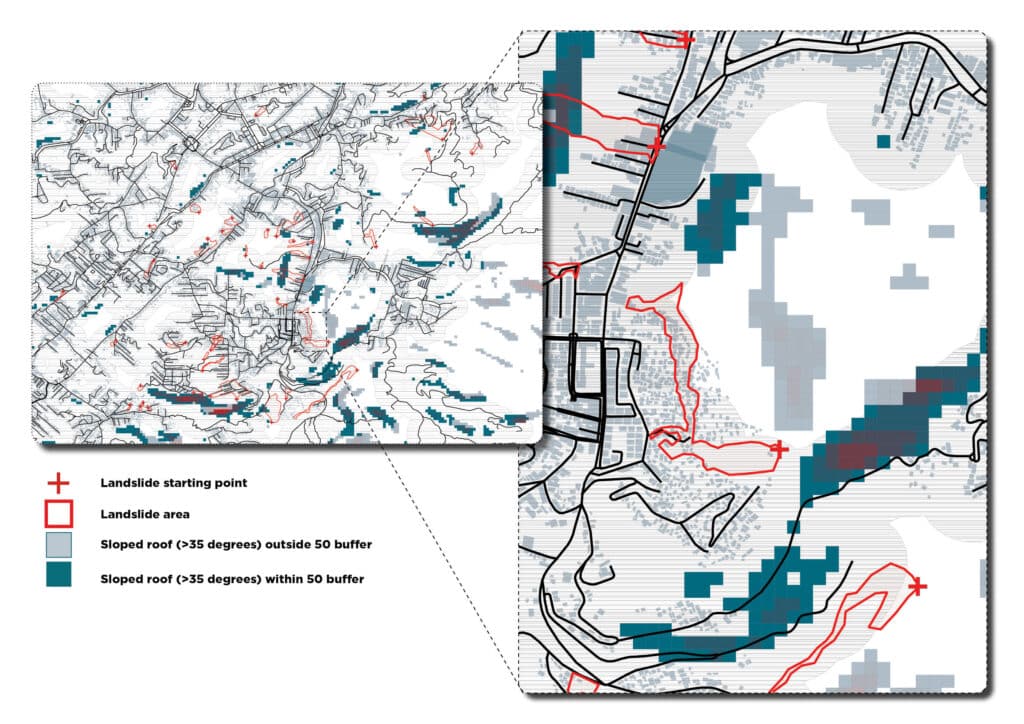
6.1. High-Risk Slopes and Urban Infrastructure
This research aims to assess the vulnerability of urban infrastructure in mountainous areas by analyzing the intersection of steep slopes (over 35 degrees) and proximity to major road networks. Infrastructure in these zones is more prone to landslides, erosion, and related hazards, especially during heavy rainfall or seismic events.
Using Google Earth Engine to extract topographic data, high-risk slope areas were identified and overlapped with GIS-generated buffer zones (10–50 meters) around transportation corridors. Building and road data were sourced from local government portals to evaluate infrastructure exposure.
The resulting map highlights disorganized urban development in steep zones, revealing critical gaps in planning. It emphasizes the urgent need for improved road and drainage infrastructure in high-slope areas to mitigate risks and better guide future settlement planning.
Case Studies of Success
6.2. Medellín and the Challenge of Urban Flooding
Medellín’s geography, a narrow valley surrounded by steep mountains, makes it highly vulnerable to flooding, landslides, and flash floods. Rapid runoff from the hills frequently overwhelms urban infrastructure, especially during the city’s rainy seasons in April–May and September–October.
In early 2025 alone, Medellín reported 374 rain-related emergencies, affecting over 733 families. To address these risks, the city uses SAMA, an early warning system monitoring 32 watersheds with 118 instruments, providing real-time data on rainfall, river flow, temperature, wind, and humidity. When abnormalities are detected, the system automatically activates alarms and alerts local communities, who receive training on how to respond to emergency signals.
Local authorities have conducted over 500 risk inspections this year, issuing 170 evacuation recommendations. Medellín also focuses on prevention, encouraging citizens to prepare emergency kits, secure homes, and avoid high-risk areas during storms. Efforts include regulating informal construction in hazard zones through technical guidance rather than punitive action.
Infrastructure improvements are also underway, with universities developing sustainable drainage systems using permeable, prefabricated channels. Additionally, citizen participation is promoted through reporting clogged drains, improving maintenance and response times.
Despite ongoing challenges, Medellín’s integrated strategy—combining technology, education, infrastructure, and community engagement—is helping build urban resilience against climate-related hazards.