1 — Project Overview
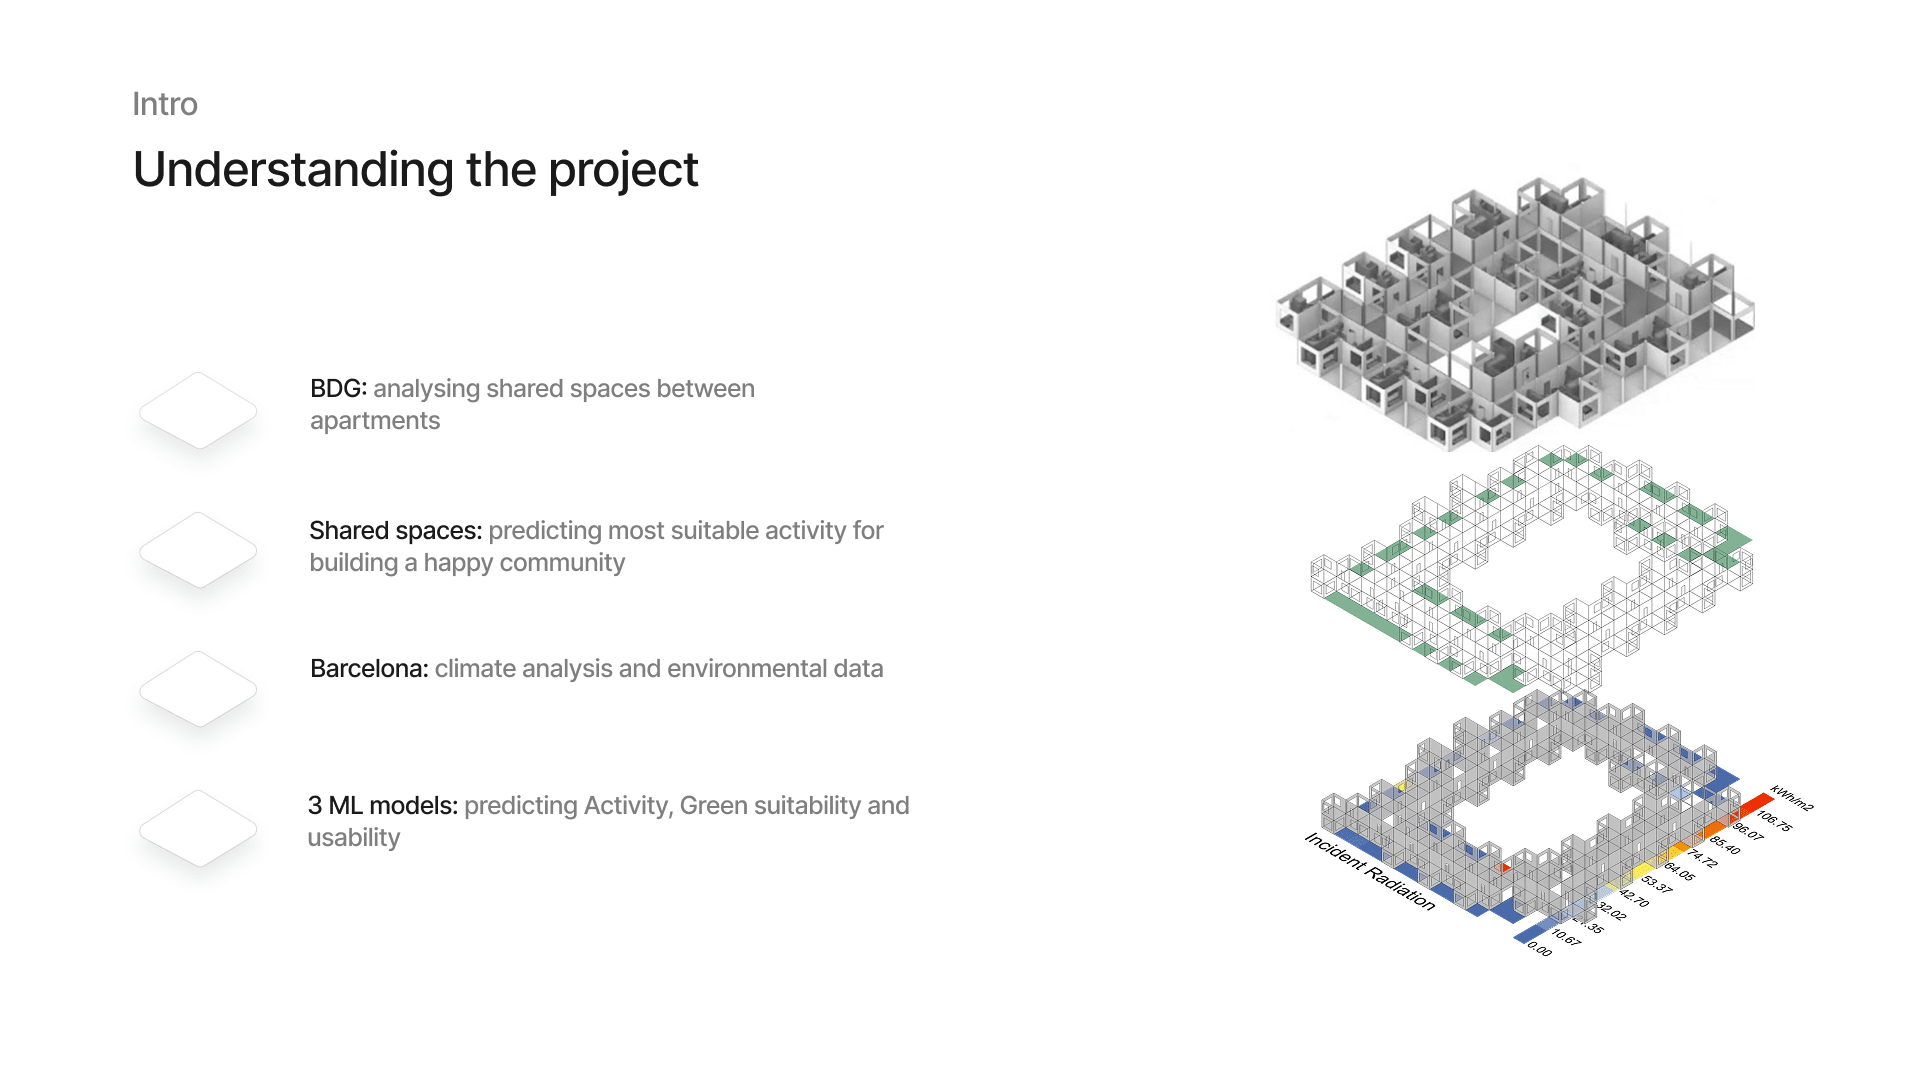
Our project is based on the building geometry model that is provided with three apartment types and spaces in between them. We chose to focus on the shared spaces: the courtyards, terraces, and balconies. The building is located in Barcelona, so we rely on fixed environmental conditions and don’t re-run simulations. We aim to predict the most suitable activities, green suitability, and general usability level for each space.
2 — The Goal
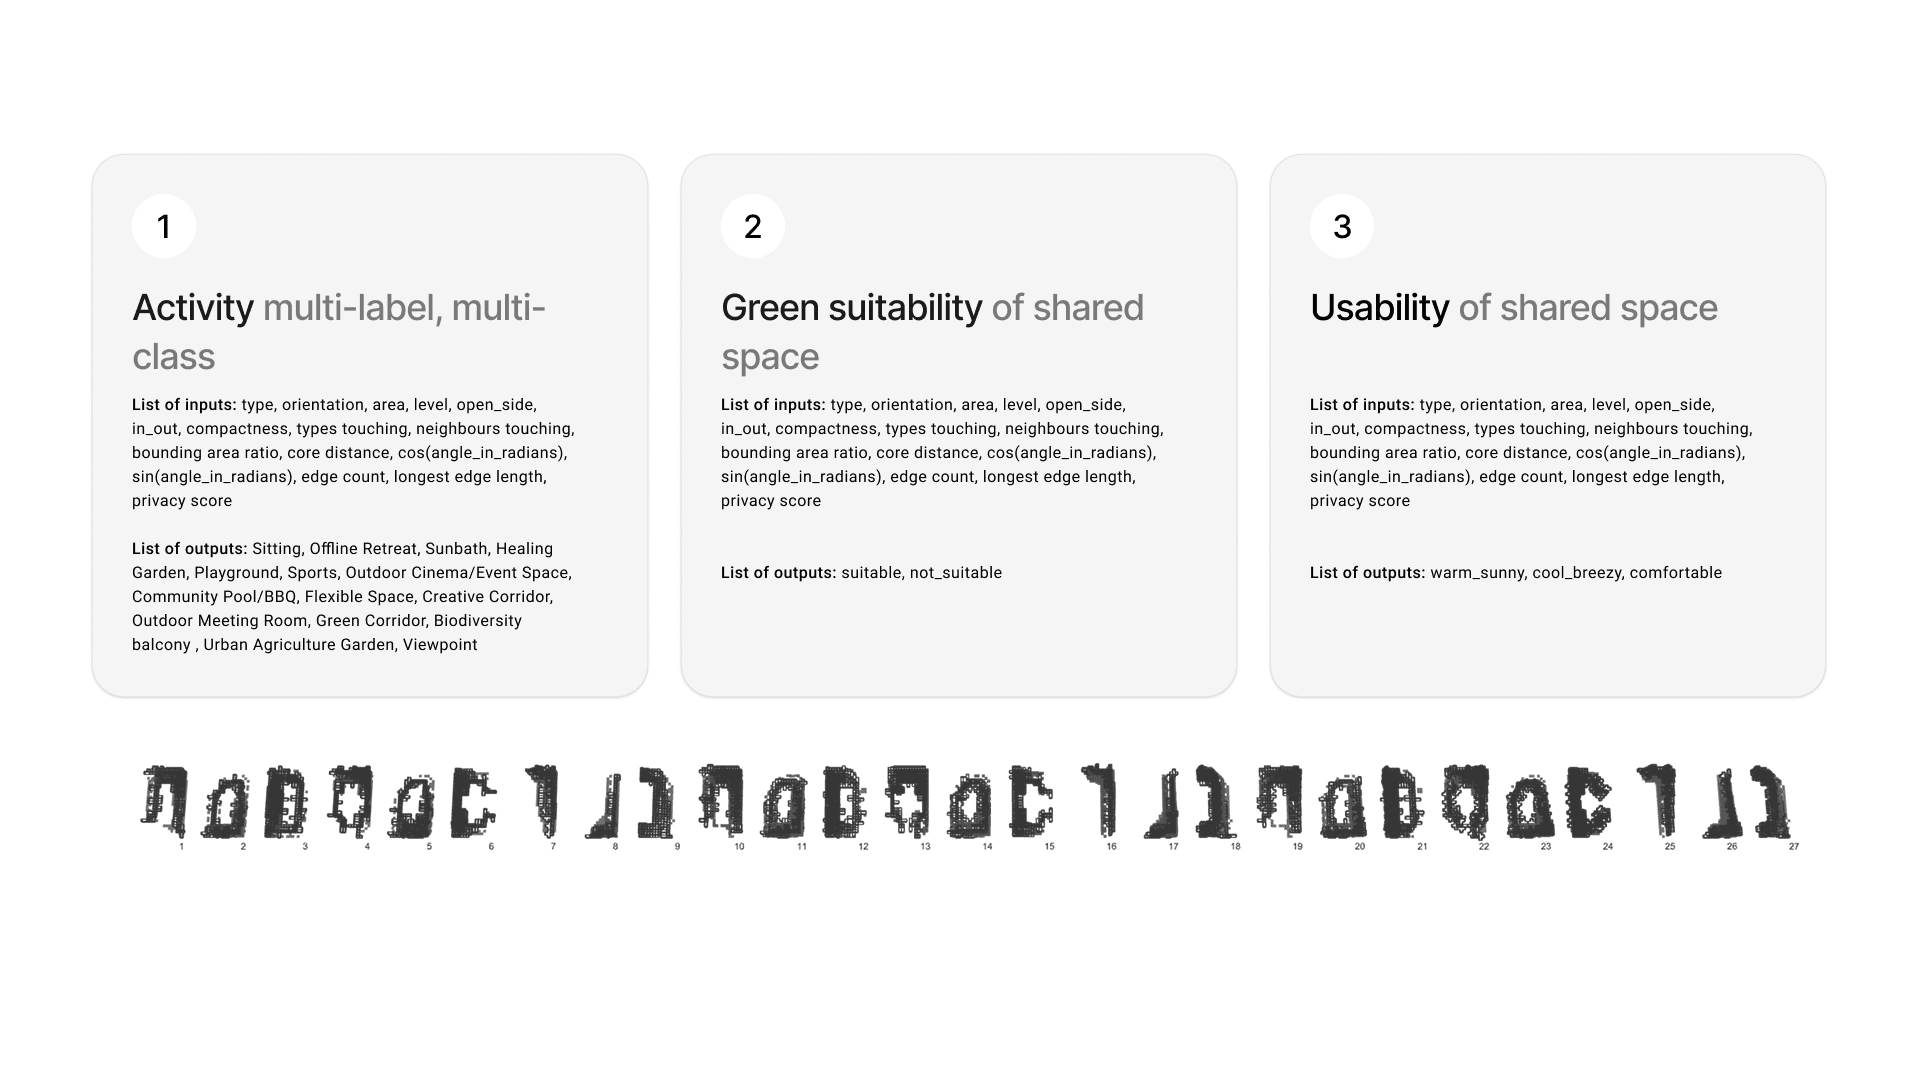
We use the same set of geometric features across all models. Those are features like: type, orientation, area, level, compactness etc. Activity is predicted using multi-label, multi-class classification so each space can have a unique combination of possible activities. Some of which are Sitting, Sunbath, Healing Garden, Playground… Green suitability and usability are simpler, each producing a single value per space: suitable or not_suitable and warm_sunny, cool_breezy, comfortable.
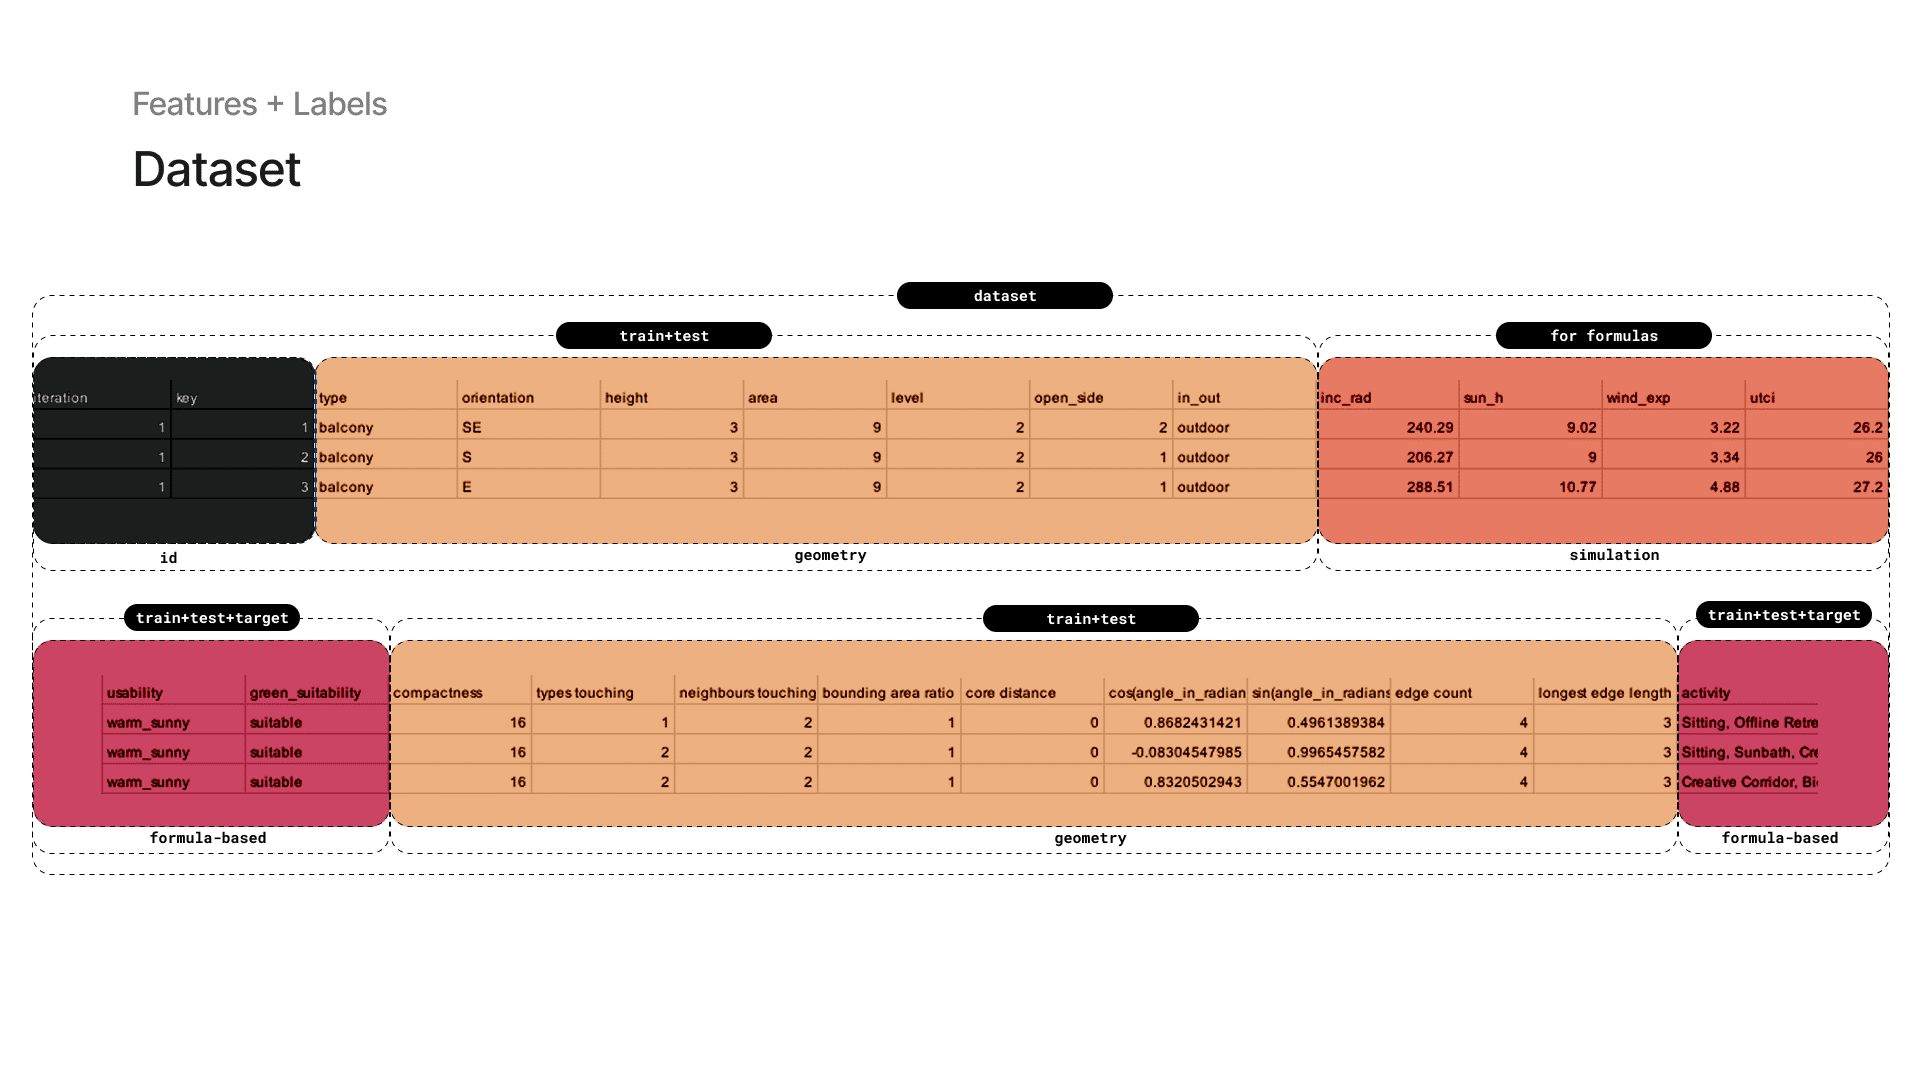
3 — Dataset Input: Geometry
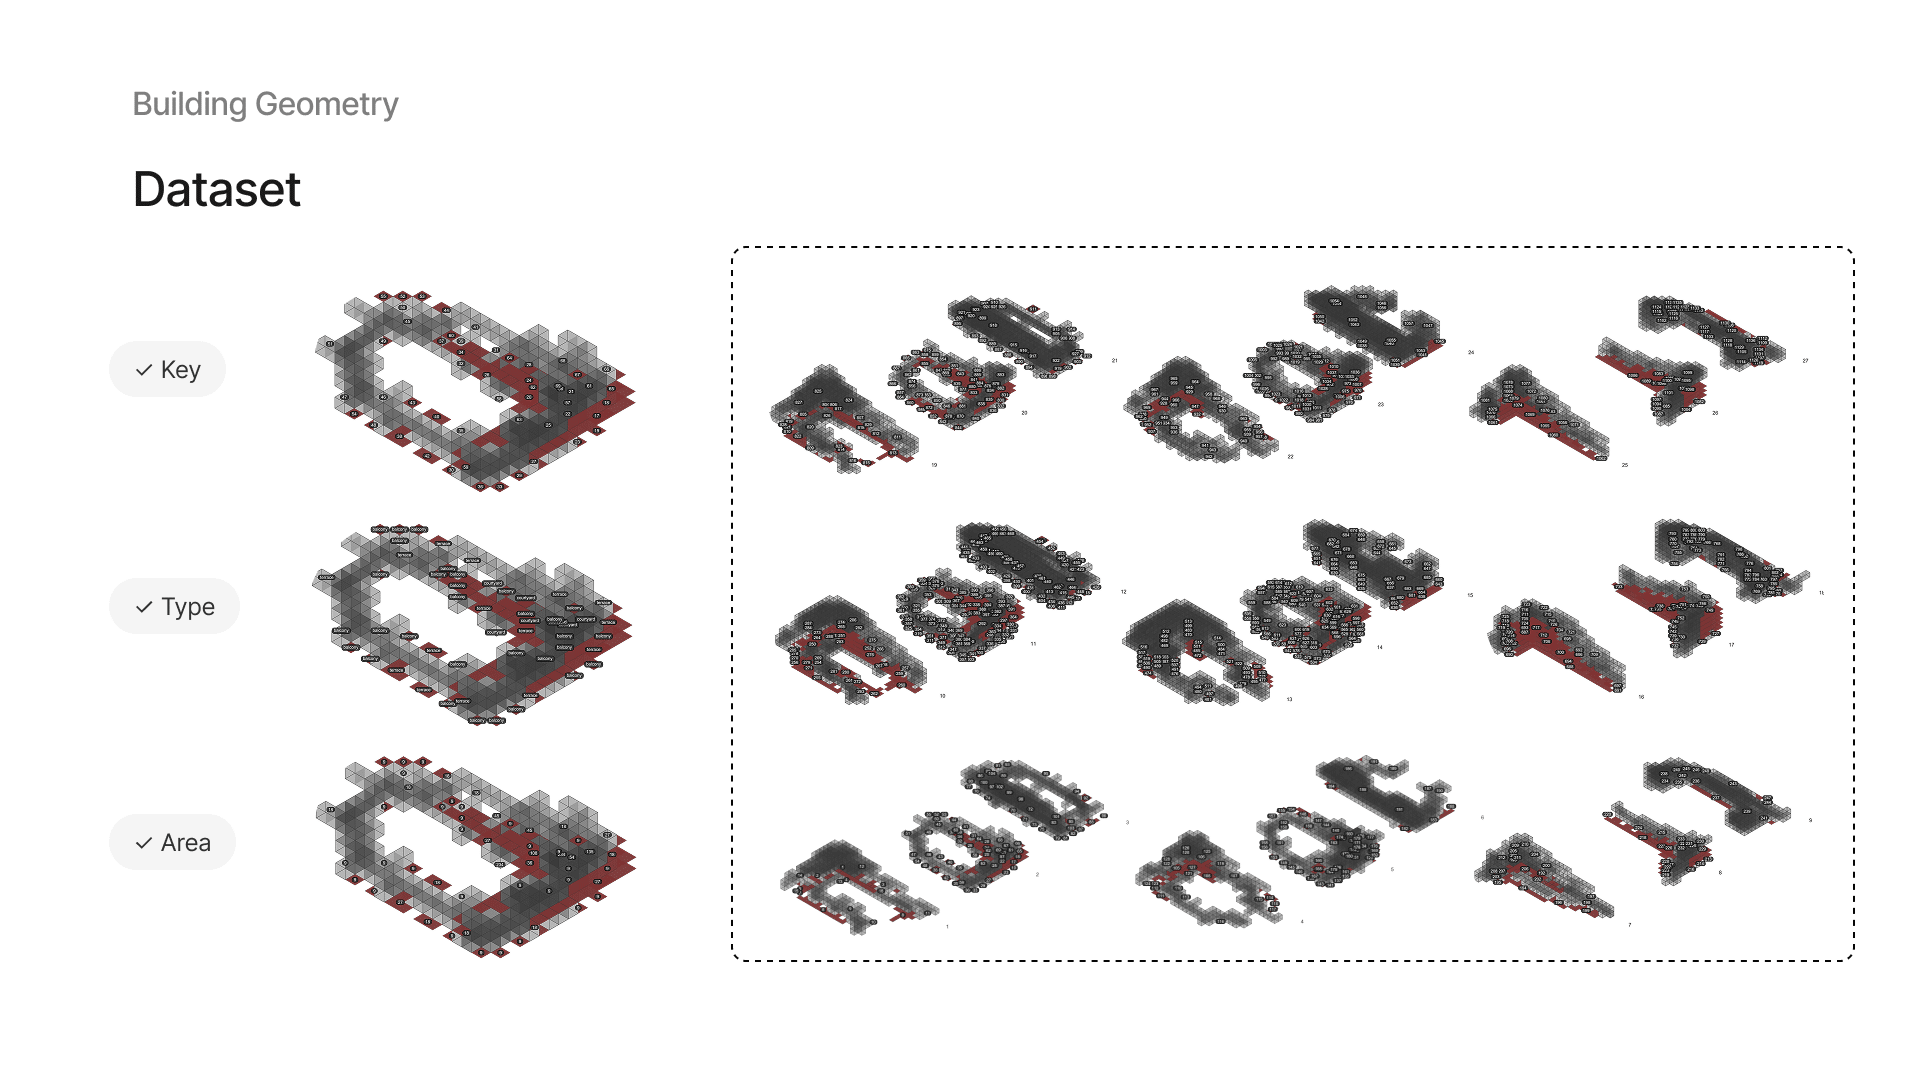
The dataset is composed of: IDs for each building iteration and space key, geometric features used for training and testing, simulation-based environmental data
and three ground truth values generated from formulas in Grasshopper: activity, green suitability, and usability. In Grasshopper, we visualize the dataset entry on the model: each building is numbered by iteration and spaces by key.
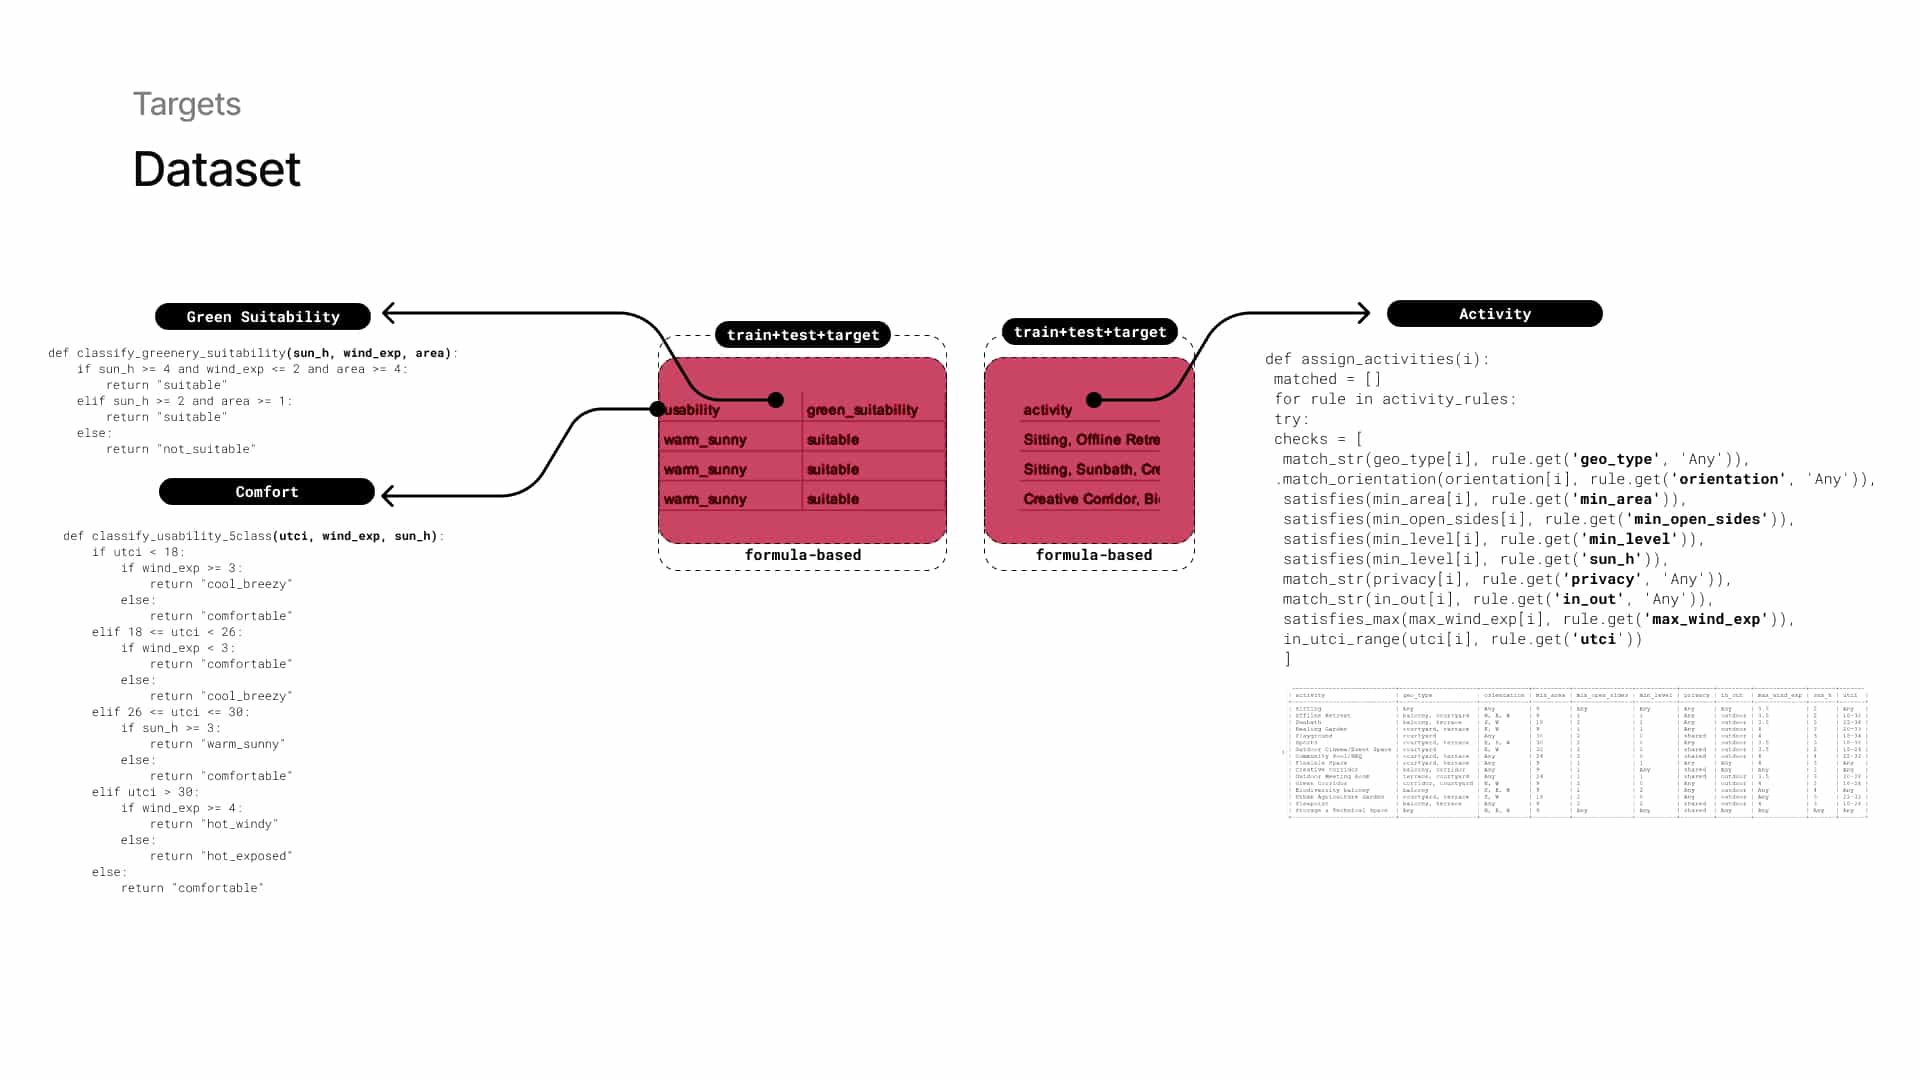
4 — Dataset Input: Simulations and Rules
Dataset values are displayed directly on the geometry for inspection or validation. Our ground truth values are generated inside Grasshopper using custom formulas that combine geometric and environmental inputs.
The key here is that the model does not use the exact same inputs during training, forcing it to learn and generalize beyond the formulas.
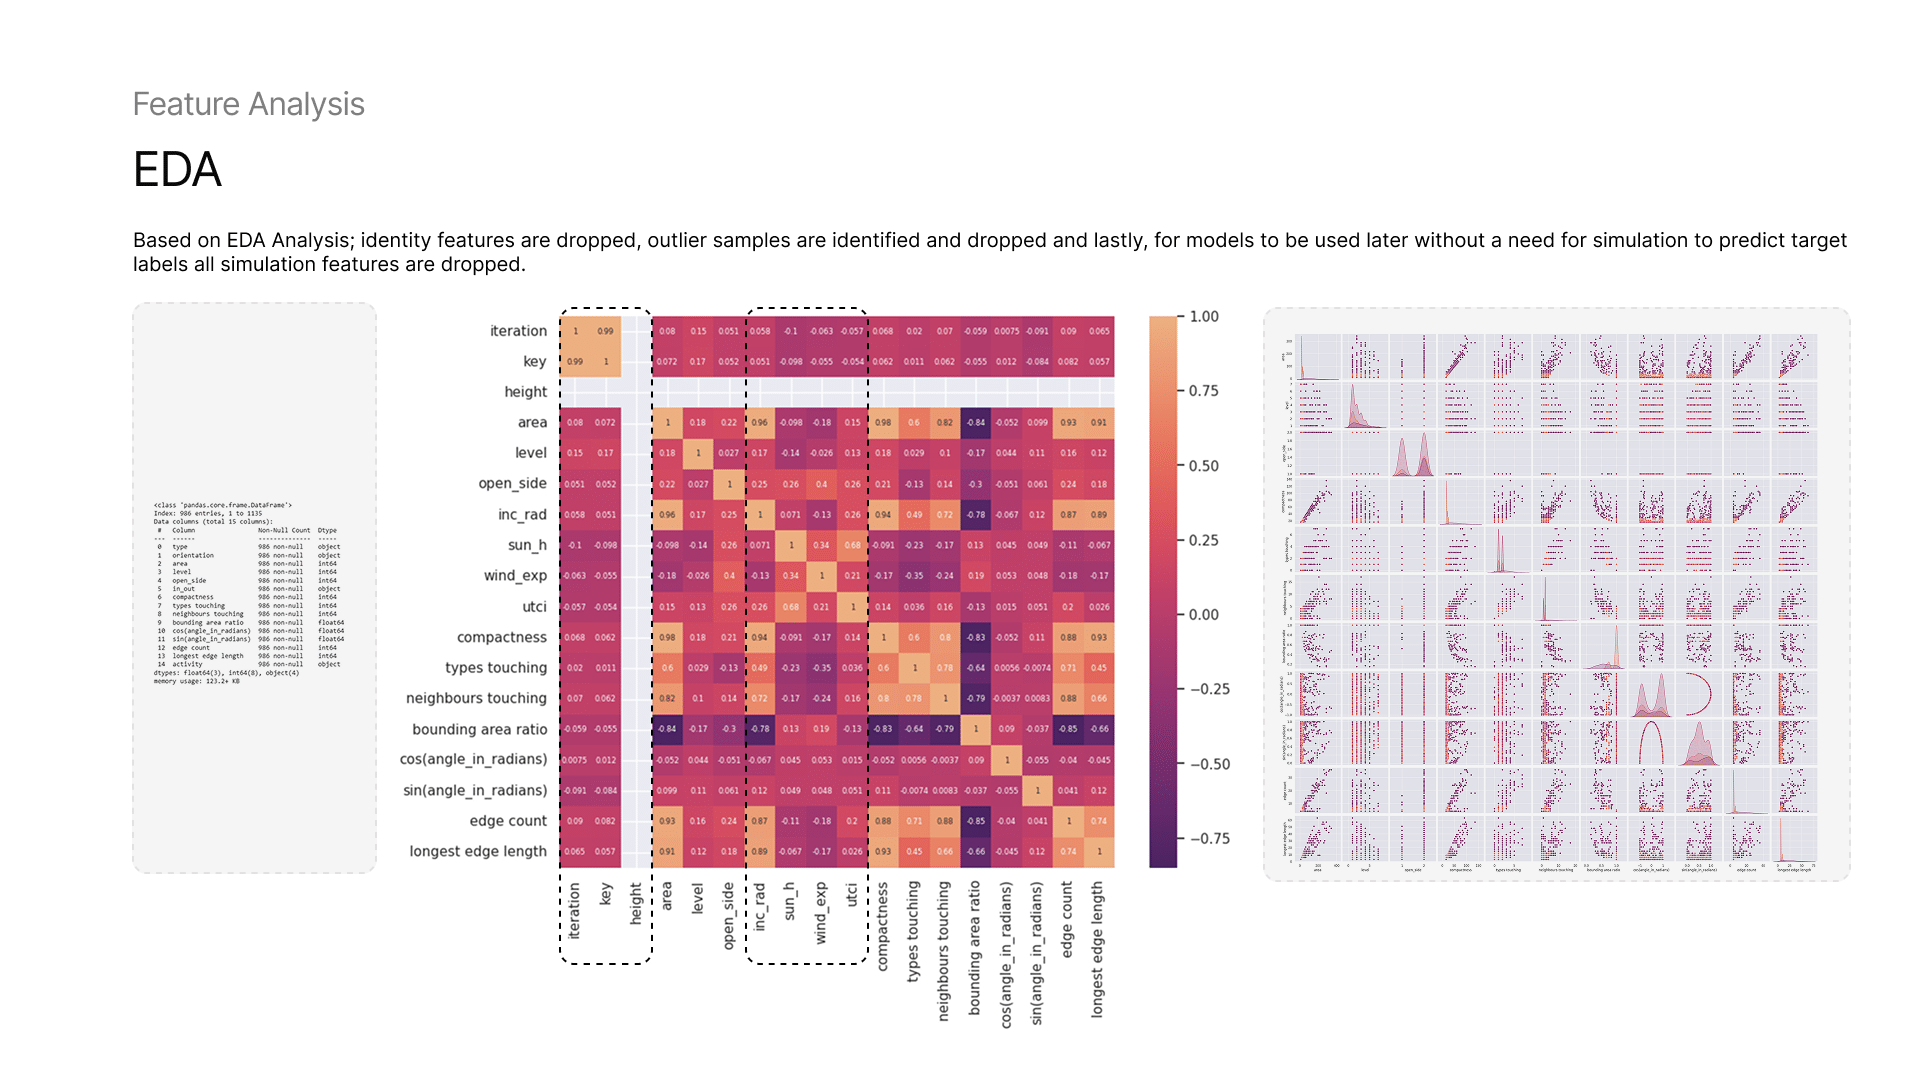
5 — Dataset Analysis : Features and Data Points
We ran both feature distribution and correlation analysis to identify redundant or strongly related features as well as the outliers. Some of the boundary-related and simulation-based features that showed correlation and were marked for potential removal.
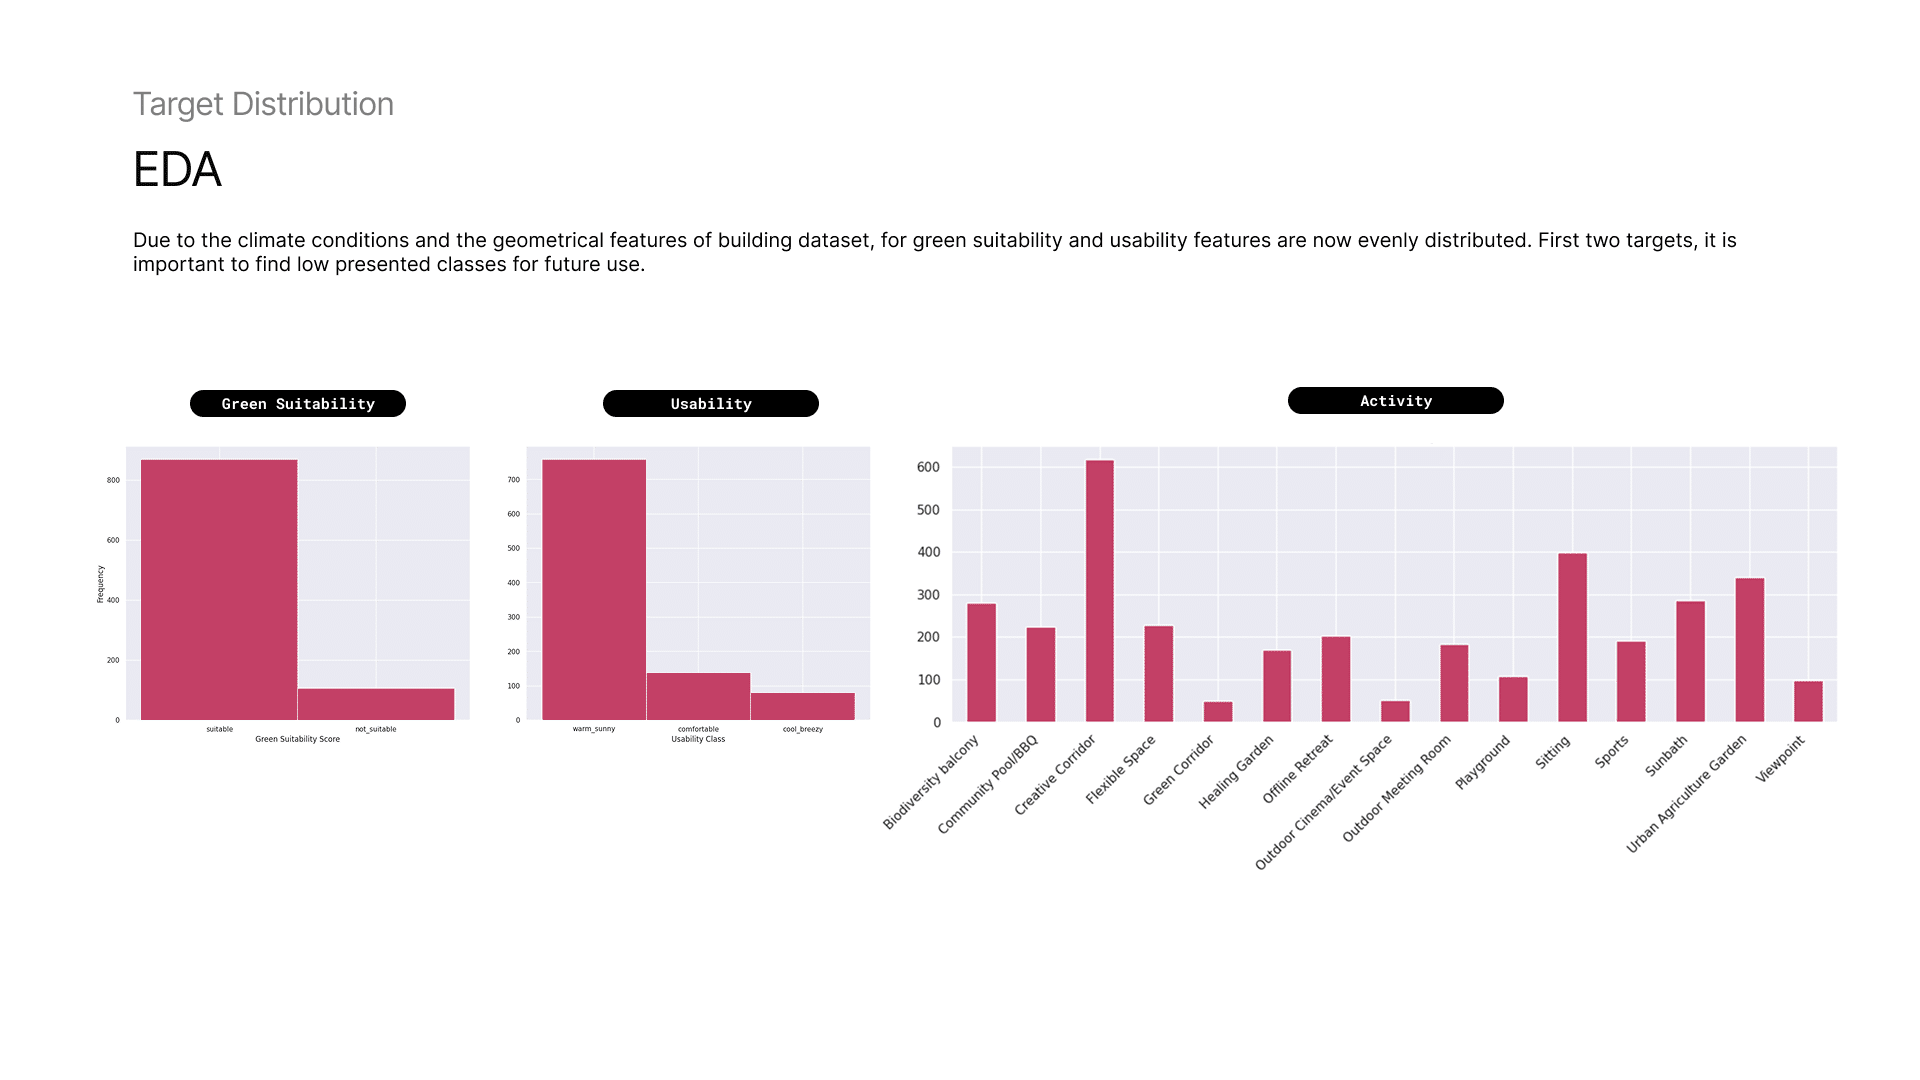
6 — Dataset Analysis: Distributions
Due to the climate conditions and the geometrical features of building dataset, for green suitability and usability features are not evenly distributed. First two targets, it is important to find low presented classes for future use.
Shallow Learning Algorithms : Multiclass Single-label Predictions
Target: Green Suitability + Usability
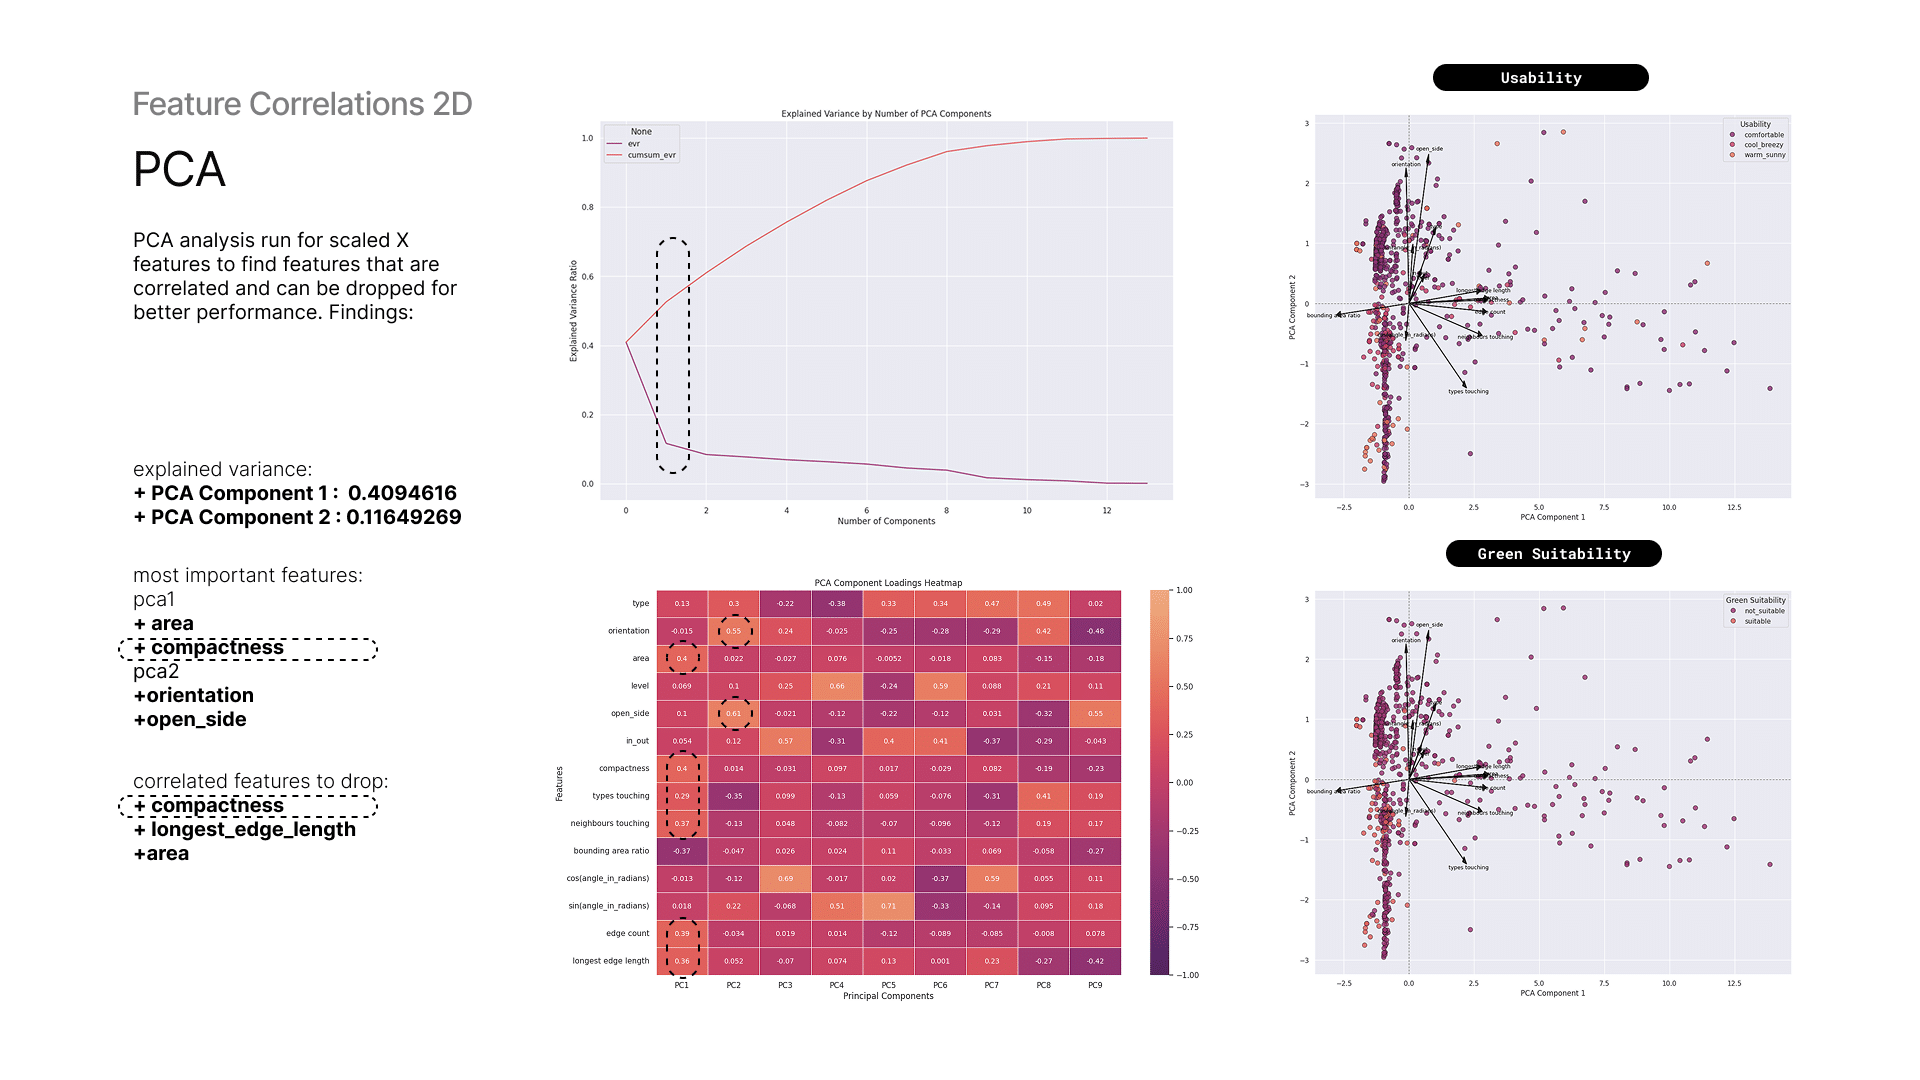
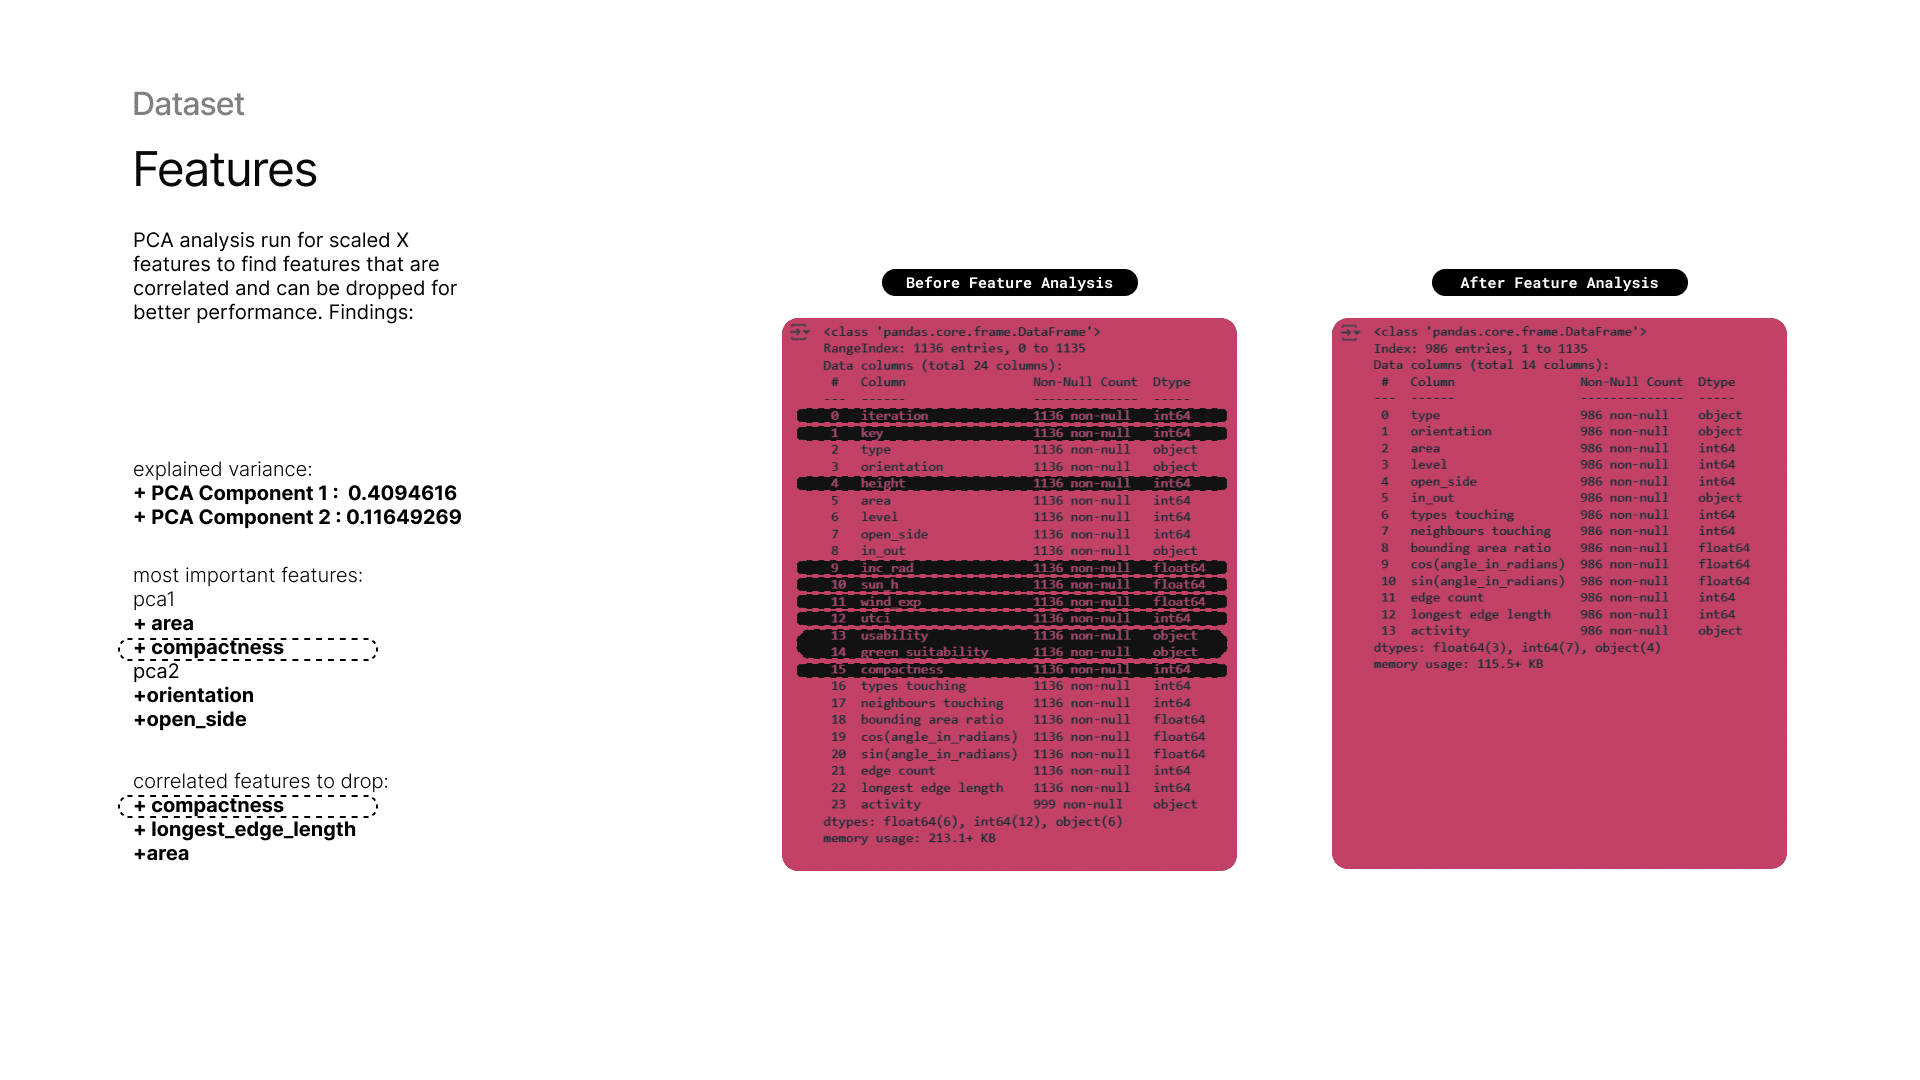
7 — PCA Analysis and Data Points
To capture the most variance in the input features, Principal Component Analysis (PCA) was conducted to identify correlations and relationships among them. Compactness, orientation, and open side show a strong influence on the principal components and some of them are correlated.
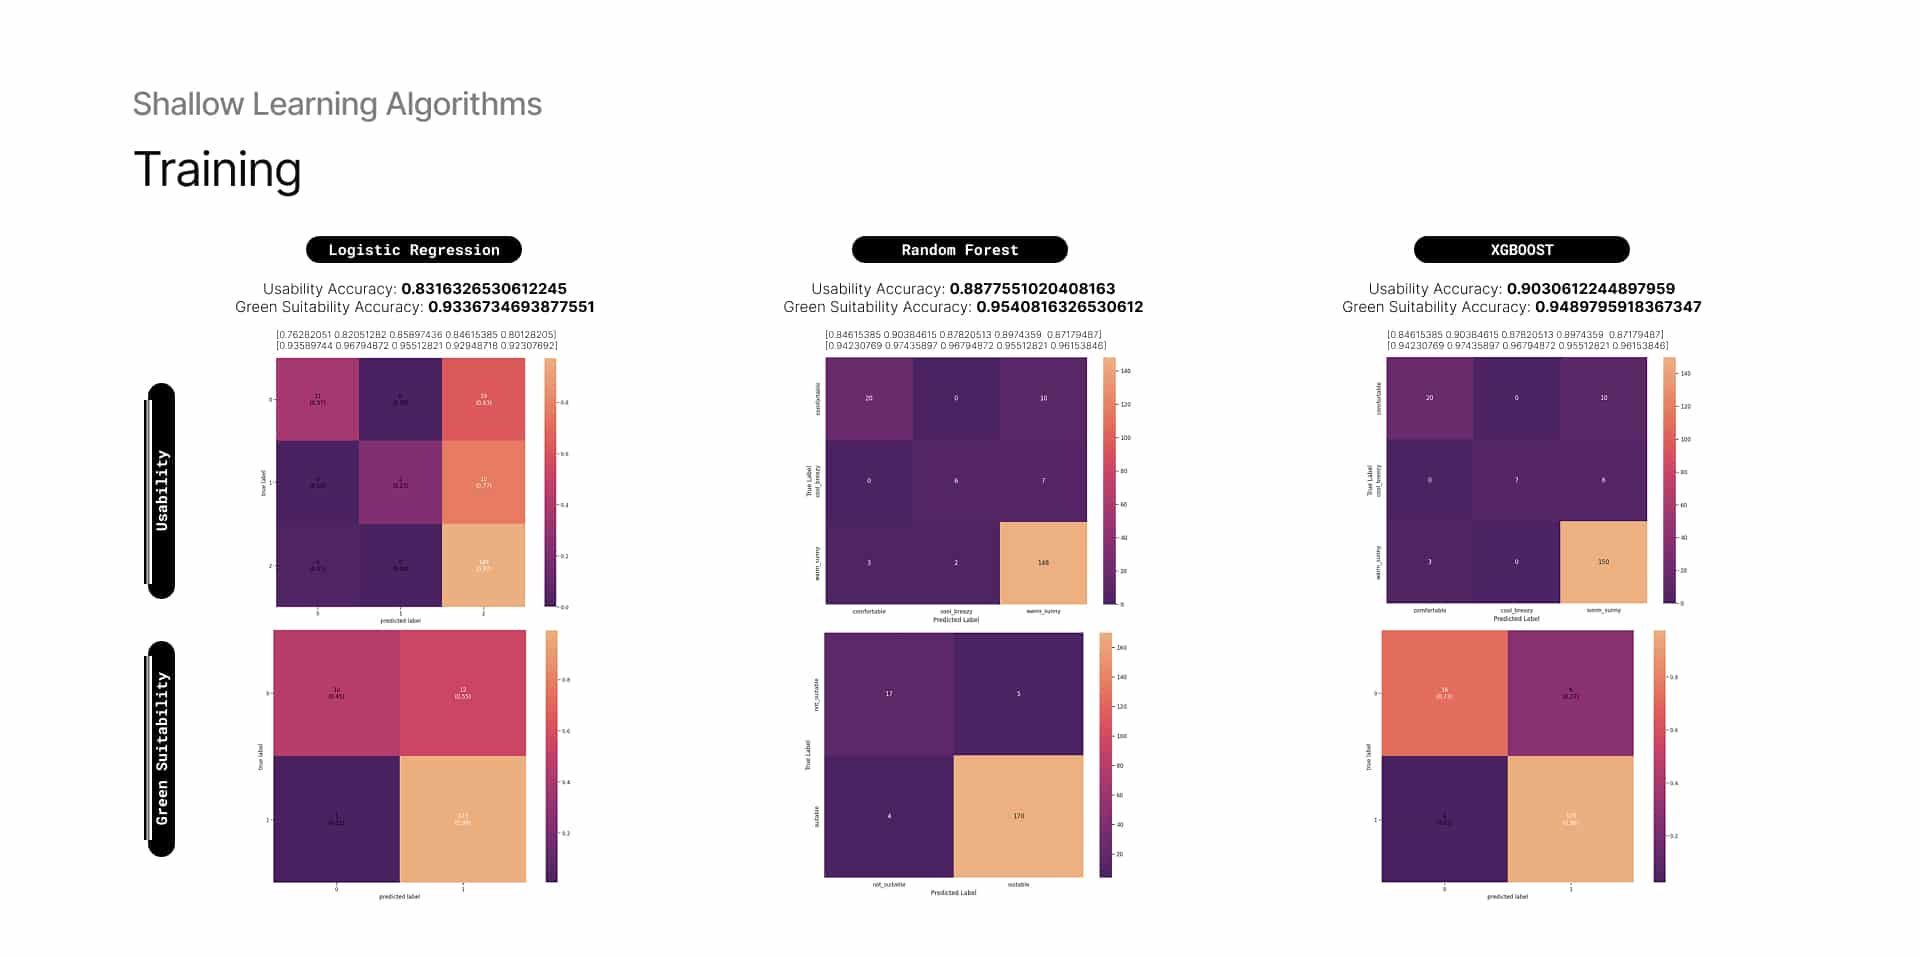
8 — Training: Green Suitability & Usability Models
Training was conducted for both target variables using three different algorithms. Among them, XGBoost performed slightly better than Random Forest for predicting Usability, primarily due to its ability to capture non-linear relationships and complex feature interactions. Logistic Regression showed relatively lower performance for both target variables, likely due to its limitations in modeling non-linear patterns.
Deep Learning Algorithms: : Multiclass Multi-label Predictions
Target: Activities
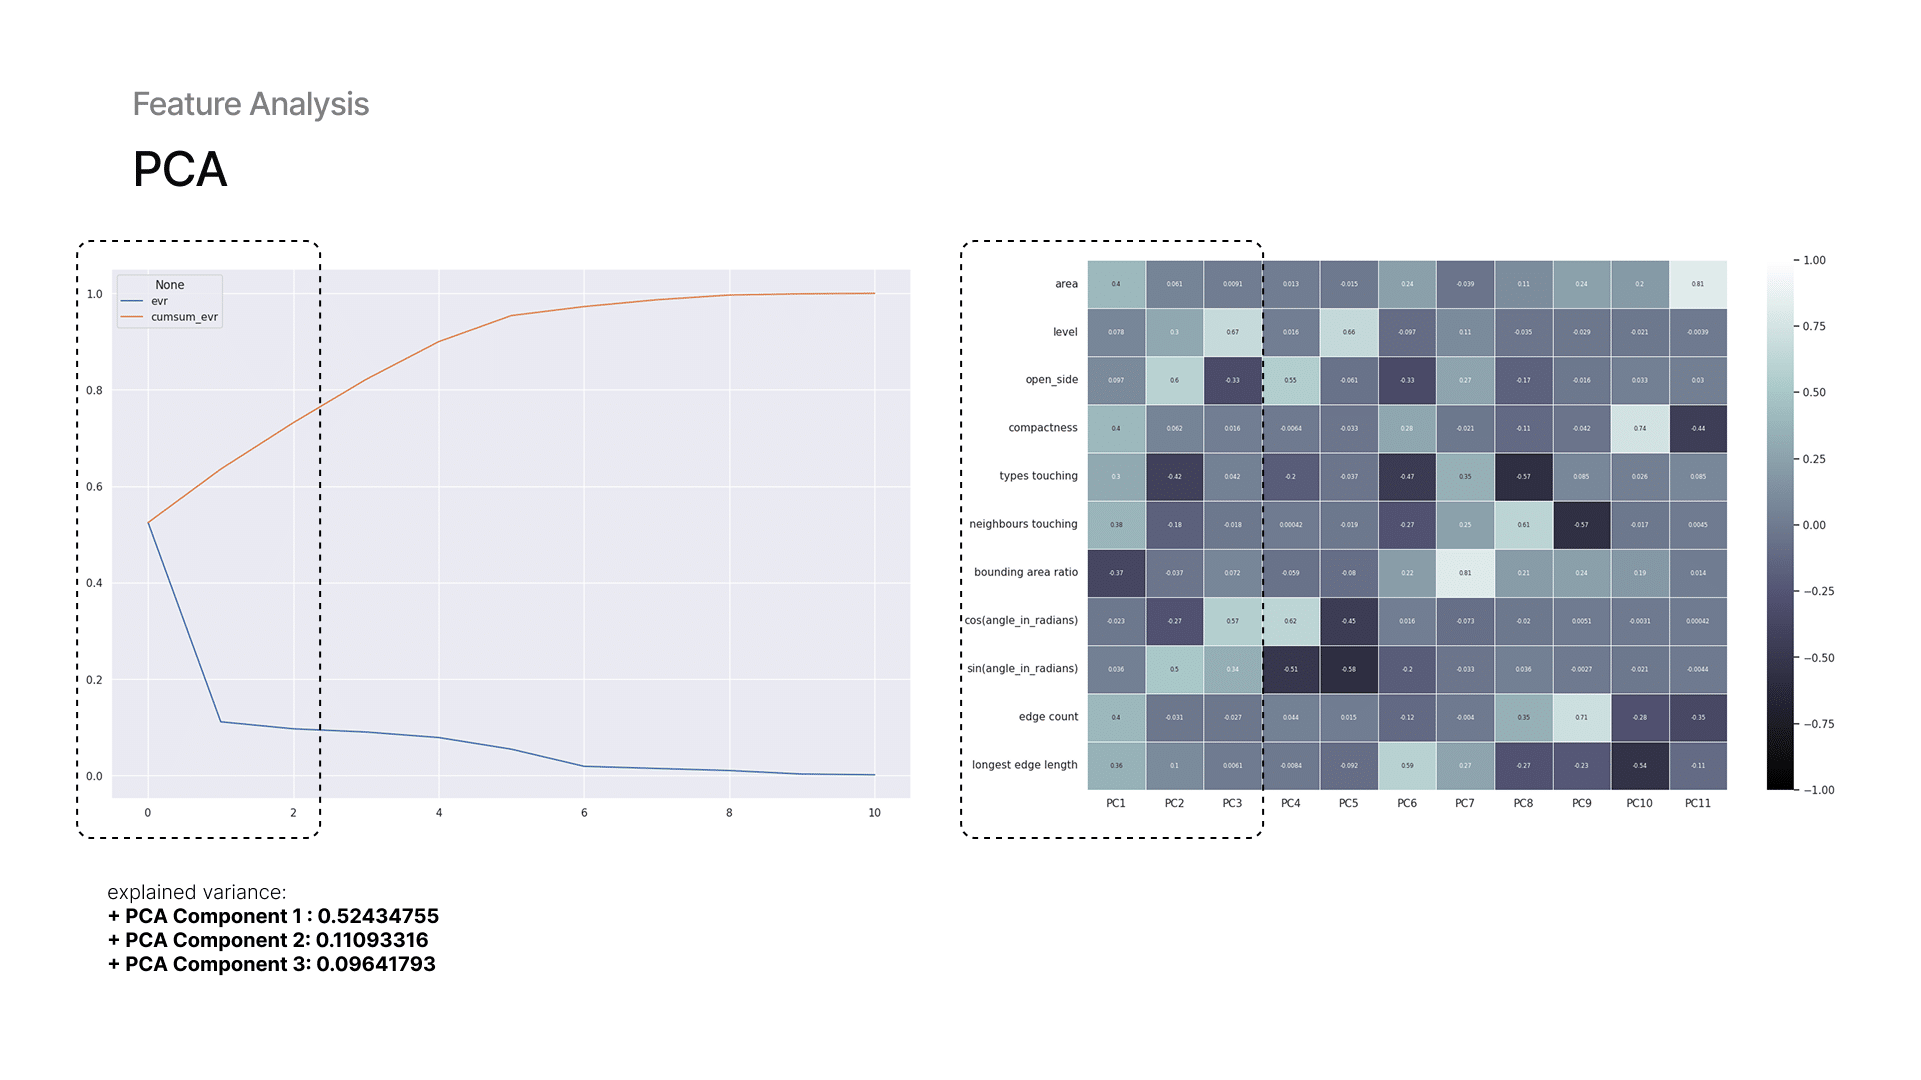
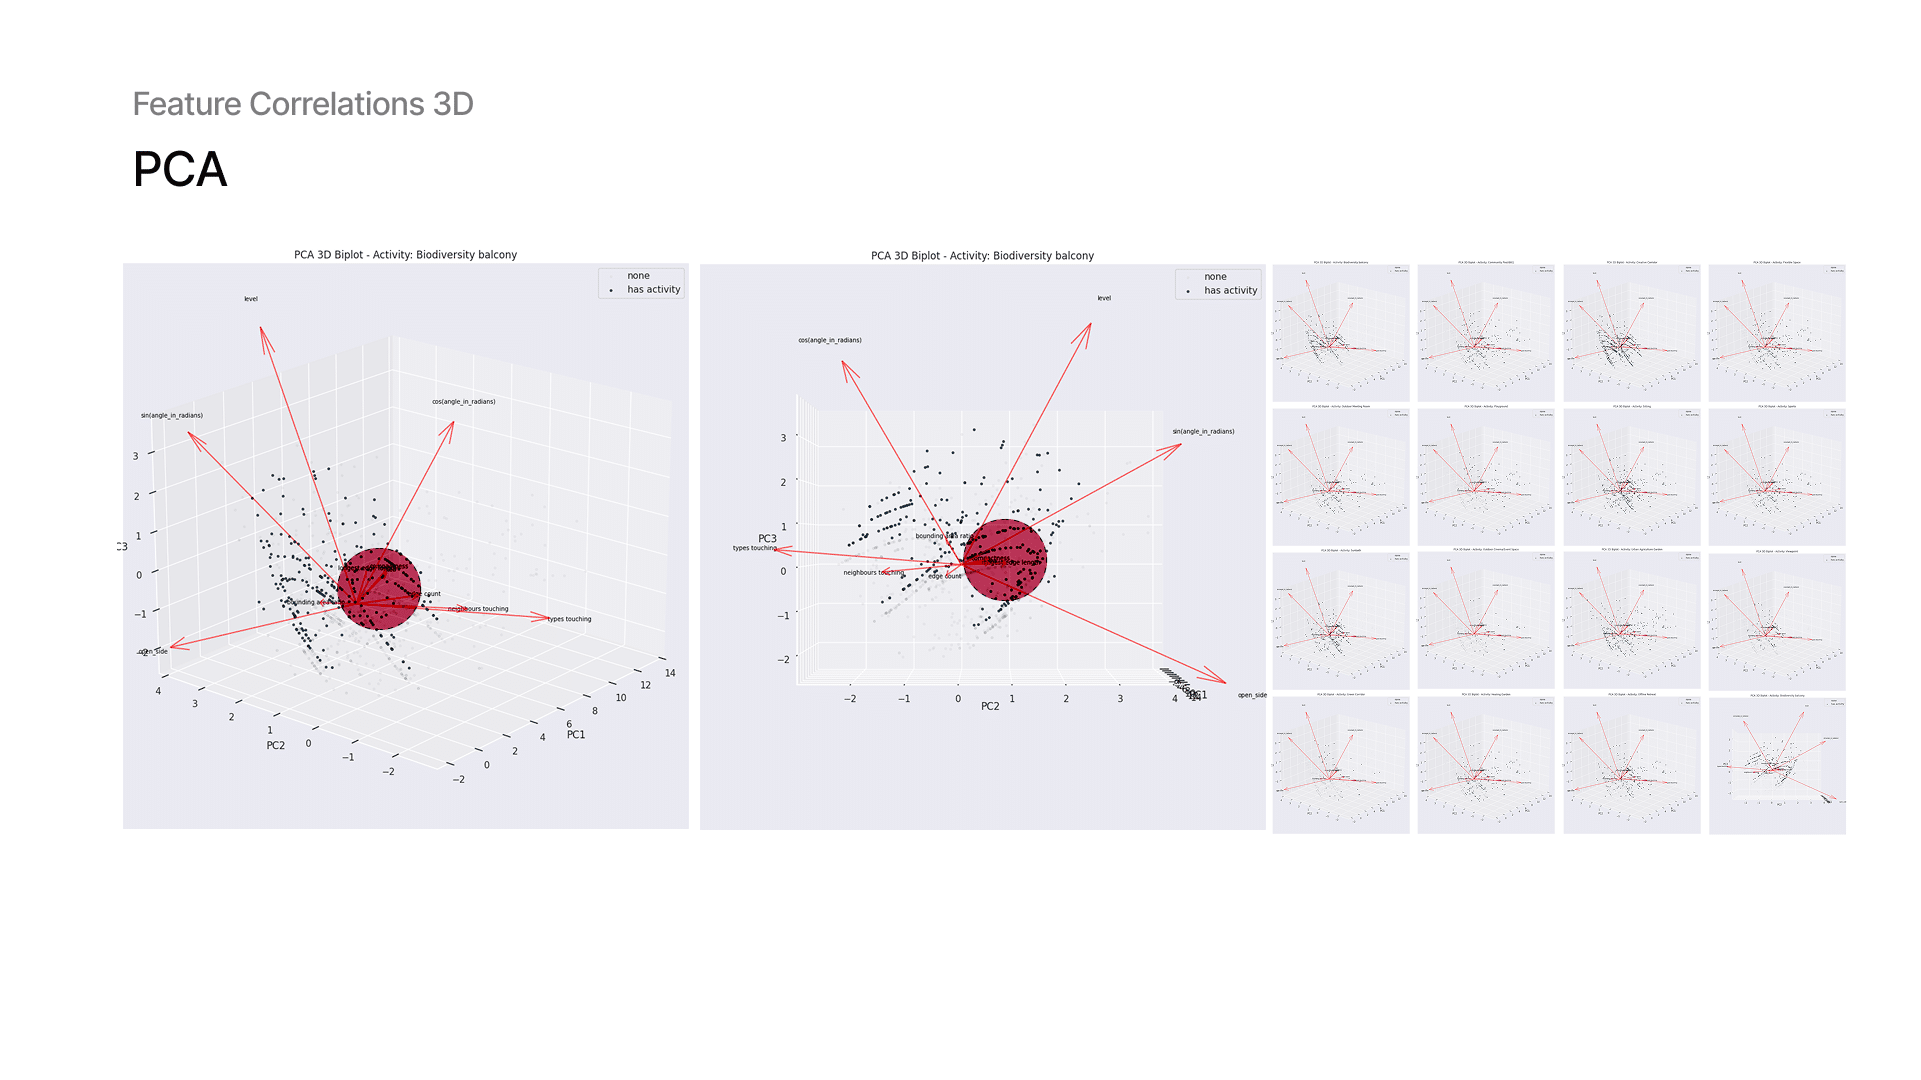
9 — Dataset Analysis: Feature Variance
Using PCA, we analyzed our features. With PCA 1 component we already get 52% of variance. Then, we examined which feature vectors overlap. For example, correlation between compactness and area, so we drop one of them. Here, you also see how multi-label activity data appears in the plots, each activity is highlighted in color while others remain grey.
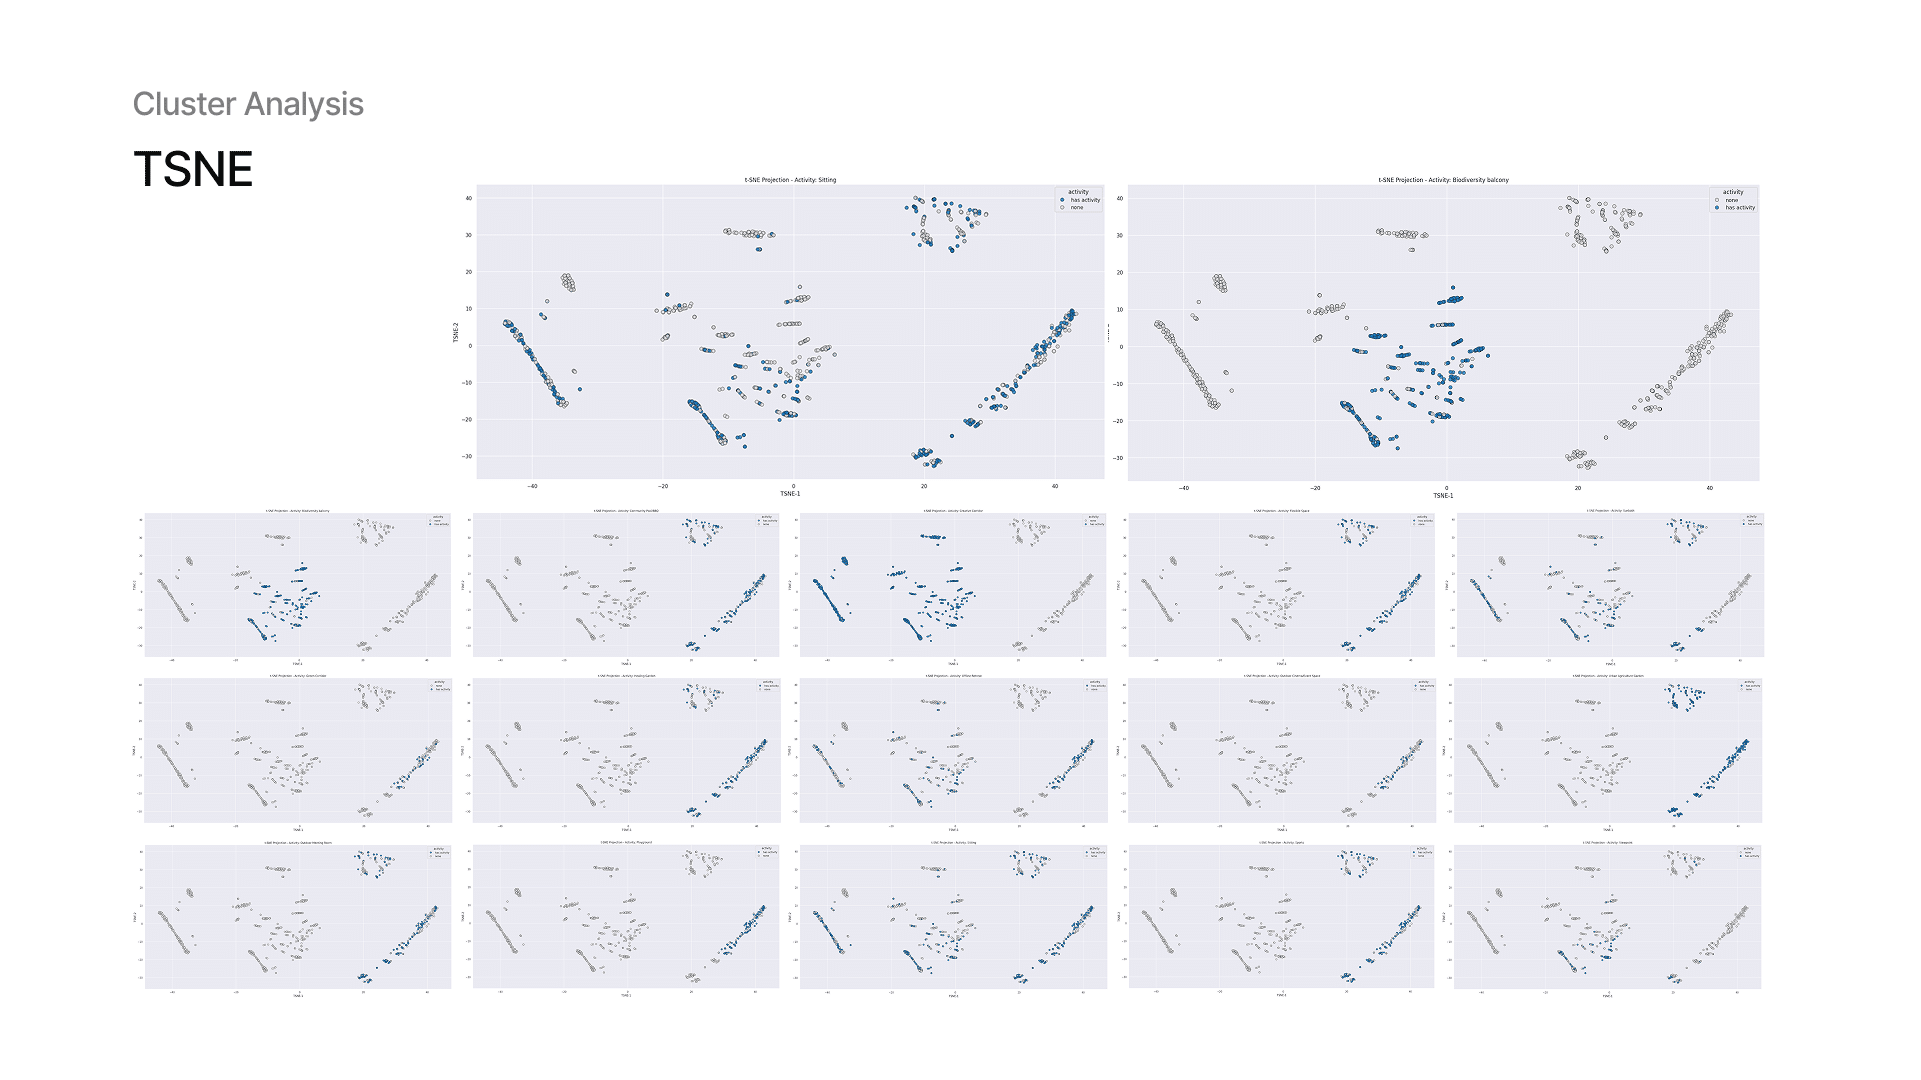
10 — Dataset Analysis: Data Point Clusters
With t-SNE, we observed how spaces cluster based on activity. Some activities form tight clusters, indicating strong rules, while some like sitting appear more scattered, indicating weaker patterns. Like in PCA, plots show activity by activity since most of the points overlap.
11 — Final Dataset
After all pre-processing, we reduced the dataset to X final features used across all three models.
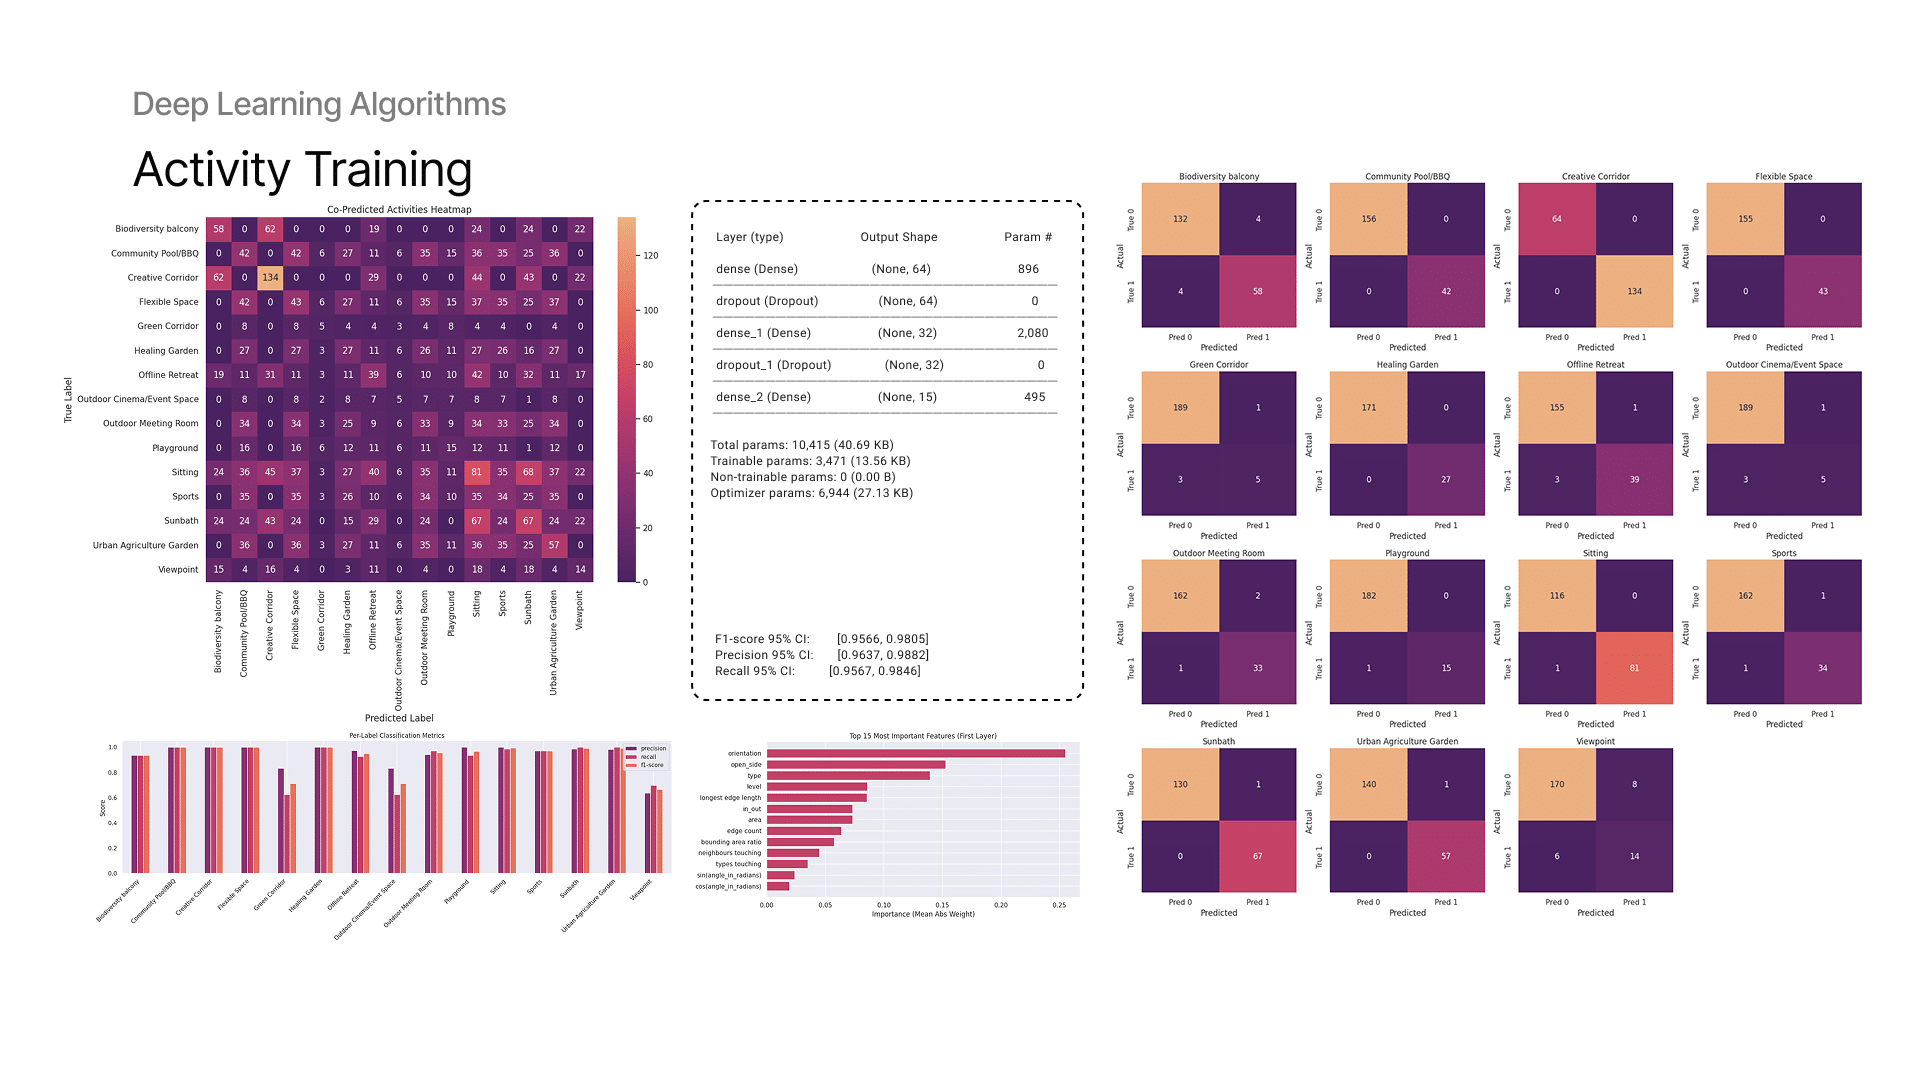
12 — Training: Activity Prediction Model
Model achieved high accuracy, with an F1 score around 0.97, showing strong generalization across diverse spatial types. The most influential features were orientation and open side, highlighting how environmental factors drive spatial usability more than just size or shape.
Confusion between certain activities like “Sitting” or “Viewpoint” reflects real-world overlap — which could align with how people use flexible spaces. The model also learned patterns of co-functionality, like how one type of spaces supports other.
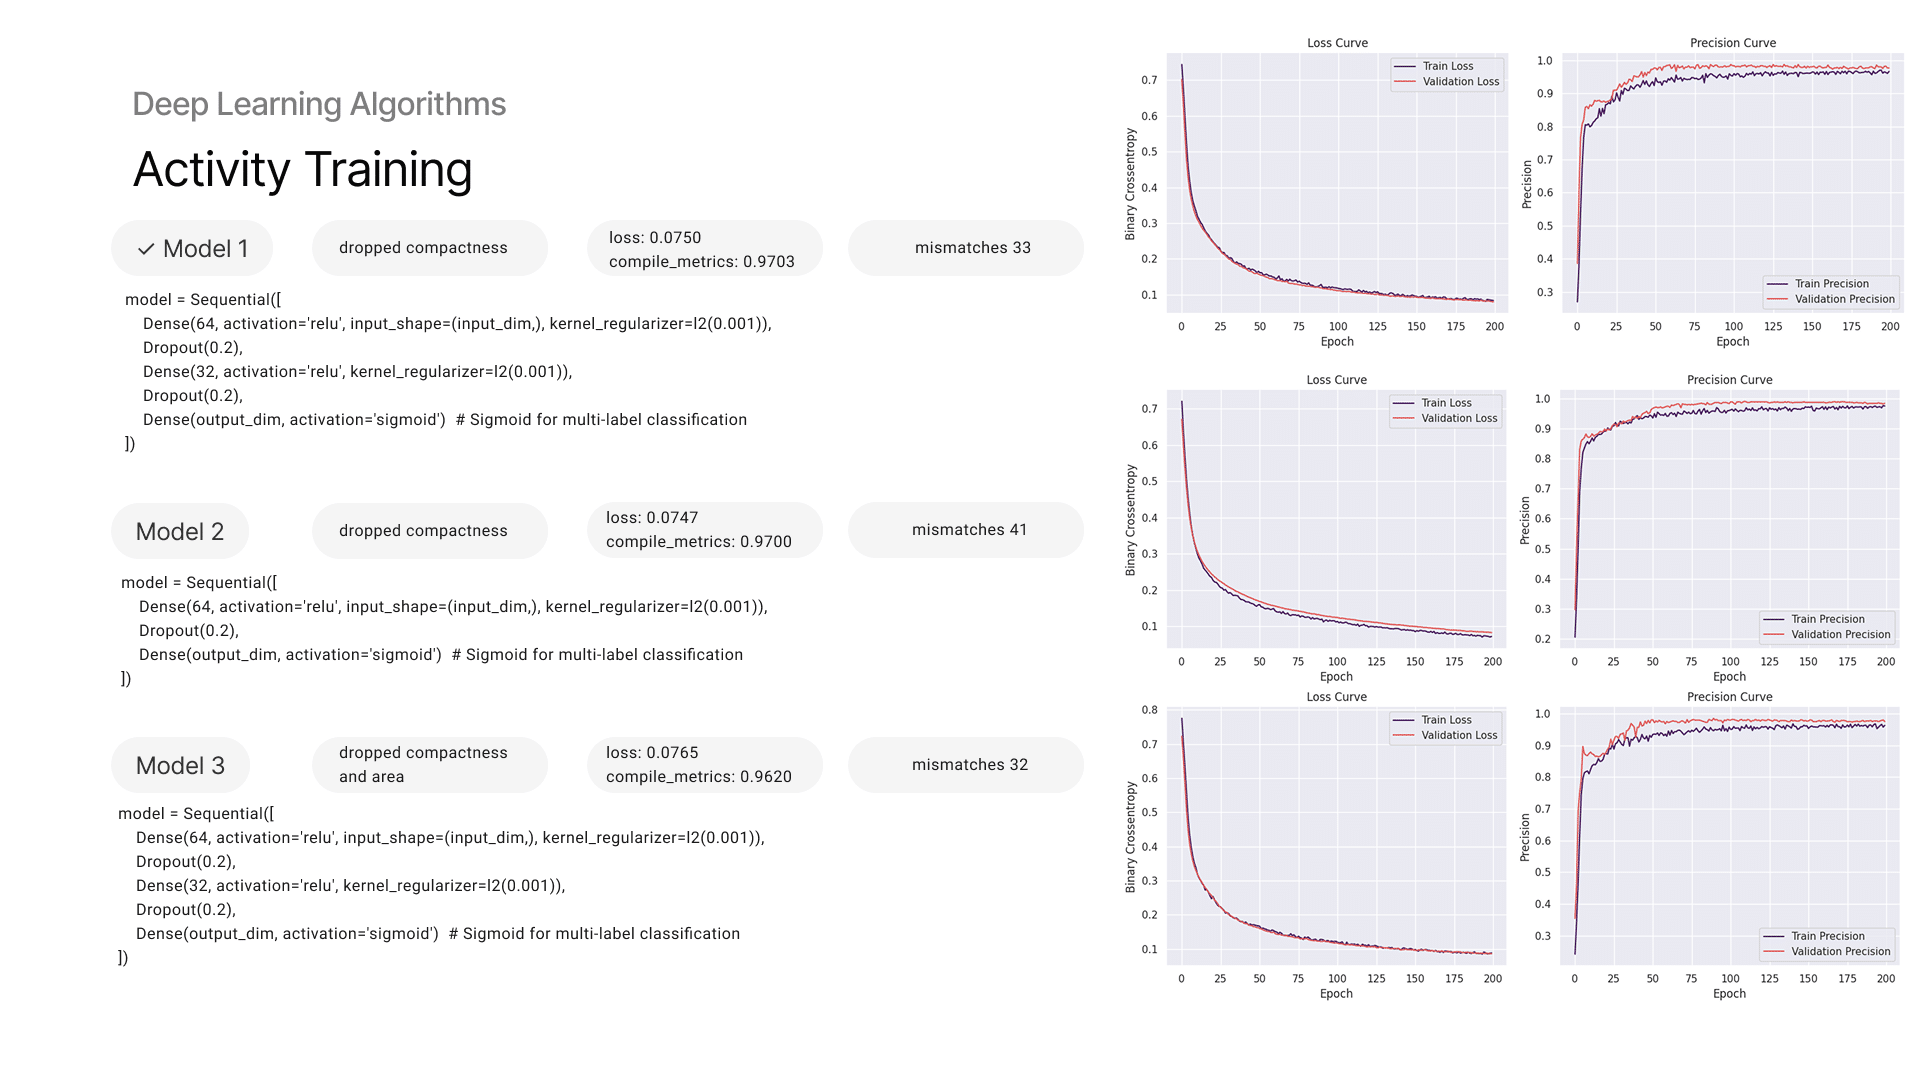
13 — Training: Activity Prediction Model
Activity prediction is handled using an ANN (Artificial Neural Network) for multi-label classification. We experimented with:
- different architectures (with/without hidden layers)
- including or excluding certain activities and features
- neuron counts
Storage was removed from the label list because it appeared too often, skewing results. “Sitting” was also tested separately due to its dominance. Model achieved high accuracy, with an F1 score around 0.97, showing strong generalization across diverse spatial types. The most influential features were orientation and open side, highlighting how environmental factors drive spatial usability more than just size or shape. Confusion between certain activities like “Sitting” or “Viewpoint” reflects real-world overlap, which could align with how people use flexible spaces. The model also learned patterns of co-functionality, like how one type of spaces supports other.
Model Analysis
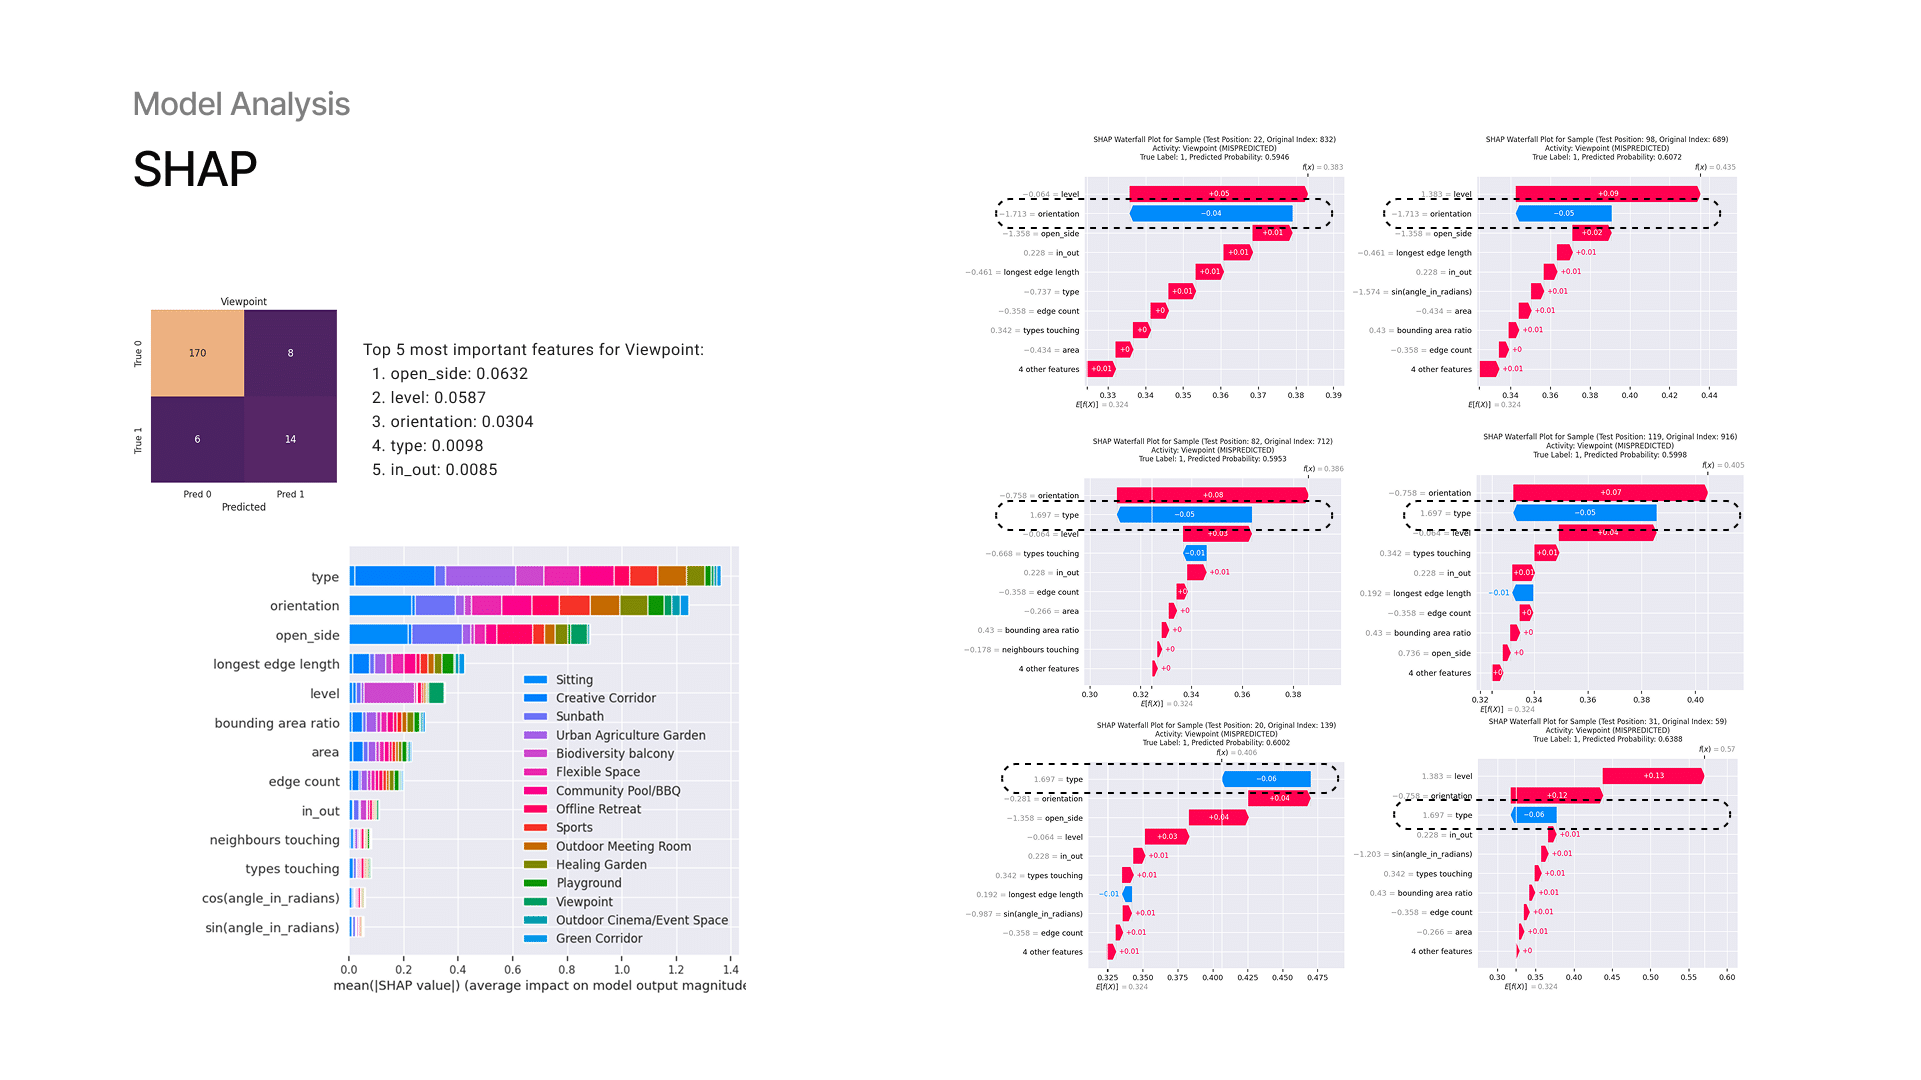
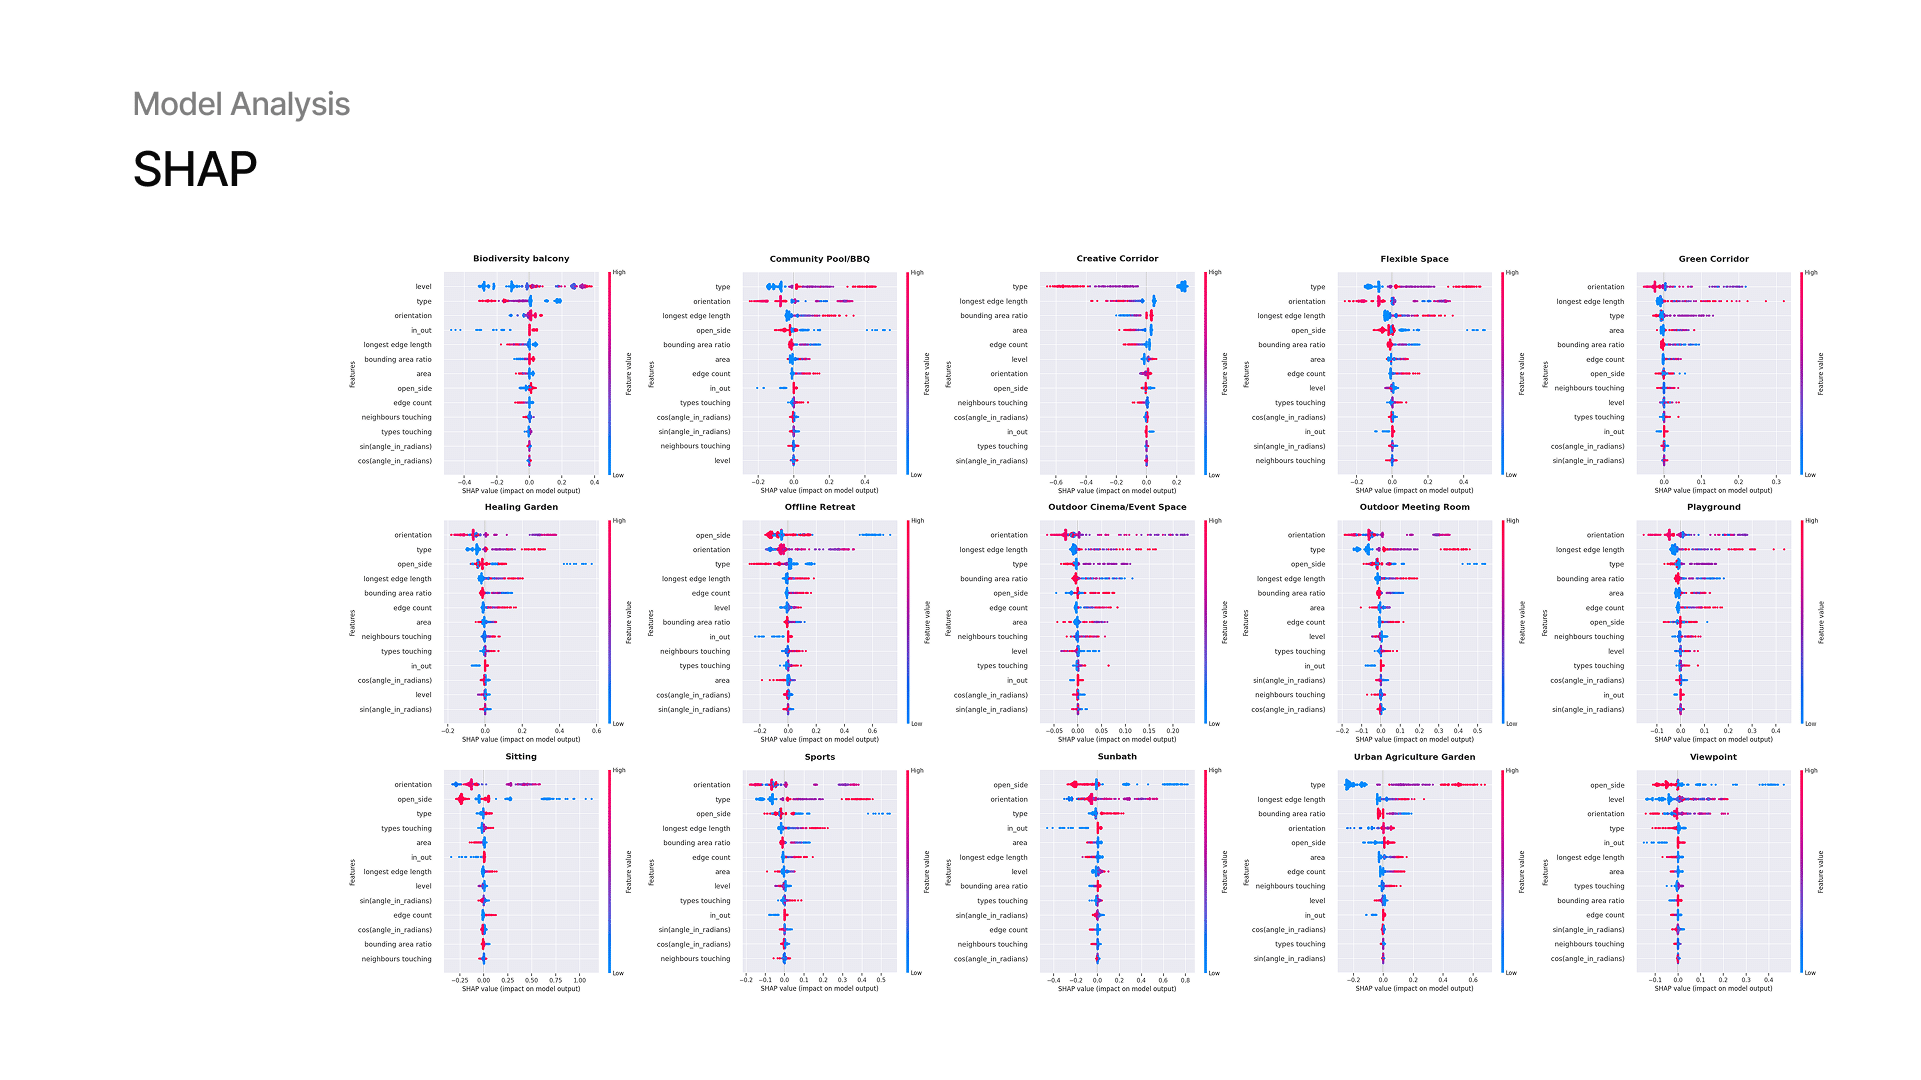
14 — SHAP: Model Analysis
To better understand mispredictions, we use SHAP. On the example of mis predicted activity of Viewpoint we examined how much and which features contributed to the final prediction. This helps us understand why some predictions failed and gives us insight for future improvements. We also analyzed which features contributes more for each activity. Mostly they are type, orientation, open_side or level.
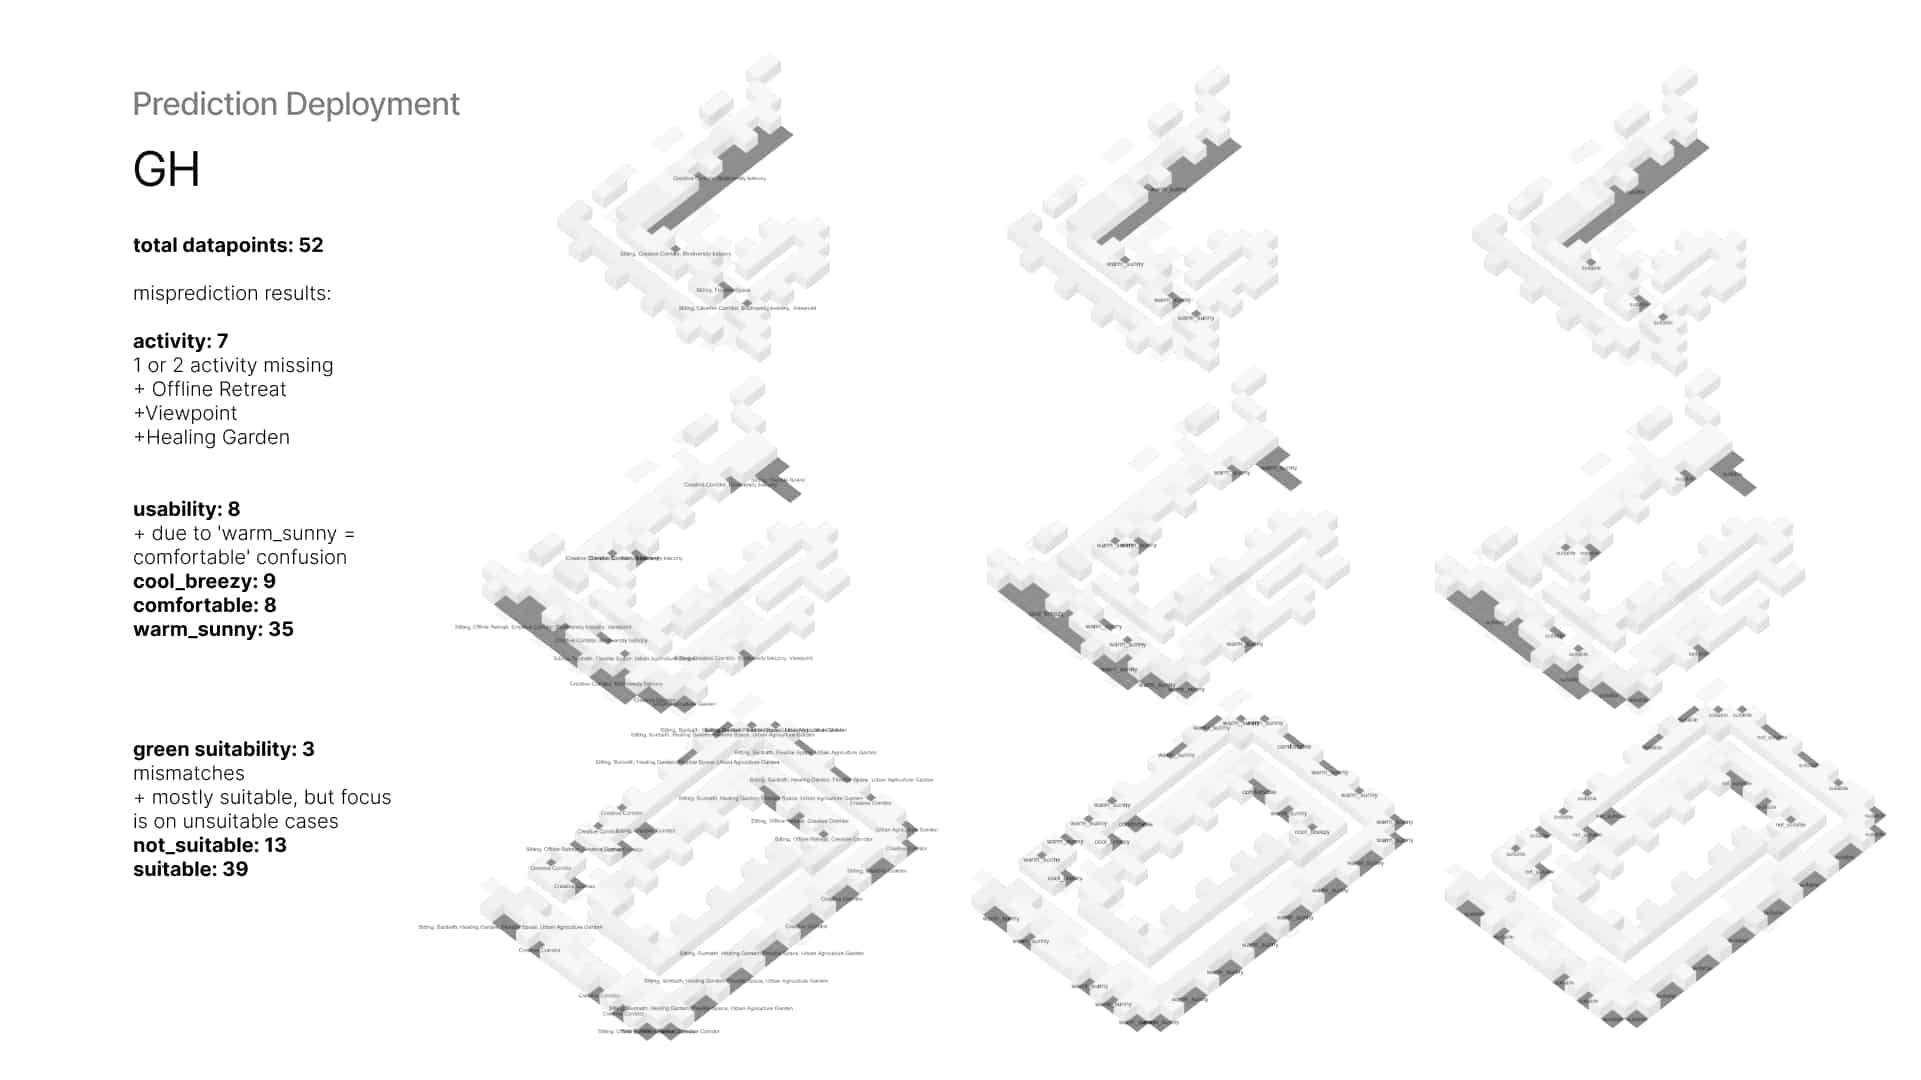
14 — Deployment Results
Back in Grasshopper, we deploy our models on a sample building, with predicted values, visualized directly on the geometry for real-time feedback.
For activities, most misclassifications involved offline retreat, viewpoint, and healing garden, as reflected in the confusion matrix. Usability predictions often confused “warm_sunny” with “comfortable” due to their similar conditions. For green suitability, although the “not_suitable” class was rare, it was correctly predicted, while some “suitable” areas were incorrectly labeled as “not_suitable.”
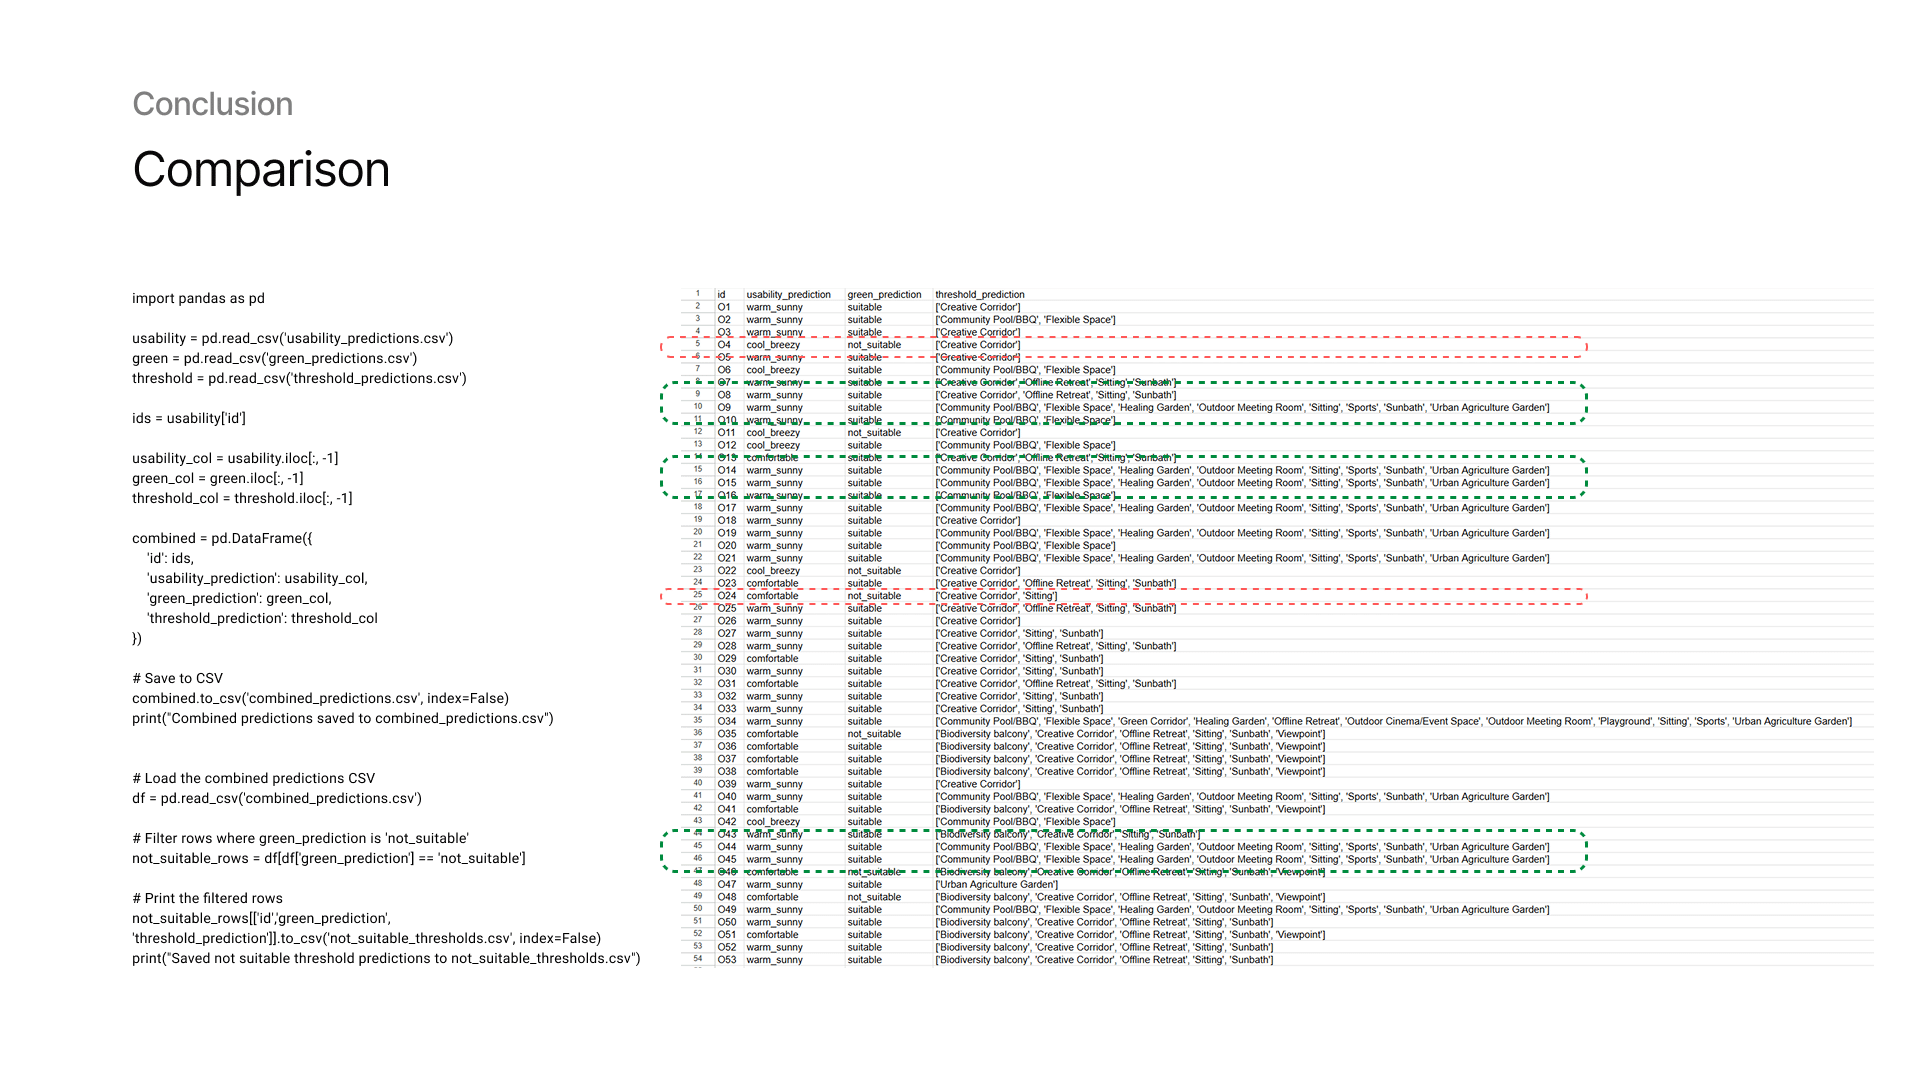
15 — Model Comparison
To validate predictions, we compare outputs across models. For example, does a high green suitability score align with activity predictions like “gardening” or “relaxing”? This cross-check helps ensure the model predictions make logical sense together.
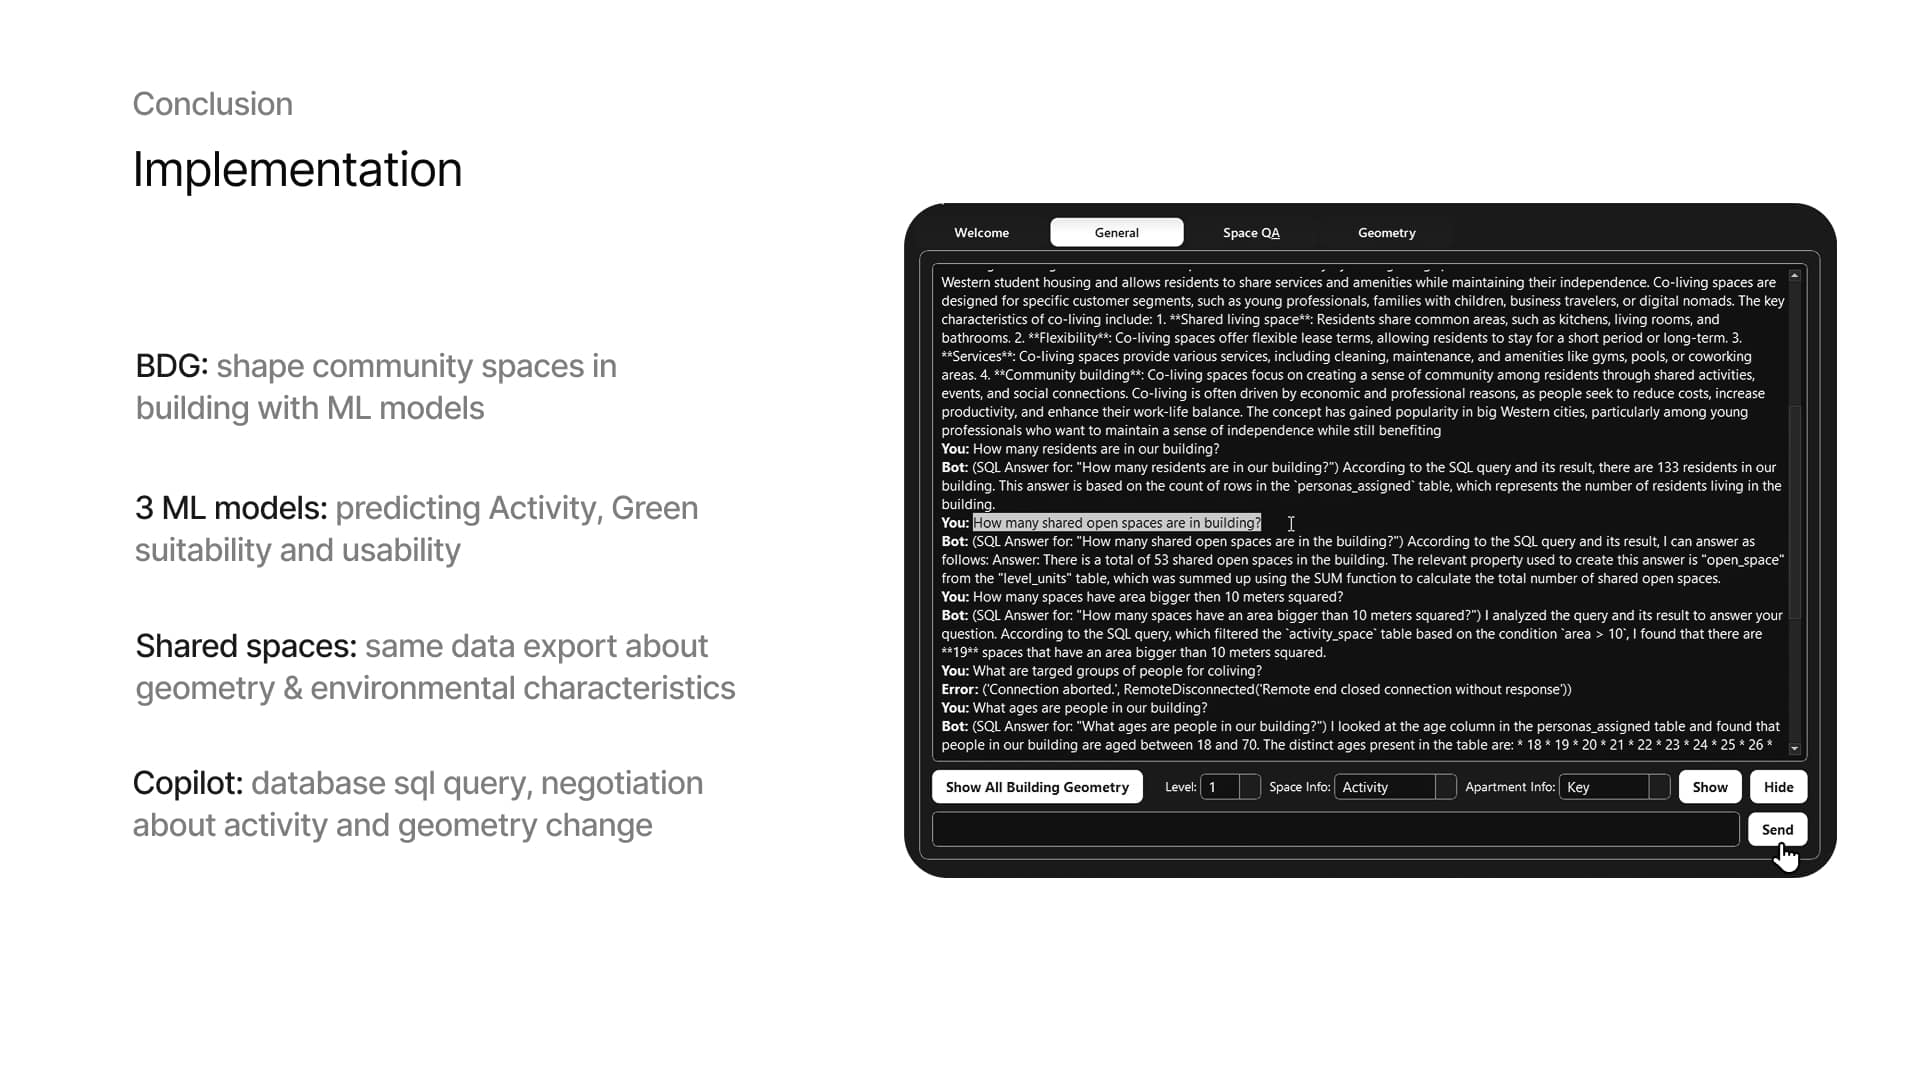
16 — Future Implementation
In conclusion, these models are part of a larger studio co-pilot tool aimed at shaping community and shared spaces. By keeping a consistent setup for geometry and data extraction, we allow residents and designers to query, negotiate, and co-design shared space programs, based on both data and human needs.