We developed a property-driven bucketing pipeline for BIM models using Speckle Automate that automatically groups building elements by numeric ranges and visualizes them as gradient-colored 3D models on a live website — making performance data accessible without needing to open Speckle.
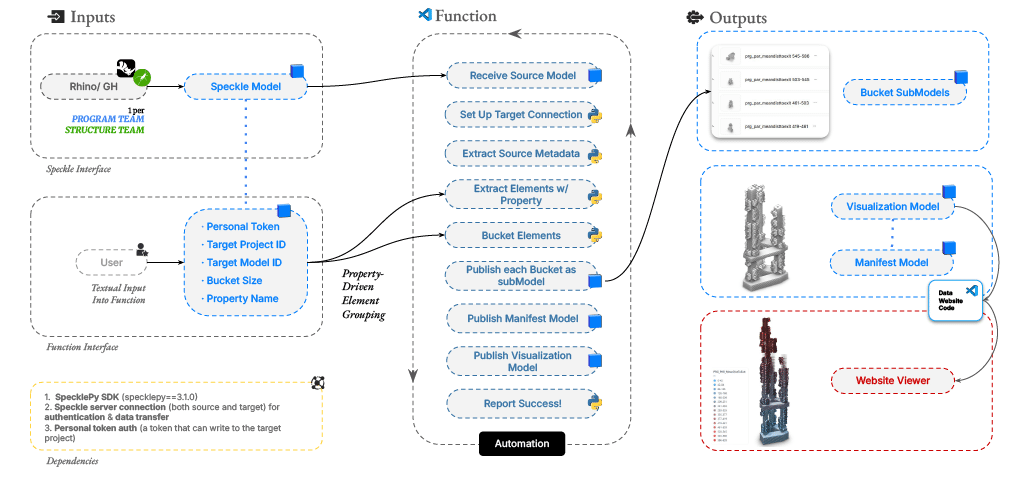
In collaborative design projects, reviewing building performance data is often a bottleneck. Team members from program, structure, or façade sub-teams need to understand how parameters like distance to exit or floor area are distributed across a model. In practice, this means opening the Speckle viewer, clicking through elements one by one, and mentally piecing together the bigger picture. It’s slow, and it cuts out anyone without a Speckle account. Our team built a Speckle Automate function that eliminates this manual process by turning raw model data into organized, visual output automatically, every time a new model version is published.
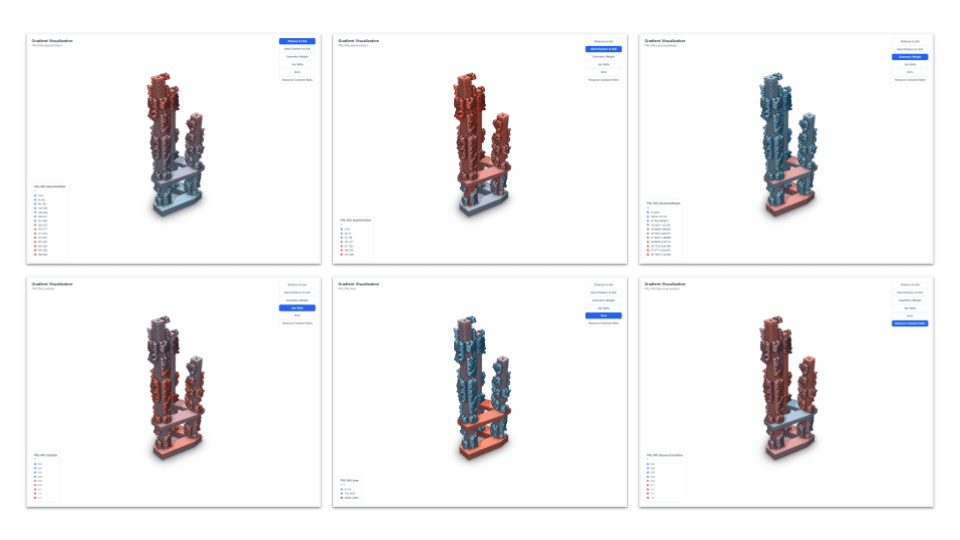
The function receives the latest model version, flattens every object in the tree, and extracts a user-specified numeric property from each element. It groups these elements into range-based buckets and publishes each bucket as a separate sub-model in a target Speckle project. Alongside the buckets, it publishes a manifest containing metadata about the run (bucket boundaries, element counts, data range) and a visualization model where every element carries a normalized gradient value tied to its bucket. This structured output is what powers the frontend: a deployed website with an embedded 3D viewer that colors elements by their value range, so the spatial distribution of any property is immediately visible.
How it Works
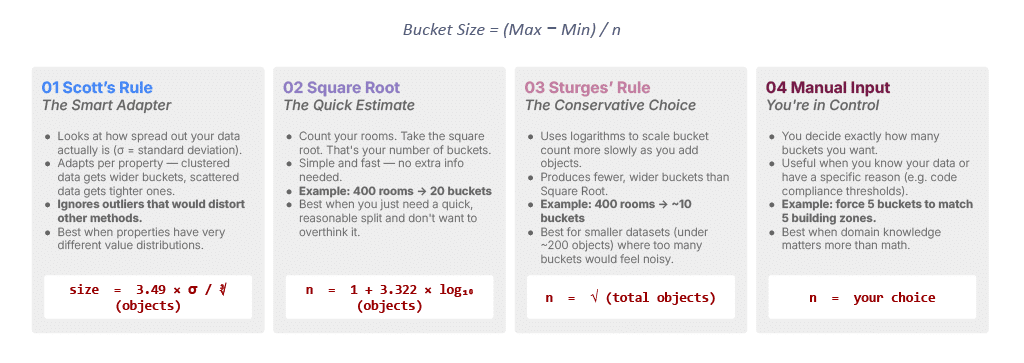
One design decision we spent time on was how to determine the number of buckets. A fixed bucket count works in some cases, but different properties have very different distributions, so what works for floor area won’t necessarily work for distance to exit. We implemented four methods: Scott’s rule, which adapts to data spread using standard deviation; square root, a fast general-purpose option; Sturges’ rule, which is more conservative for smaller datasets; and a manual override for cases where domain knowledge matters more than statistics. The user selects a method from a dropdown when configuring the automation, and the function computes everything else.
Computational Bucketing
User Workflow
A review that previously took 25–30 minutes of manual inspection now takes under three minutes. Collaborators who don’t use Speckle can open the website, see gradient-colored elements mapped to performance ranges, and spot problem areas without needing to navigate the model themselves. The automation runs on every new model version, so the visualization stays current. For future iterations, we’re looking at multi-parameter visualization, threshold alerts for critical values, and filtering by element type or building zone.
Gradient Visualization