Turning pollution data into planning decisions.
TEAM: Martina Simoni , Rim Choufani, Rashi Desadla, Bhavana Priya B
INTRODUCTION
Kraków’s air quality problem isn’t abstract. It’s measurable, and it’s bad. Over six sessions, our team (Rim, Martina, Rashi, and Bhavana) used the CRISP-DM framework to ask a focused question: can urban form (building density, road networks, green space) actually predict PM2.5 concentrations at a resolution useful for planning decisions? This post walks through how we got from a research question to a deployable screening tool, phase by phase, including the parts that didn’t work.
Before touching any data, we had to be honest about who this was for and what “success” meant. The end user isn’t us, it’s a Kraków Planning Office analyst deciding whether a development permit should carry a green-infrastructure condition. That framing shaped every threshold we set: an R² of at least 0.40, an MAE below 12 µg/m³ to be practically useful, and a pipeline reproducible in under 30 minutes so it could actually survive contact with a real office workflow.
Numbers don’t mean much without a reference point. Kraków’s annual average PM2.5 sits at 66.2 µg/m³, over six times the WHO guideline of 5, and well above even today’s EU limit of 25. Our forecast shows the city still hovering around 64 µg/m³ by 2030, the year the EU limit tightens to 10. This isn’t a problem we solve before the next permit hearing. It’s a decade-long trajectory the tool needs to track.
We pulled together three sources that don’t naturally talk to each other: GIOŚ’s daily PM2.5 readings across 7 stations, Copernicus Urban Atlas land-use percentages, and ERA5-Land weather data via Open-Meteo. Each came with its own gaps and quirks. Most notably, all 7 stations cluster within 15km of the city center, so the model has no exposure to rural or outer-district typologies. We logged that limitation rather than hiding it, along with the 37 missing boundary-layer-height values we filled with median imputation.
This was the unglamorous middle stretch: normalizing eight raw station exports into a single schema, fixing timestamps, flagging sensor outliers, and computing land-use percentages within a 500m buffer per station. A caching layer kept repeated Urban Atlas and Earth Engine calls fast and reproducible. The output, a cleaned dataset, was split into train/val/test using leave-one-station-out cross-validation, and sealed before any modeling decisions were made, to keep us honest.
We chose Random Forest over a deep model or LLM for a simple reason: with only 471 rows of tabular data, RF gives interpretable, defensible feature importance, something a planning office can actually cite in a hearing. The real turning point came in v2, when we added ERA5 weather features. Test R² jumped from 0.639 to 0.850, and MAE dropped from 9.96 to 6.48 µg/m³. The tradeoff: land-use importance fell from 6.4% to 2.3%, not because land use stopped mattering, but because weather had been absorbing a confound that inflated it.
Good models reveal where they fail, and ours fails predictably in winter (MAE still highest at 9.12 µg/m³, even after improvement) and at sheltered sites like Złoty Róg, where over-prediction persists. Our 90% prediction intervals only cover 72.5% of actual outcomes, short of the 85% deployment target. We were also careful about a tempting story: Nowa Huta, the former steel-plant district, is consistently the cleanest of all 7 stations, while the dense city-center tenement grid is the dirtiest. It’s a compelling street-canyon-versus-open-geometry hypothesis, but with only 7 data points, it’s our best guess, not a tested finding.
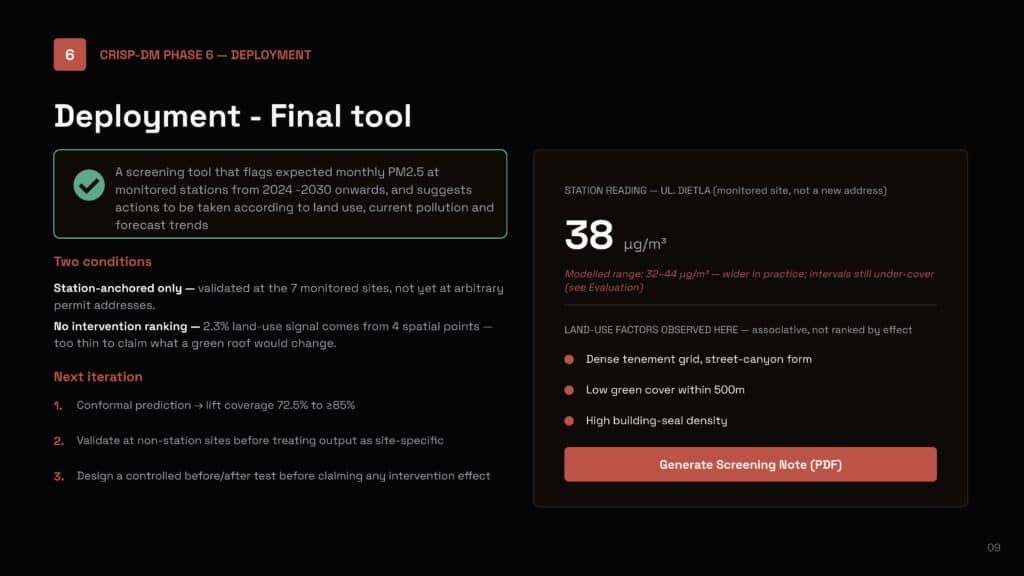
The final tool is a screening interface that flags expected monthly PM2.5 at monitored stations through 2030 and suggests actions based on land use and pollution trends. We were deliberate about its limits: it’s validated only at the 7 monitored sites, not at arbitrary permit addresses, and it doesn’t rank interventions. The land-use signal is too thin to claim what a green roof would actually change. Next steps are concrete: conformal prediction to lift interval coverage to 85%+, validation at non-station sites, and a proper before/after test before any intervention claim gets made.
Selecting a station surfaces everything an analyst needs in one panel. Prądnik Czerwony reads 87 µg/m³ here, 347% of the EU annual mean limit, flagged “Very High.” The monthly profile strip shows November as the worst month of the year for this station, and the neighbourhood breakdown explains why: 35% continuous urban fabric and 33% roads and industry, against only 18% parks and green space. The actions panel responds accordingly, restricting through traffic, extending district heating, and launching an emergency boiler survey, all marked as priorities. Every output here is traceable to its source: RF model, ERA5 baseline, validated station.