
Habitar 7.2: Graph Machine Learning of an Architectural Floor Plan
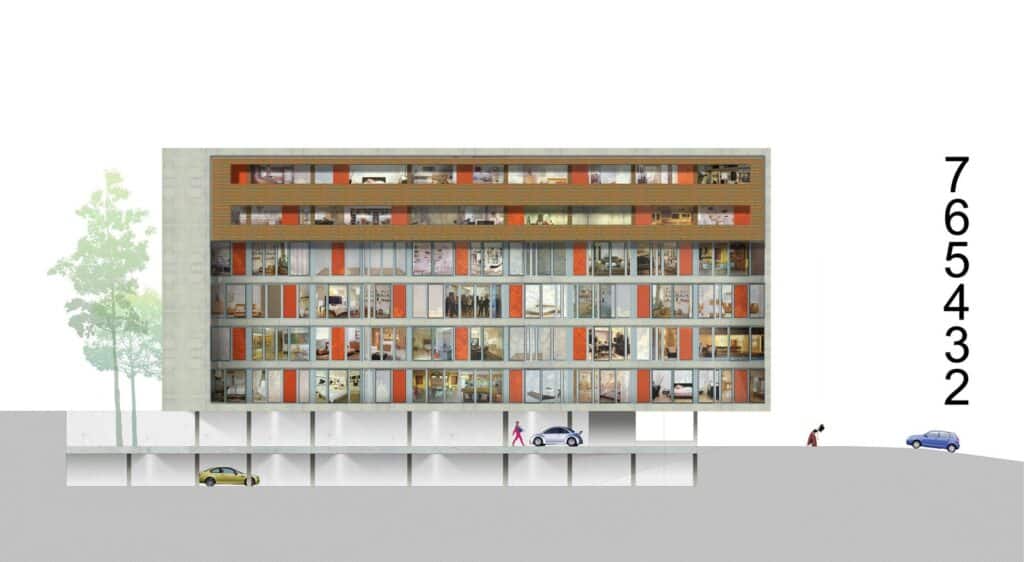
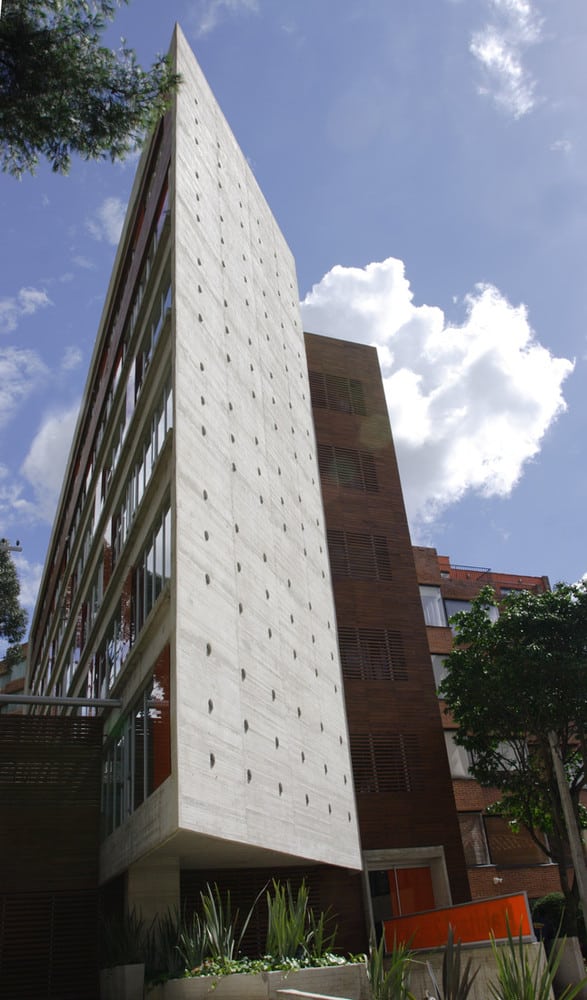
Habitar 7.2, a residential building by Giancarlo Mazzanti and Alejandro Castaño in Bogotá, was used as a case study to test how an architectural floor plan can be translated into a graph, analysed through spatial intelligence, and classified room-by-room with a graph neural network.
The project asks a simple question: what happens when a building is no longer read only as geometry, but as a system of spatial relationships?
Instead of treating the floor plan as a static drawing, the research converts rooms into nodes, doors into edges, and circulation into a measurable network. This graph is then analysed with TopologicPy and tested with a pretrained GraphSAGE model trained on the Modified Swiss Dwellings dataset.
Case Study and Plan Selection
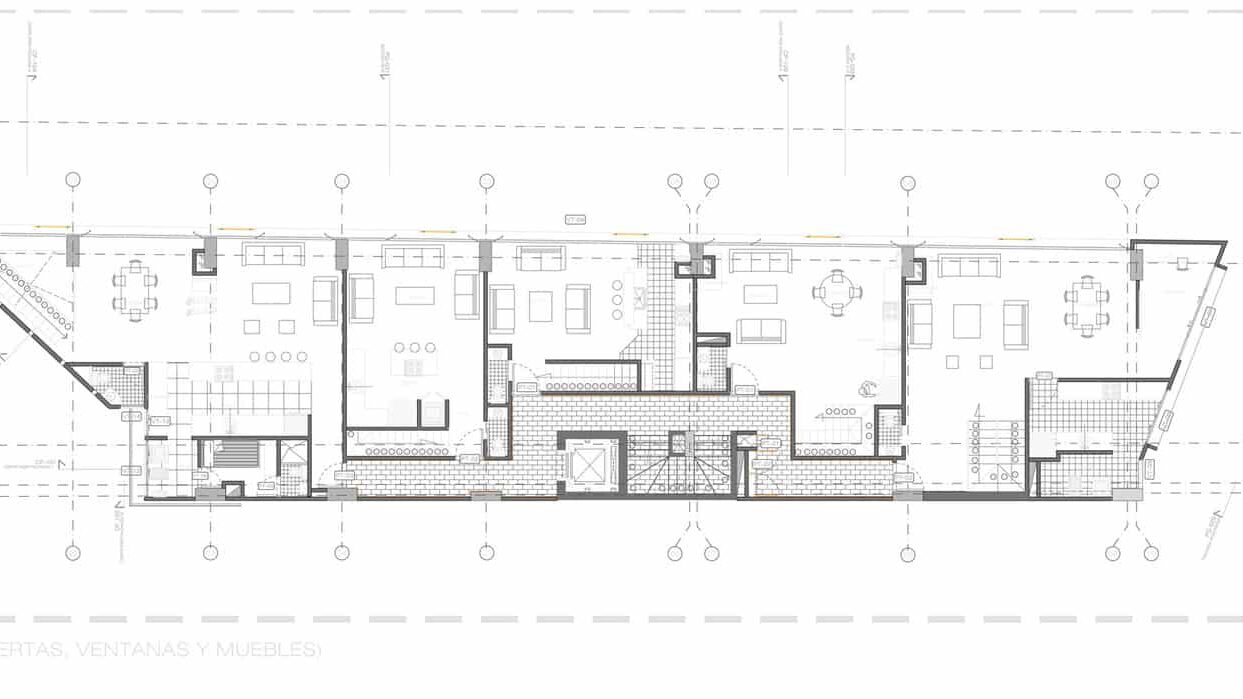
The starting point was the complete residential building. Habitar 7.2 is organized as a stacked housing system, where several apartment levels repeat a similar spatial logic. For this research, one residential level was isolated.
This level contains five duplex apartments connected by a shared central corridor. That configuration makes it a useful test case for graph-based spatial analysis because the plan contains both private domestic rooms and a collective circulation spine.
The research therefore moves from the scale of the building to the scale of the plan, and from the plan to the topology of rooms and connections.
Translating Architecture into Graph Data
The main premise is that an architectural plan can be read as a graph. In this translation, every room becomes a node, and every door, passage, or direct spatial connection becomes an edge.
This means that a bedroom, kitchen, stair, bathroom, corridor, or living space is no longer only a drawn area. It becomes a point in a network. The relationships between those spaces encode how movement, access, privacy, and hierarchy operate across the plan.
This is important because a graph neural network does not read the plan as a human designer does. It does not automatically understand walls, furniture, domestic rituals, facade orientation, or room proportions. It reads data: nodes, edges, labels, and features.
Methodology: Five Stages from Geometry to Prediction
The workflow was structured in five stages. Each stage translates architectural information into a more computational format, moving from references and geometry to graph construction, spatial analysis, and machine learning prediction.
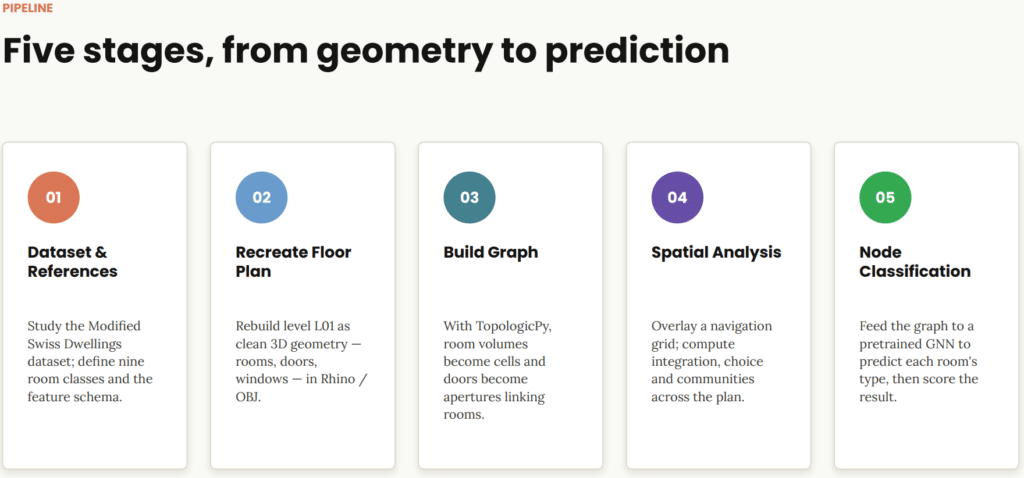
Stage 01 — Dataset and Room-Class References
The first stage established the reference system for translating residential architecture into graph data. The project used the Modified Swiss Dwellings dataset as a conceptual and technical reference for classifying residential spaces.
Instead of reading the plan only through lines, walls, and surfaces, the dataset organizes residential floor plans through room classes and spatial relationships. This makes it possible to define a graph-ready vocabulary.
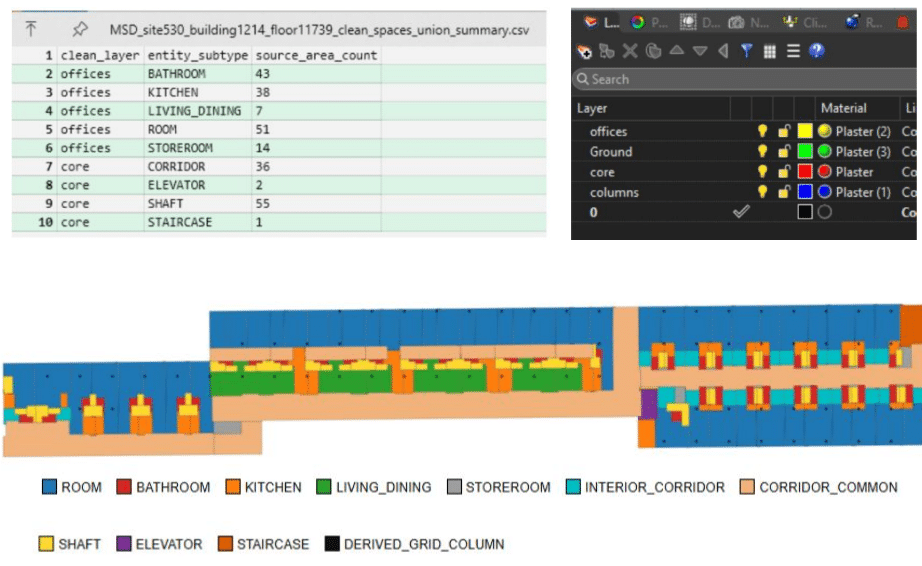
Nine room classes were used in the project: bedroom, living room, kitchen, dining, corridor, stairs, storeroom, bathroom, and balcony. These classes became the target categories for the later node classification task.
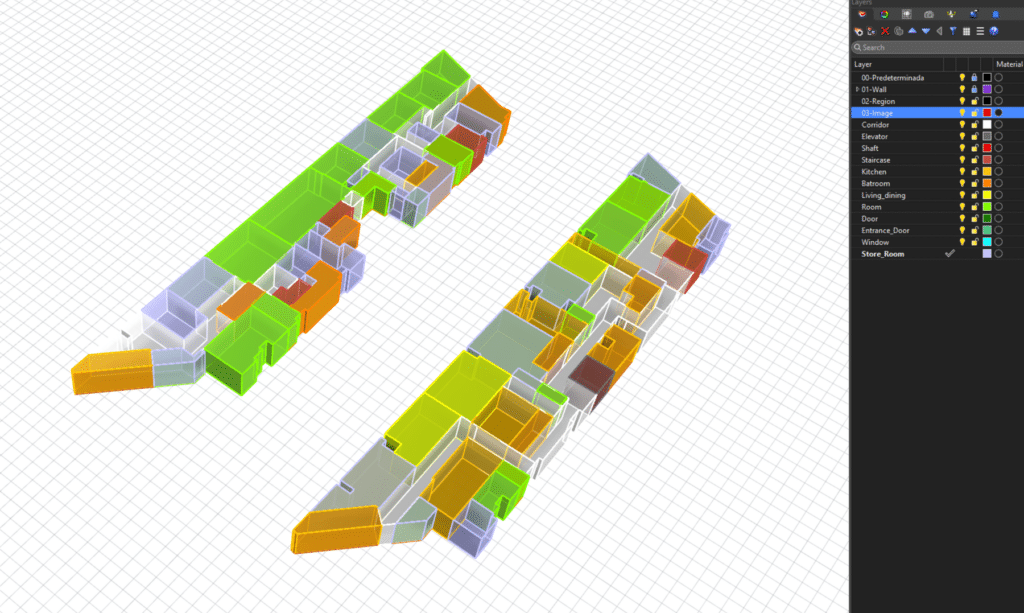
Stage 02 — Recreating the Floor Plan as Clean Geometry
The second stage rebuilt the selected level as clean 3D geometry. The plan was reconstructed from scratch as room volumes, doors, windows, and passages. This step was necessary because graph construction depends on explicit and readable spatial boundaries.
Each room volume had to be sufficiently clean to be interpreted later as a topological cell. Doors and openings had to be modeled as connections between spaces rather than as purely visual elements.
This stage is where architectural drawing becomes computational geometry. If the geometry is ambiguous, disconnected, duplicated, or poorly classified, the graph will inherit those errors.
Stage 03 — Building the Room Graph
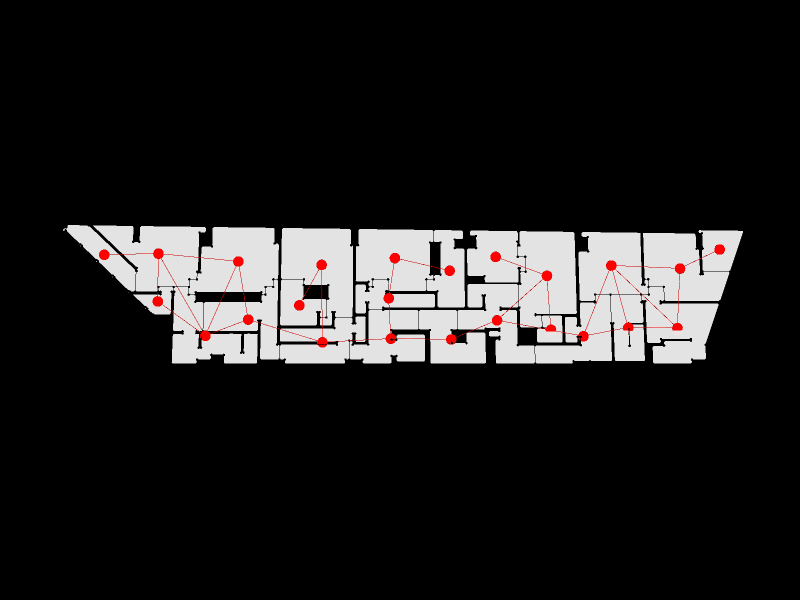
The third stage converted the architectural geometry into a graph. Using TopologicPy, each room volume became a topological cell. Doors, windows, and passages were interpreted as apertures linking one room to another.
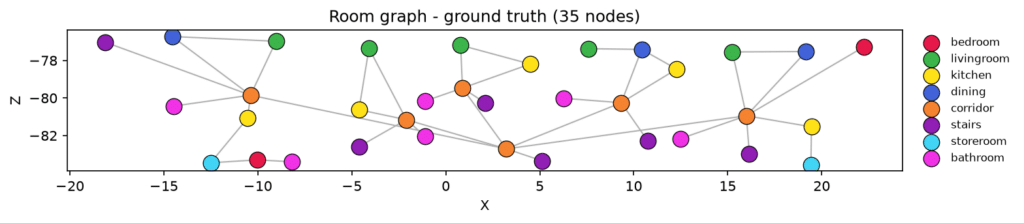
The resulting graph contains 35 nodes, 39 edges, one connected component, and nine room classes. In architectural terms, this means that the full level operates as a connected spatial system rather than as isolated rooms.
At this point, the plan is no longer just an image or a model. It becomes a dataset that can be measured, analysed, and passed into a machine learning model.
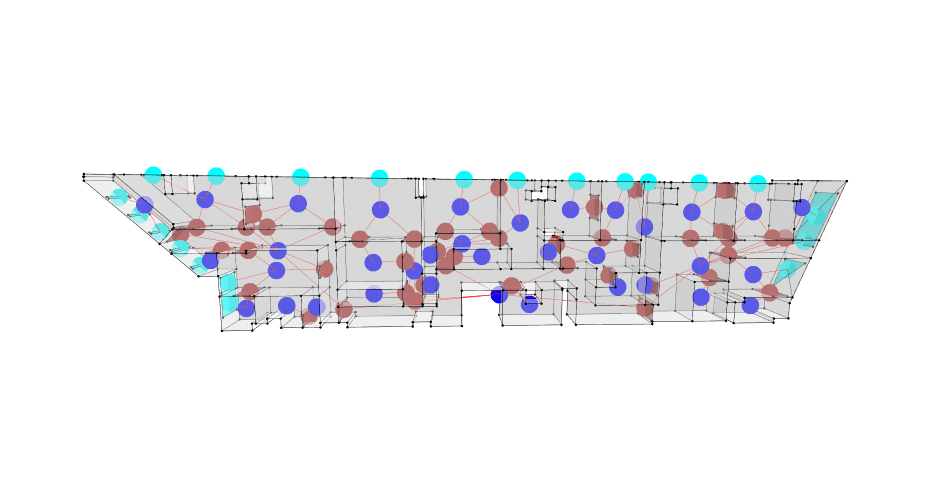
Stage 04 — Spatial Intelligence and Network Metrics
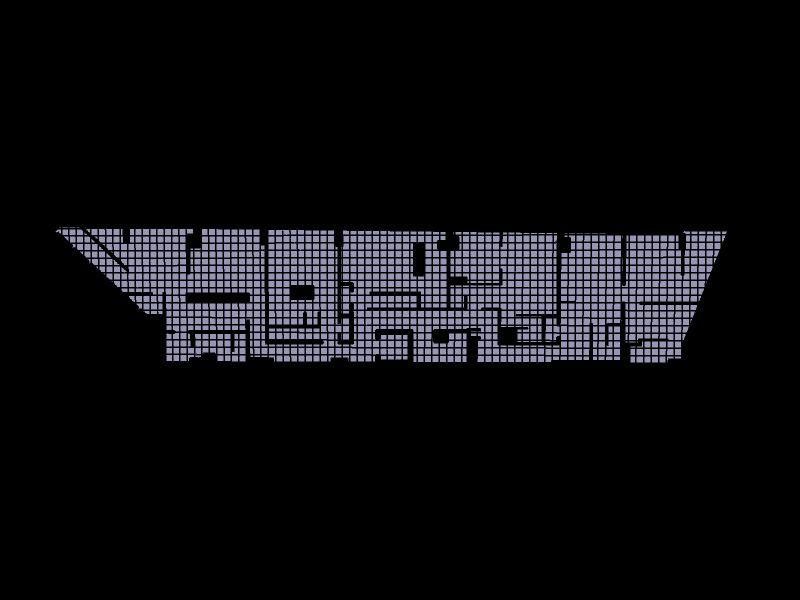
The fourth stage used graph-based spatial intelligence to understand how the plan works as a system of movement. A 0.5 m navigation grid was overlaid onto the floor plan, turning the space into a fine walkable mesh.
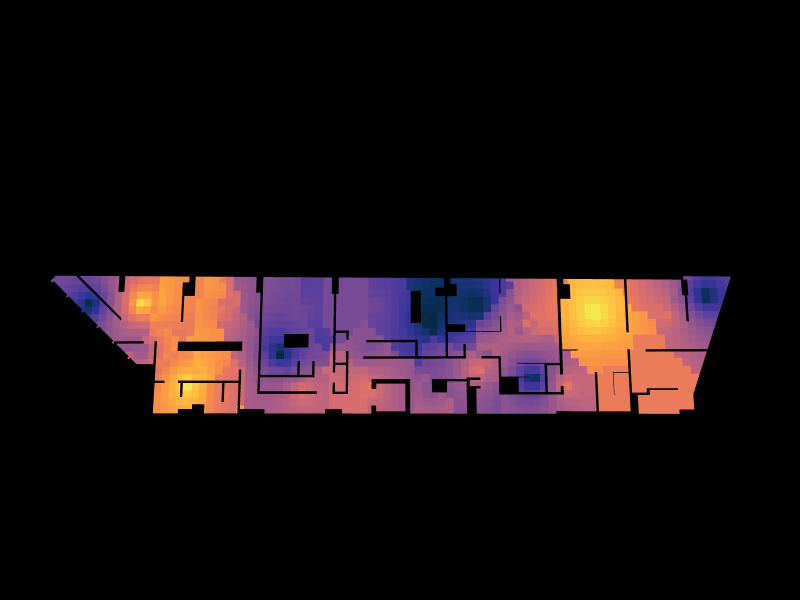
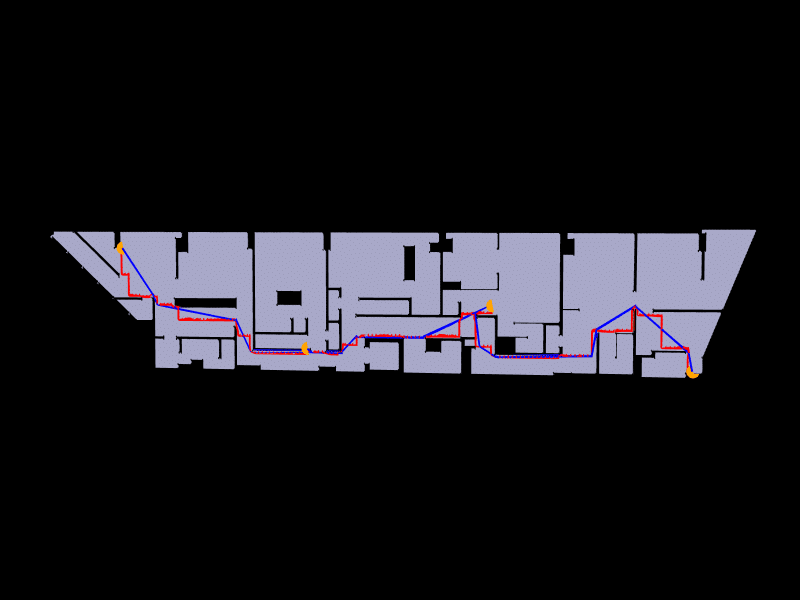
From this mesh and the room graph, the project computed spatial metrics such as closeness centrality, betweenness centrality, and community structure. These metrics reveal which spaces are more accessible, which ones operate as circulation bridges, and which groups of rooms form strongly connected clusters.
The analysis confirmed the role of the shared corridor as the main spatial backbone of the level. Corridor_002 emerged as the principal circulation hub linking the five duplex units.
Stage 05 — GraphSAGE Node Classification
The fifth stage tested whether a pretrained graph neural network could predict the room type of each node in the Habitar 7.2 graph.
Each room was encoded with seven node features related to zoning and connectivity, following the Modified Swiss Dwellings style. The graph was then passed into a pretrained GraphSAGE model built with PyTorch Geometric.
The important constraint is that the model was not retrained for Habitar 7.2. It was directly transferred from the Swiss housing dataset to this Colombian residential case study. This made the experiment a test of generalization: could learned spatial conventions from one housing dataset classify a different architectural plan?
Model Results and Classification Performance
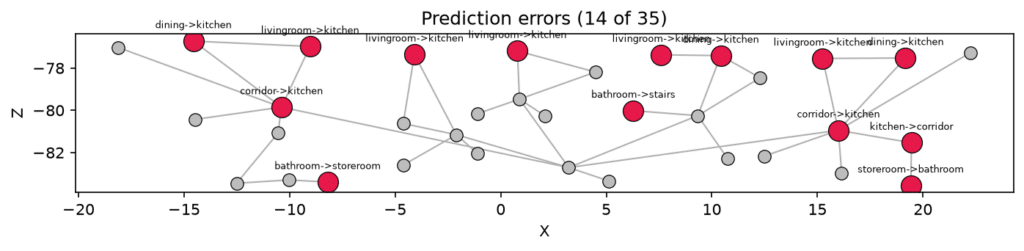
The model correctly classified 21 of 35 rooms, reaching an overall accuracy of 60%. This is a reasonable partial transfer, but the result is not evenly distributed across room types.
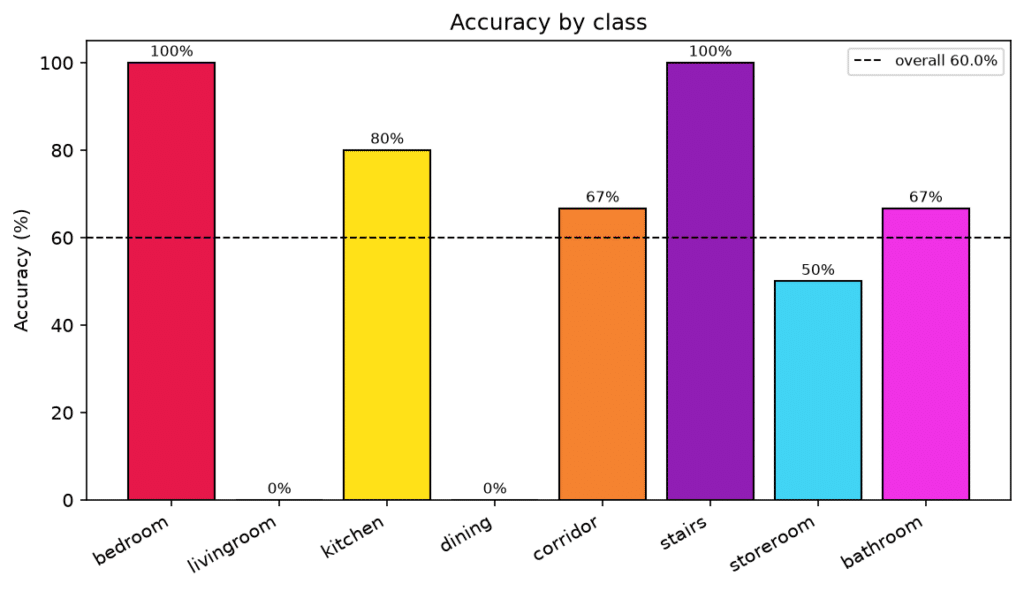
The model performed well where rooms had a distinctive topological position. Bedrooms and stairs reached 100% accuracy. Kitchens reached 80%, while corridors and bathrooms reached approximately 67%.
However, living rooms and dining rooms failed completely: both reached 0% accuracy. The model consistently collapsed these open-plan domestic spaces into the kitchen class.
Interpretation: Why Open-Plan Rooms Collapse into One Class
The most important finding is not simply that the model reached 60% accuracy. The important finding is where it failed.
The model sees adjacency, not full architectural geometry. When several spaces share the same zone and a similar connectivity pattern, they become almost indistinguishable to a graph that does not include area, proportion, facade contact, furniture, or geometric position inside the apartment.
Stairs and bedrooms have clearer topological signatures. Stairs are often connected in a specific chain or vertical-access condition. Bedrooms tend to occupy more terminal or low-degree positions. Their role is legible through connectivity.
Living rooms, dining rooms, and kitchens behave differently. In Habitar 7.2, they form open-plan domestic zones. They share neighbours, adjacency patterns, and circulation conditions. Without geometric features, the model has no strong way to separate them.
This means the limitation is not only algorithmic. It is also architectural. A graph that only encodes adjacency can understand certain kinds of spatial hierarchy, but it cannot fully understand the functional ambiguity of open-plan living.
Key Findings
- The pipeline runs end to end: geometry → graph → spatial analysis → prediction.
- Graph structure captures circulation hierarchy, especially the role of stairs and corridors as spatial backbones.
- Topologically distinctive rooms classify well because their connectivity signatures are clearer.
- Open-plan domestic programs are harder to classify when the model only receives adjacency and connectivity features.
- The main limitation is architectural as much as computational: the current features describe relationships, but not form.
Next Iteration: Features and Retraining
The current .pt model can only use the same seven features used during training. If new geometric attributes are added, the model must be retrained as a new version.
The next iteration should therefore include features that help separate rooms with similar adjacency patterns but different architectural roles.
- Area: to distinguish compact service spaces from larger social rooms.
- Aspect ratio: to capture room proportion and spatial character.
- Facade contact: to identify rooms related to light, ventilation, and exterior exposure.
- Apartment ID: to separate shared circulation from private domestic sequences.
- Relative position: to identify where a room sits within the apartment structure.
- Additional benchmarks: to compare Habitar 7.2 against more buildings from the Modified Swiss Dwellings dataset.
Conclusion: From Topology Toward Architectural Intelligence
This experiment shows that graph machine learning can extract meaningful spatial information from an architectural floor plan. It can identify circulation hierarchy, classify topologically distinctive rooms, and expose how a residential layout operates as a connected system.
At the same time, the project reveals a critical limit. Architecture is not only adjacency. Domestic space also depends on size, proportion, light, furniture, facade, thresholds, and cultural patterns of occupation. A graph can capture part of that intelligence, but not all of it.
For this reason, the next step is not to abandon graph-based methods, but to enrich them. A stronger architectural model should combine topology with geometry, spatial metrics, and environmental attributes. Only then can machine learning move from reading rooms as connected labels toward understanding them as architectural spaces.
Project Information
Project: Habitar 7.2 — Graph Machine Learning of an Architectural Floor Plan
Case study: Habitar 7.2, Bogotá, Colombia
Architects: Giancarlo Mazzanti + Alejandro Castaño
Workflow: Rhino, OBJ, TopologicPy, PyTorch Geometric, GraphSAGE
Dataset reference: Modified Swiss Dwellings
Team: David Agudelo, Daniel Zhang, Eduardo Martinez
