
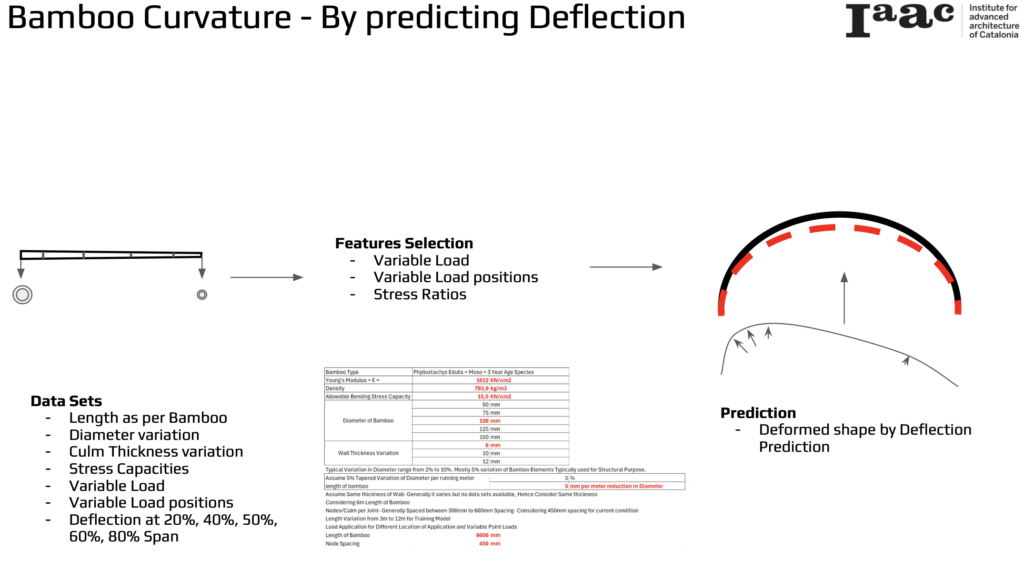
Our project harnesses the power of artificial intelligence to predict the deflection and curvature of bamboo elements, aiming to enhance their structural performance in various architectural and engineering applications. This innovative approach allows us to anticipate how bamboo will behave under different loading conditions, ensuring safety and efficiency in design.
By predicting the deflection and curvature of bamboo elements, we can optimize their structural performance. This approach not only ensures safety and reliability in architectural applications but also promotes the efficient use of bamboo as a sustainable building material.
Data Sets
To achieve accurate predictions, we utilize a comprehensive dataset that includes the following parameters:
- Length as per Bamboo: The natural length of the bamboo used.
- Diameter Variation: Variations in the diameter of the bamboo culms.
- Culm Thickness Variation: Differences in the wall thickness of the bamboo.
- Stress Capacities: The allowable stress the bamboo can endure.
- Variable Load: Different loading conditions applied to the bamboo.
- Variable Load Positions: The positions where the loads are applied on the bamboo.
- Deflection at 20%, 40%, 50%, 60%, 80% Span: Measurements of deflection at various spans of the bamboo.
Features Selection
For effective prediction, we focus on three key features:
- Variable Load: The different loads that can be applied to the bamboo.
- Variable Load Positions: The varying positions at which these loads are applied.
- Stress Ratios: The stress distribution across the bamboo element.
Methodology
Our methodology involves the following steps:
- Data Collection: Gathering data on bamboo properties, including Young’s Modulus, density, allowable bending stress, diameter, and wall thickness variation.
- Feature Selection: Identifying the critical features that influence bamboo deflection and curvature.
- Prediction Model: Developing an AI model to predict the deflection of bamboo under various conditions.
Prediction
Using the selected features, our AI model predicts the deformed shape of the bamboo by calculating the deflection. The prediction includes the following steps:
- Load Application: Applying different load conditions to the bamboo.
- Stress Analysis: Analyzing the stress distribution across the bamboo.
- Deflection Prediction: Predicting the deflection and resulting curvature of the bamboo.
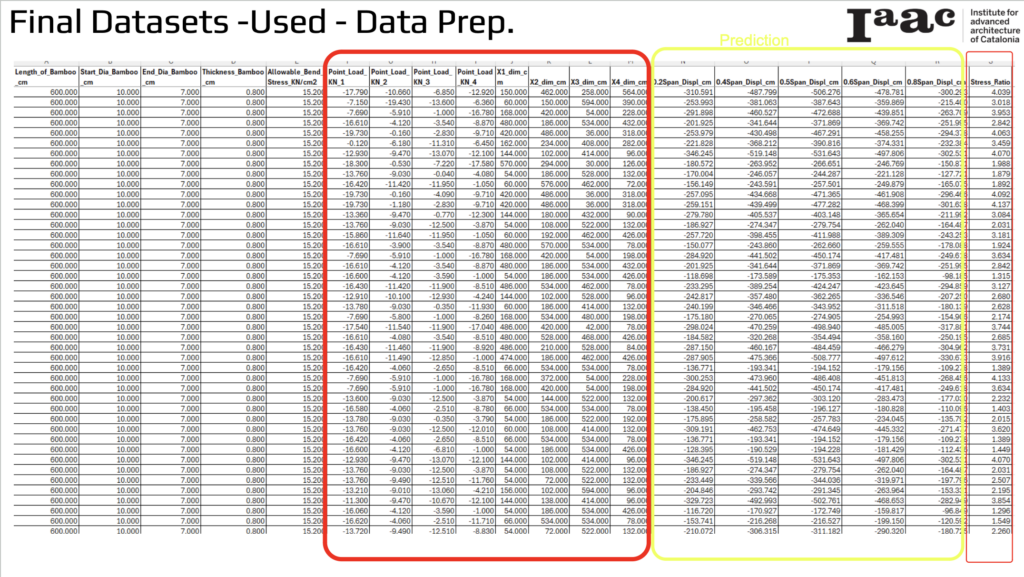
Final Datasets -Used – Data Prep.
The dataset begins with the length of the bamboo (600 cm), followed by its start diameter (10 cm) and end diameter (7 cm). The wall thickness is uniformly 0.8 cm, and the allowable bending stress is recorded at 15.20 KN/cm². These parameters establish the physical characteristics of the bamboo.
Next, the dataset includes variable loads applied at different points (KN 1, KN 2, KN 3, KN 4) with varying values and dimensional data (X1, X2, X3, X4). These values provide a detailed view of the structural characteristics.
The dataset also records displacement measurements at various spans (0.2 span, 0.4 span, 0.5 span, 0.6 span, 0.8 span), showing how the bamboo deflects under different conditions. Additionally, the stress ratio indicates the ratio of applied stress to the allowable stress.
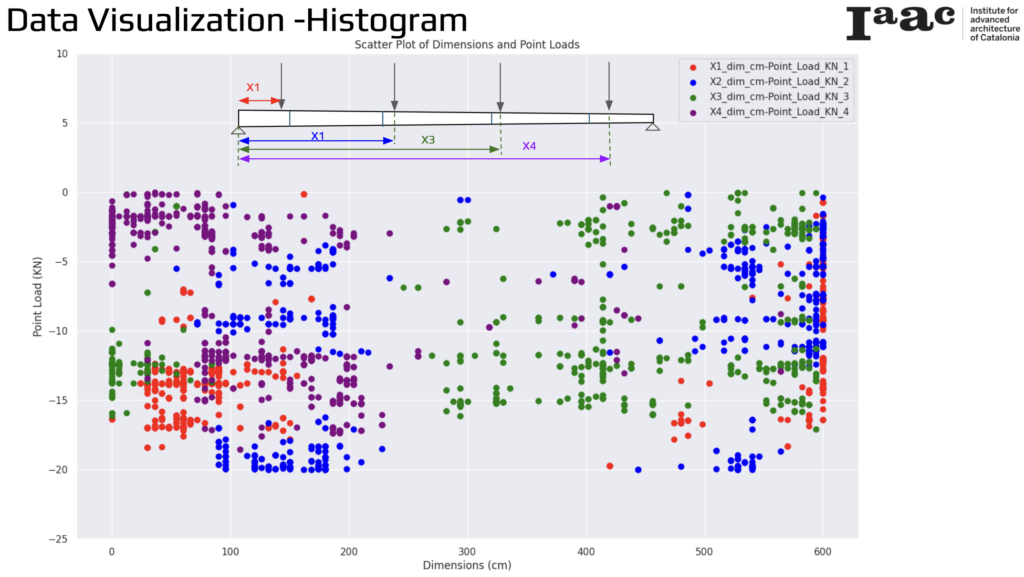
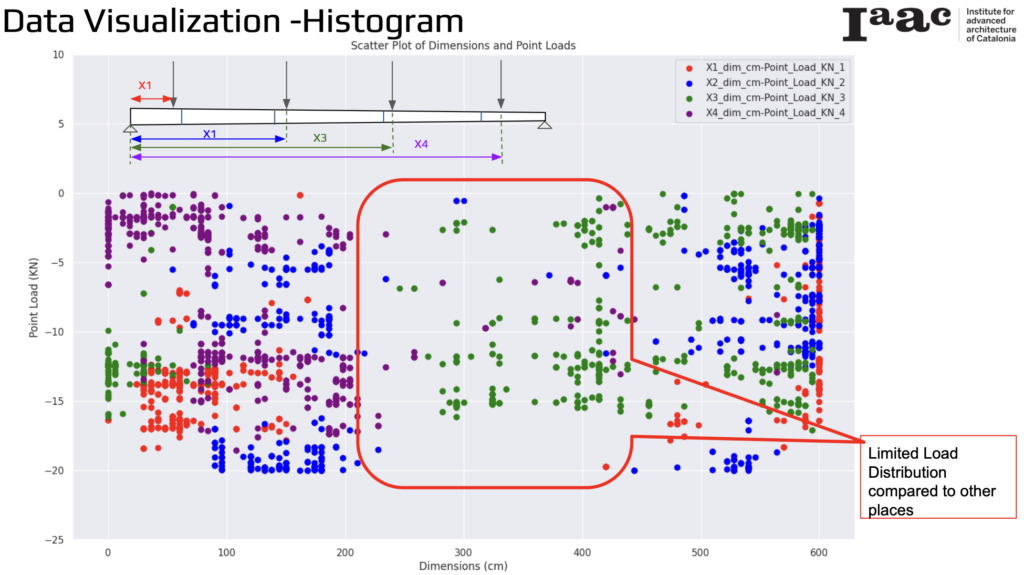
Data Visualization – Histogram of Bamboo Point Loads
The histogram visualizes the dimensions and point loads applied to bamboo elements through a scatter plot. The data represents multiple point loads applied to the bamboo, each identified by different colors: red for the first point load (X1), blue for the second point load (X2), green for the third point load (X3), and purple for the fourth point load (X4).
The Y-axis shows the point load values (KN) applied to the bamboo, while the X-axis represents the dimensions (cm) along the length of the bamboo. The scatter plot highlights that the point loads are predominantly applied near either end of the bamboo, as the data points are clustered at these positions.
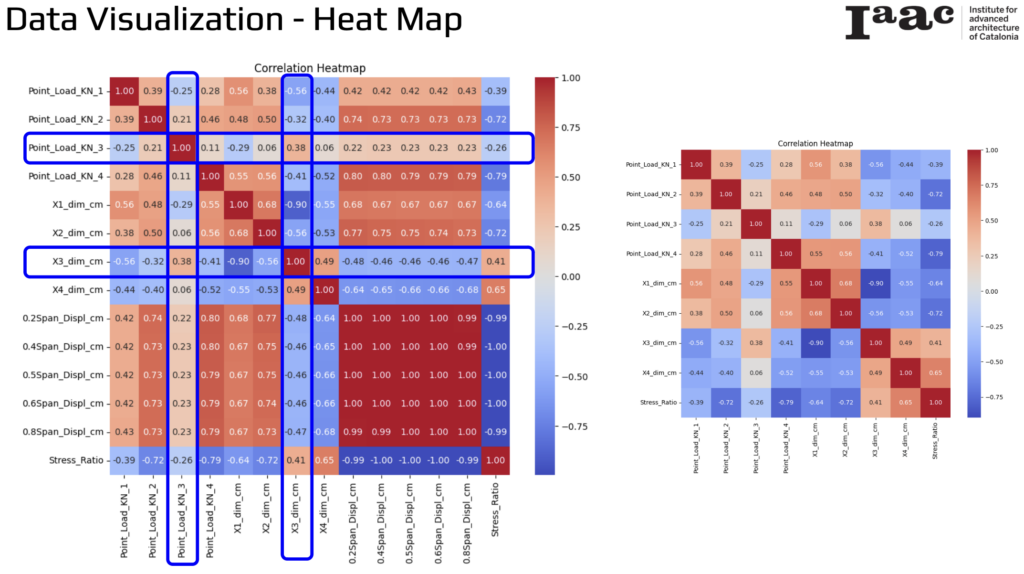
Data Visualization – Heat Map
The correlation heat map shows the relationships between various point loads, dimensions, displacements, and the stress ratio. Displacements at different spans (0.2Span_Displ_cm to 0.8Span_Displ_cm) are highly correlated with each other, with correlation values near 1, indicating they behave similarly under different loading conditions. These displacements also show a strong negative correlation with the stress ratio, with values near -1, suggesting that as displacement increases, the stress ratio decreases.
Additionally, dimensions X1_dim_cm to X4_dim_cm exhibit strong inter-correlations, indicating a significant relationship between the different dimensions of the bamboo. The heatmap provides a visual representation of these correlations, with darker red colors indicating positive correlations and darker blue colors indicating negative correlations.
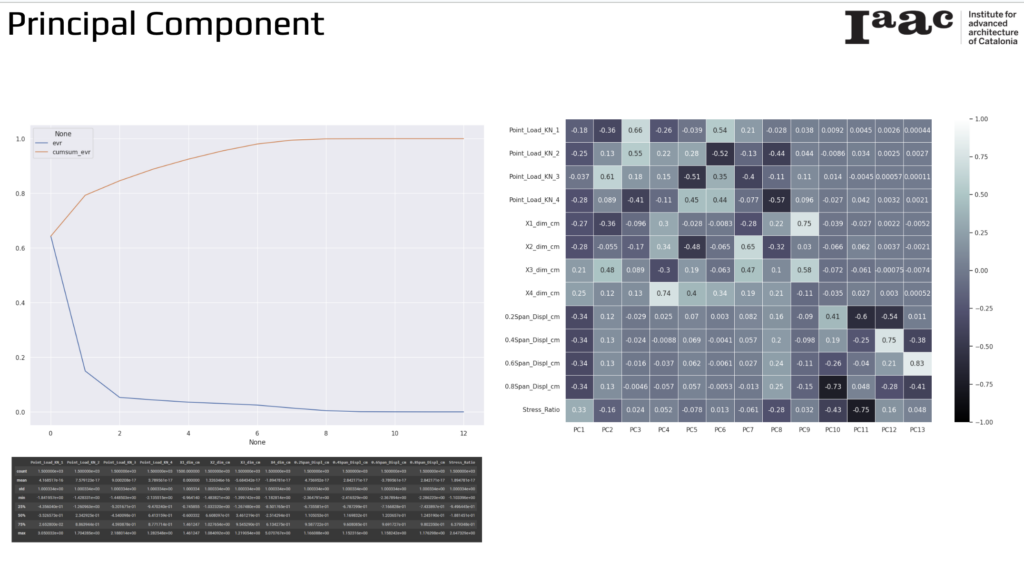
Principal Component
Principal Component Analysis (PCA) was performed on our bamboo deflection dataset. The cumulative explained variance ratio (cumsum_evr) reaches its maximum around the seventh principal component, indicating that the first seven principal components capture most of the variance in the dataset.
The PCA loadings show how each variable correlates with each principal component (PC). Notably, PC1, PC2, and PC3 have significant correlations with the load dimensions and displacement data. For instance, PC1 shows strong correlations with dimensions such as X3_dim_cm and X4_dim_cm, while PC2 and PC3 are correlated with various point loads and displacement measurements
Next Steps in the Research: Approaches for Predicting Displacement and Load
In the next phase of our research, we will explore four distinct approaches to enhance our predictive models for displacement and load in bamboo elements. These approaches leverage various combinations of input variables to provide comprehensive insights and optimization of bamboo structural performance.
- Approach A: We will use 4 load points and 4 load positions to predict displacement. This approach focuses on understanding how different loading conditions affect the displacement of bamboo elements.
- Approach B: This method incorporates 4 load points, 4 load positions, and the stress ratio to predict displacement. By adding the stress ratio, we aim to improve the accuracy of our displacement predictions under varying stress conditions.
- Approach C: In this approach, we will combine 4 load positions and 5 displacement measurements to predict the load. This will help us understand the relationship between displacement and the applied loads more effectively.
- Approach D: We will utilize 5 displacement measurements, 4 load positions, and the stress ratio to predict load. This comprehensive approach aims to provide the most accurate load predictions by considering the interplay between displacement, load positions, and stress ratios.
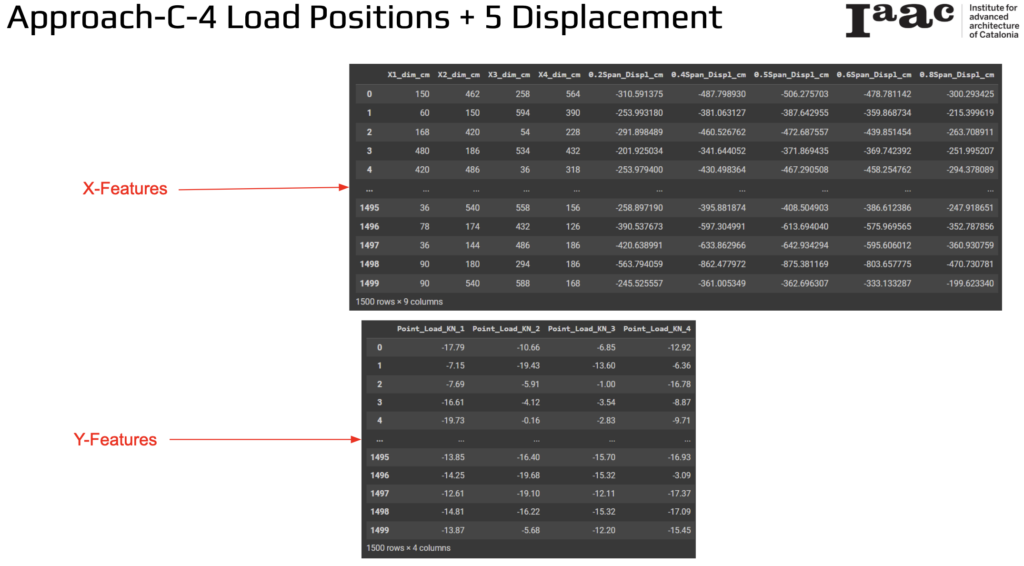
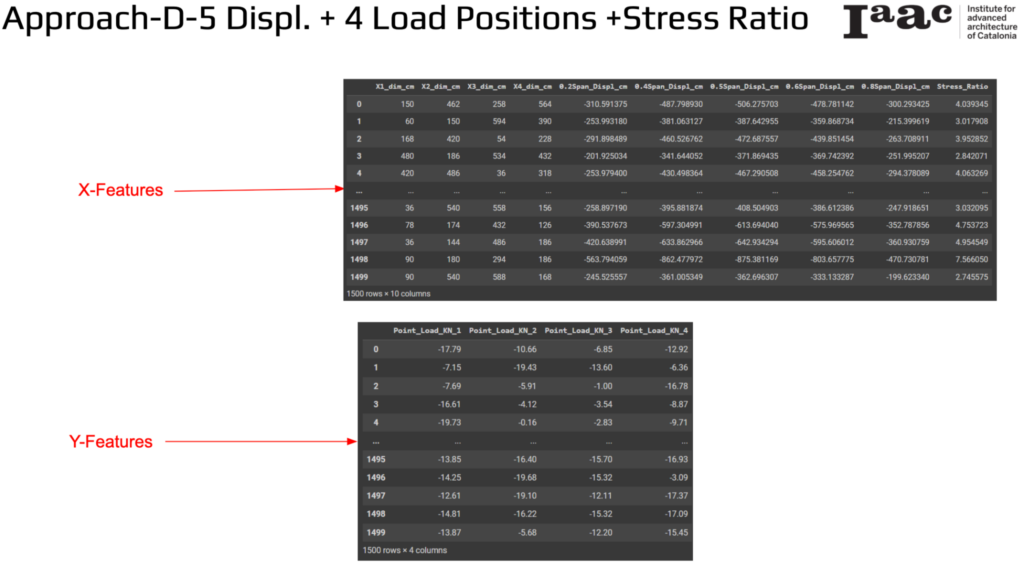
Approach C: 4 Load Positions + 5 Displacement
Our first approach focuses on predicting load using 4 different load positions and 5 possible displacement values measured along the total length of the bamboo element. These displacements are recorded at 20%, 40%, 50%, 60%, and 80% of the element’s span.
X-Features
The input variables, or X-Features, include:
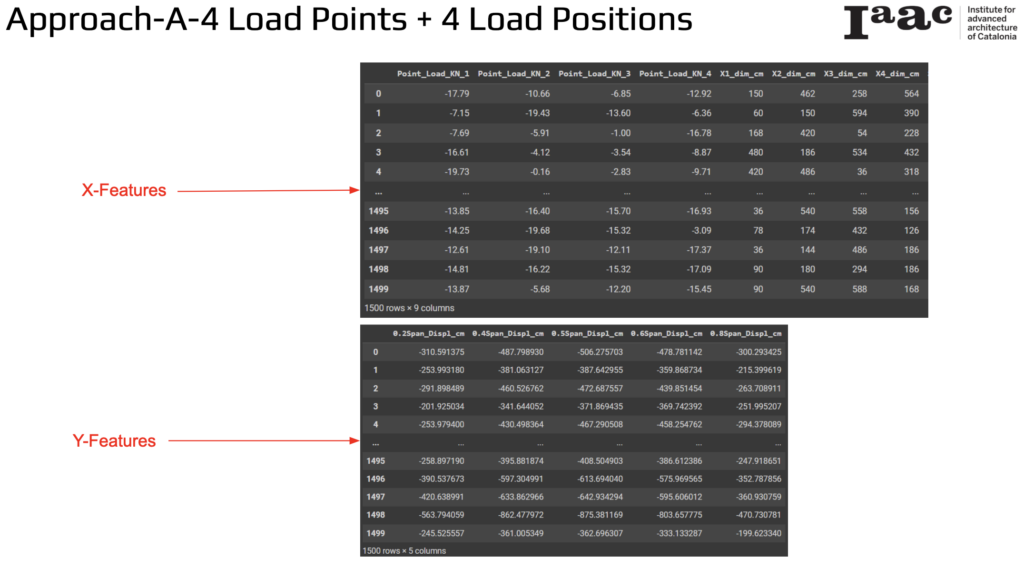
- Dimensions (X1_dim_cm to X4_dim_cm): Measurements at different positions along the bamboo.
- Displacement Values (0.2Span_Displ_cm to 0.8Span_Displ_cm): Displacement measurements taken at 20%, 40%, 50%, 60%, and 80% spans of the bamboo element.
Y-Features
The output variables, or Y-Features, consist of:
- Load Values (Point_Load_KN_1 to Point_Load_KN_4): The loads applied at different positions along the bamboo.
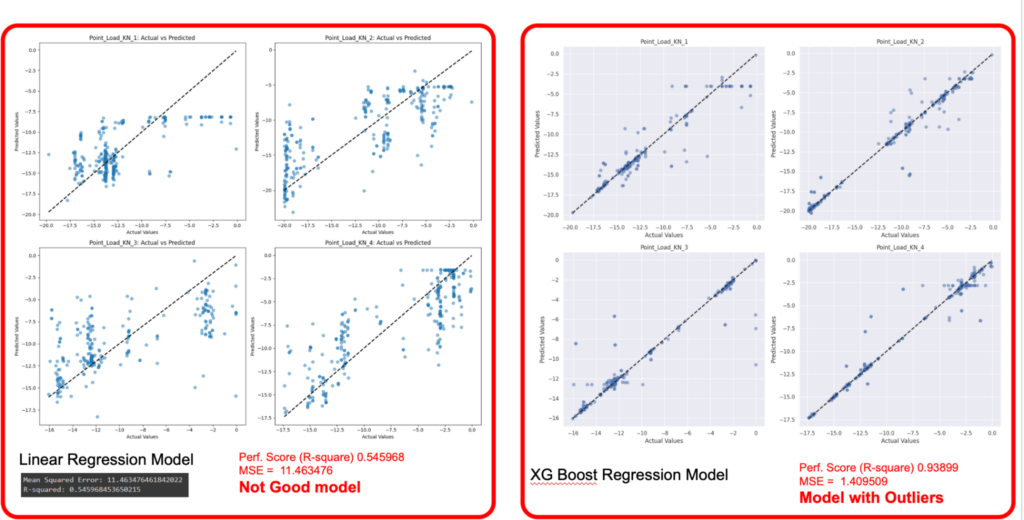
In our analysis, we compared the performance of two regression models—Linear Regression and XGBoost Regression—for predicting the point loads on bamboo elements.
Linear Regression Model
The Linear Regression model’s performance is visualized through scatter plots of actual vs. predicted values for four different point loads (KN 1, KN 2, KN 3, KN 4). The performance metrics for this model are as follows:
- R-squared (Performance Score): 0.545968
- Mean Squared Error (MSE): 11.463476
The scatter plots indicate that the model’s predictions deviate significantly from the actual values, particularly for larger loads. The low R-squared value and high MSE suggest that the Linear Regression model is not a good fit for this dataset.
XGBoost Regression Model
The XGBoost Regression model’s performance is also visualized through scatter plots of actual vs. predicted values for the same four point loads. The performance metrics for this model are significantly better:
- R-squared (Performance Score): 0.93899
- Mean Squared Error (MSE): 1.409509
The scatter plots for the XGBoost model show a much closer alignment between the predicted and actual values, indicating a more accurate model. The high R-squared value and low MSE demonstrate that the XGBoost model performs well even in the presence of outliers, providing more reliable predictions for the point loads.
In this visualization, the scatter plot highlights a significant observation regarding the distribution of point loads along the bamboo elements. While point loads are primarily concentrated near either end of the bamboo, the central section exhibits limited load distribution. This indicates that, compared to other areas, the middle portion of the bamboo experiences fewer applied loads. Understanding this uneven load distribution is crucial for analyzing the structural performance of the bamboo and optimizing load placement for better stability and efficiency.
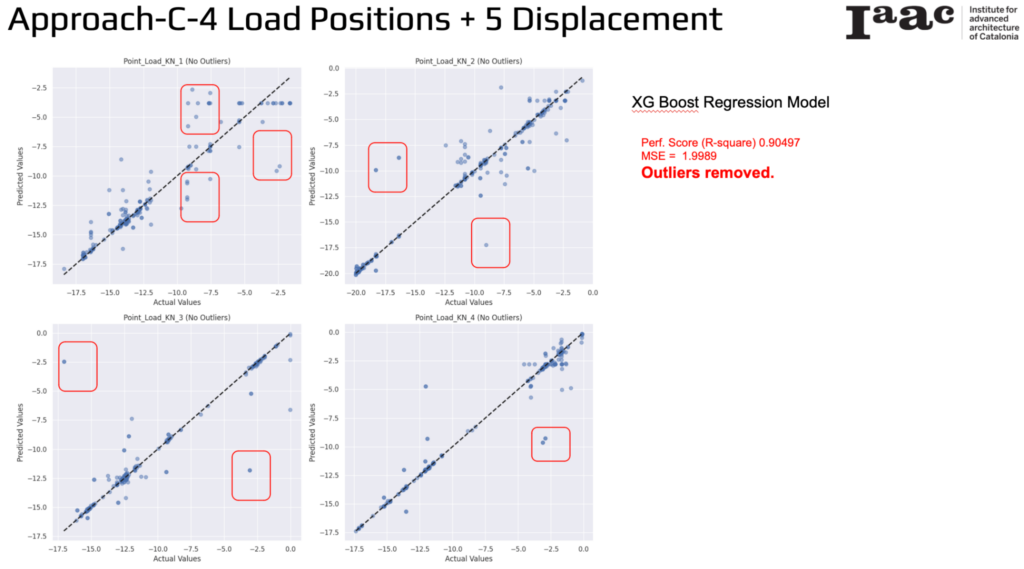
The XGBoost results for predicting point loads based on 4 different load positions and 5 displacement measurements show a significant improvement after removing outliers. The performance metrics for this model are:
- R-squared (Performance Score): 0.90497
- Mean Squared Error (MSE): 1.9989
The scatter plots of actual vs. predicted values for the four point loads (KN 1, KN 2, KN 3, KN 4) illustrate the following:
- The predicted values closely align with the actual values along the diagonal, indicating a good fit.
- Certain areas, previously identified as containing outliers, have been highlighted and removed to enhance the model’s performance.
By removing outliers, the XGBoost Regression model achieves higher accuracy and better predictive performance.
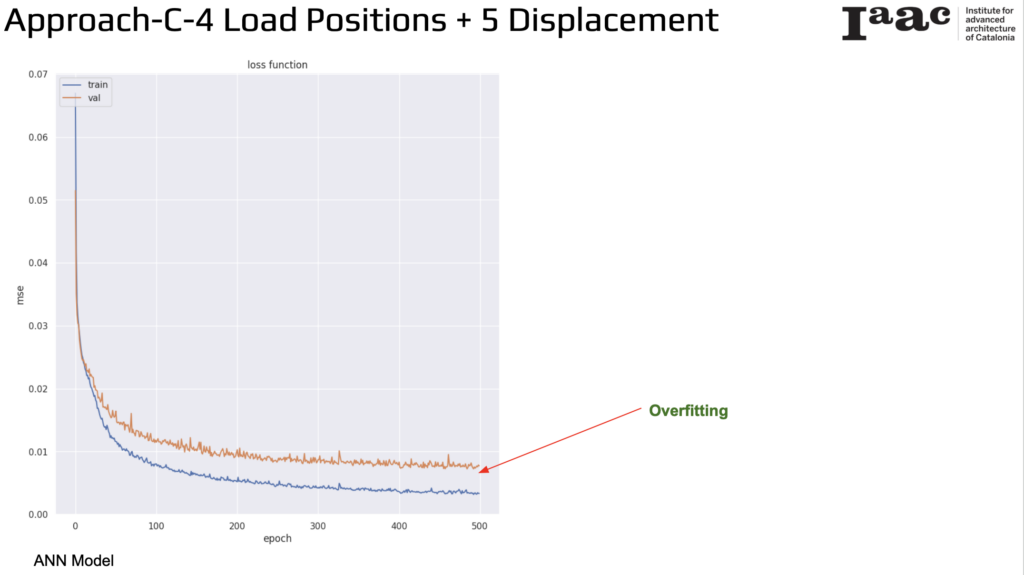
The results from the ANN model for predicting point loads based on 4 load positions and 5 displacement measurements reveal an issue of overfitting. The training loss and validation loss are plotted against the number of epochs. Initially, both training and validation losses decrease, indicating that the model is learning and improving. However, as training progresses, the training loss continues to decrease, while the validation loss starts to plateau and slightly increase. This divergence suggests that the model is fitting too closely to the training data, capturing noise and becoming less generalizable to new data.
Approach D: 5 Displacement Values + 4 Load Positions + Stress Ratio
In this approach, 5 displacement values along with 4 load positions and the stress ratio values are used to predict point loads. This integrates the stress ratio with the displacement and load position data to enhance the predictive model. By incorporating the stress ratio, this method aims to provide a more comprehensive understanding of how stress influences load distribution and displacement in bamboo elements.
In this approach, we used the same methodology as in previous analyses to compare the performance of Linear Regression and XGBoost Regression models for predicting point loads based on 5 displacement values, 4 load positions, and stress ratio values.
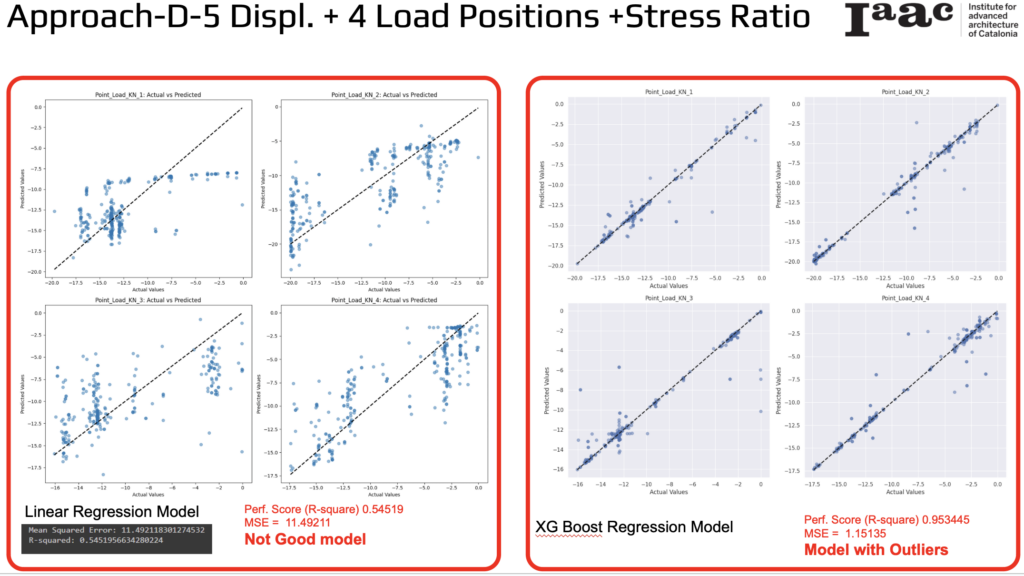
Linear Regression Model
- R-squared (Performance Score): 0.54519
- Mean Squared Error (MSE): 11.49211
The plots indicate that the predicted values often diverge significantly from the actual values, especially for larger loads. This is reflected in the low R-squared value and high MSE, demonstrating that the Linear Regression model is not an adequate fit for the data and performs poorly in predicting the point loads.
XGBoost Regression Model
- R-squared (Performance Score): 0.953445
- Mean Squared Error (MSE): 1.15135
These metrics suggest a significant improvement in prediction accuracy compared to the Linear Regression model. The scatter plots demonstrate that the XGBoost model provides precise predictions, with values closely following the actual data points along the diagonal. This enhancement is notable even with the inclusion of outliers, underscoring the robustness and superior predictive capability of the XGBoost Regression model over the Linear Regression model.
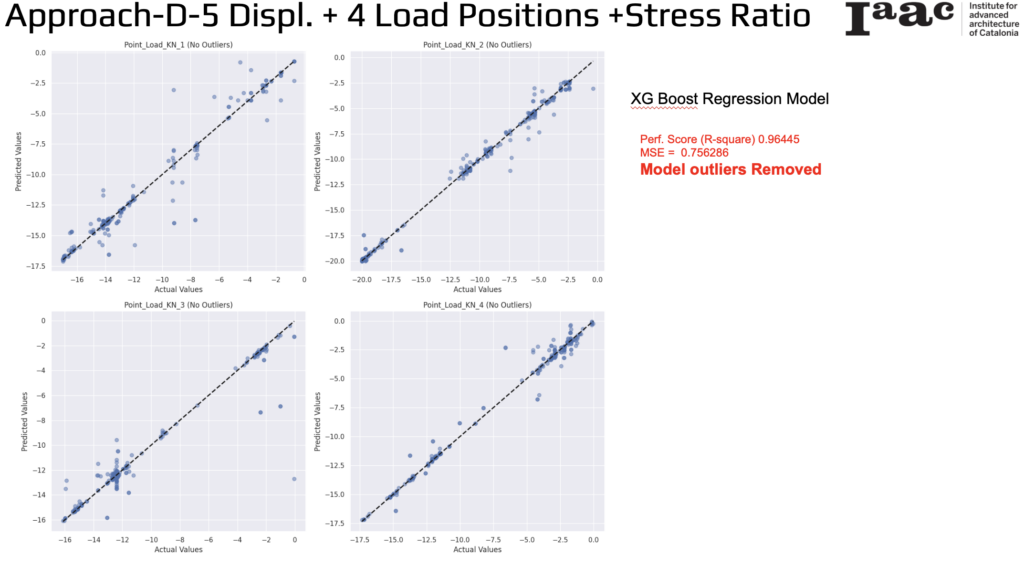
By removing the outliers, the MSE significantly improves to 0.756286, indicating a more accurate model.
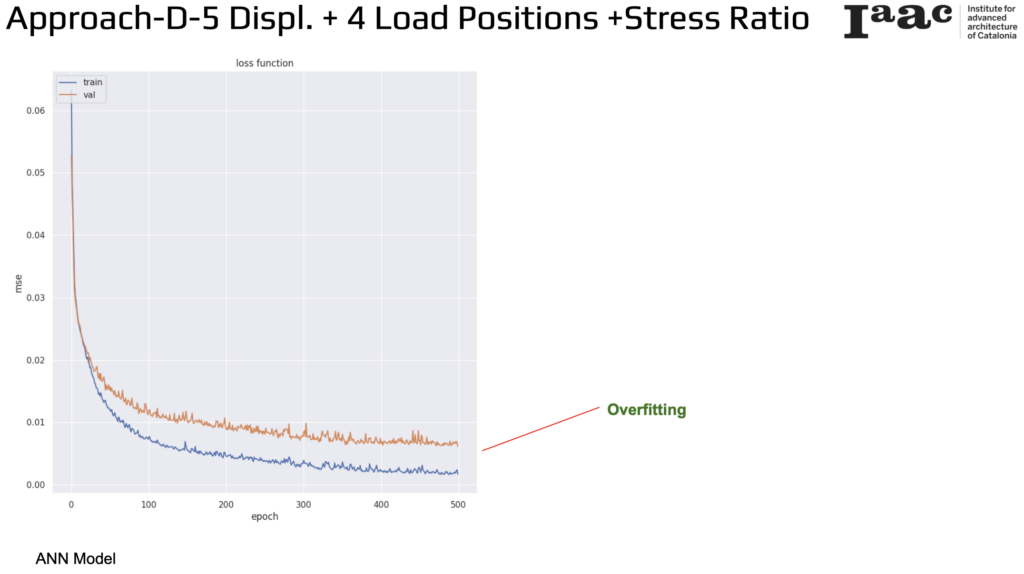
In the training and validation loss curves of the Artificial Neural Network the training loss steadily decreases, indicating good learning on the training data. Initially, the validation loss also decreases, but it begins to plateau and slightly increase in later epochs, suggesting overfitting.
Approach A: 4 Load Points + 4 Load Positions
In this approach, the focus is on predicting displacement using 4 load points and 4 load positions.
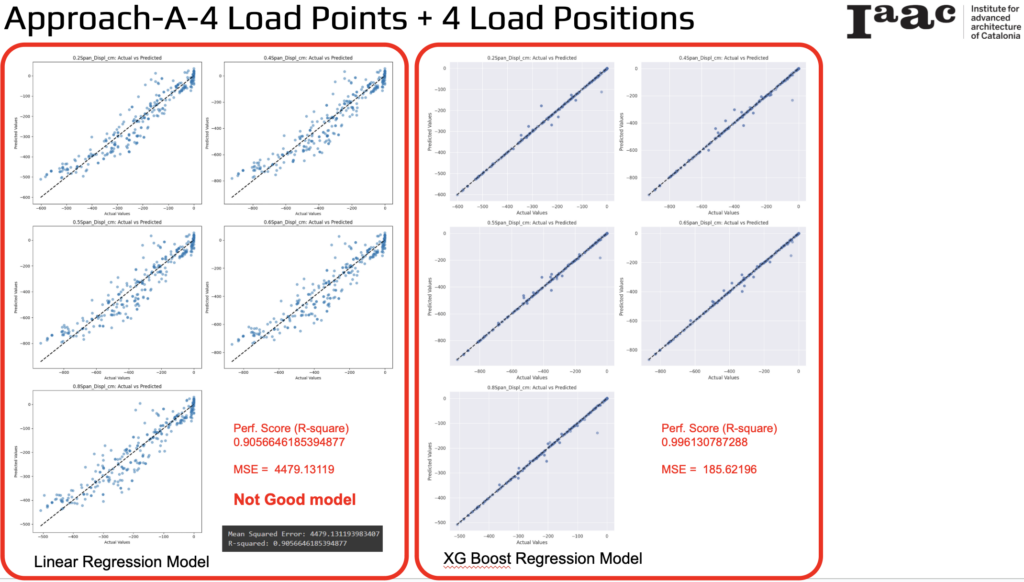
Linear Regression Model
- R-squared (Performance Score): 0.9056646185394877
- Mean Squared Error (MSE): 4479.13119
XGBoost Regression Model
- R-squared (Performance Score): 0.996130787288
- Mean Squared Error (MSE): 185.62196
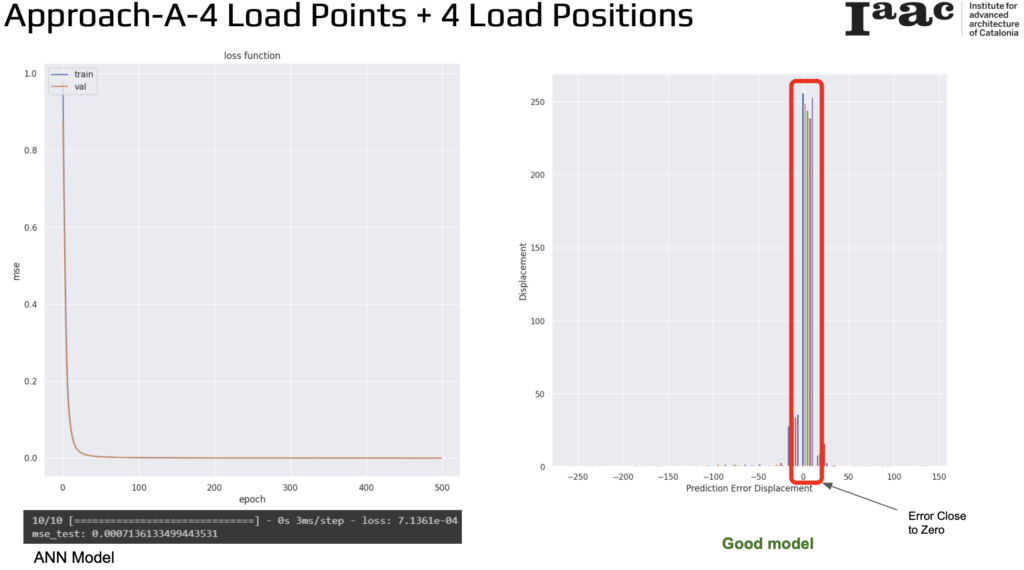
For the Artificial Neural Network model the final mean squared error (MSE) on the test data is extremely low at 0.0007136133499443531. Overall, this model demonstrates excellent performance in predicting displacement values based on load points and positions, with both training and validation losses converging to a low value and prediction errors being minimal.
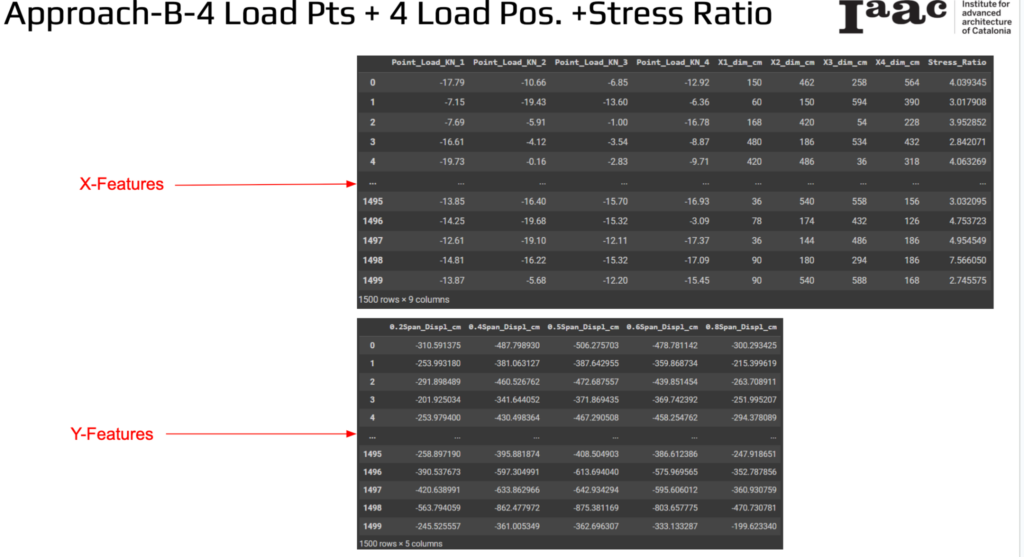
Approach B: 4 Load Points + 4 Load Positions + Stress Ratio
For the final approach, we chose the combination of load points and stress ratio as the X-features, and displacement as the Y-features.
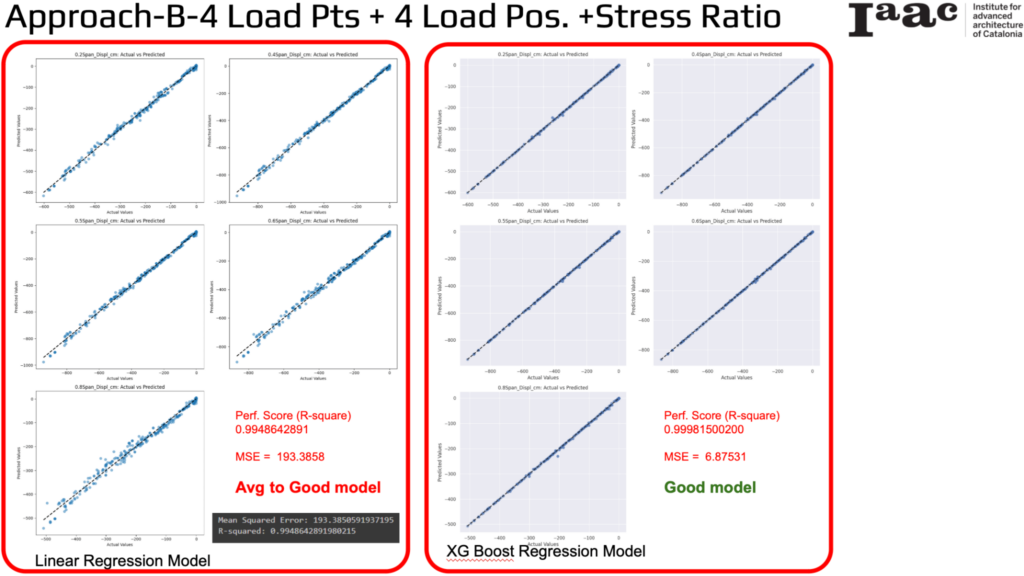
Linear Regression Model
- R-squared (Performance Score): 0.9948642891
- Mean Squared Error (MSE): 193.3858
The scatter plots indicate a close alignment between predicted and actual values, demonstrating that the model performs reasonably well. However, there are slight deviations, especially for higher displacement values.
XGBoost Regression Model
- R-squared (Performance Score): 0.99981500200
- Mean Squared Error (MSE): 6.87531
Again, these metrics indicate a significant improvement over the Linear Regression model as the scatter plots demonstrate that the XGBoost model reflects very high accuracy.
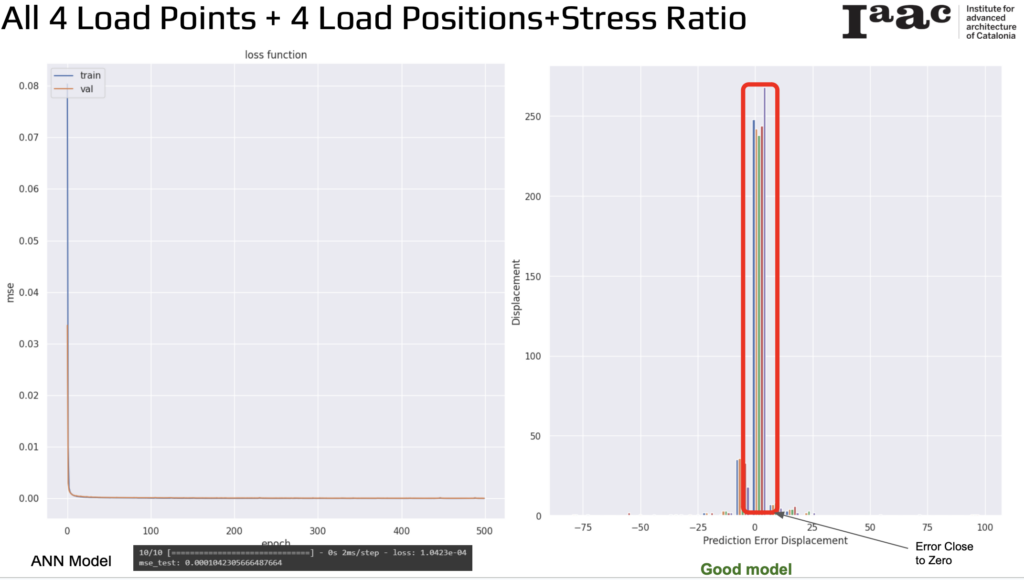
For the Artificial Neural Network model, the final mean squared error (MSE) on the test data is extremely low at 0.0001042305666487664. Overall, this model demonstrates excellent performance in predicting displacement values based on all 4 load points, 4 load positions, and stress ratio.
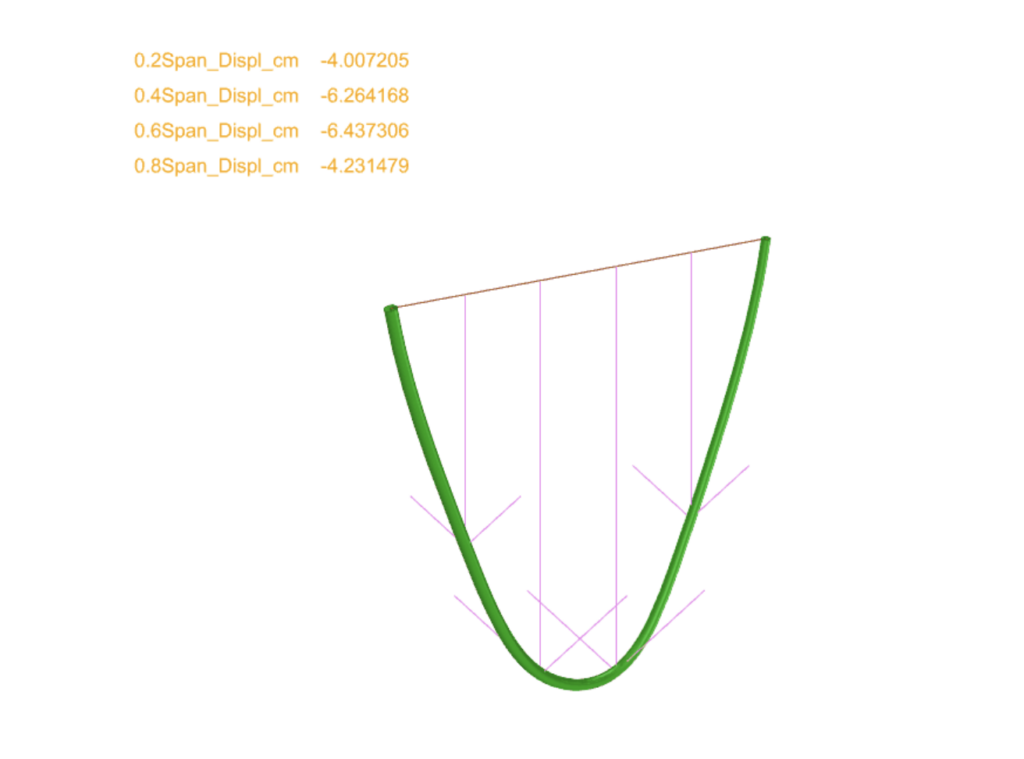
Visualization in Grasshopper
Given its superior performance, this approach was chosen for export our data to Grasshopper for visualization of the results.

