
London is a city with high density of bike lane networks, and the high costs on metro drives people using bike more. But how people interact with different factors such as tree canopy, amenities and the urban form?
Data preparation
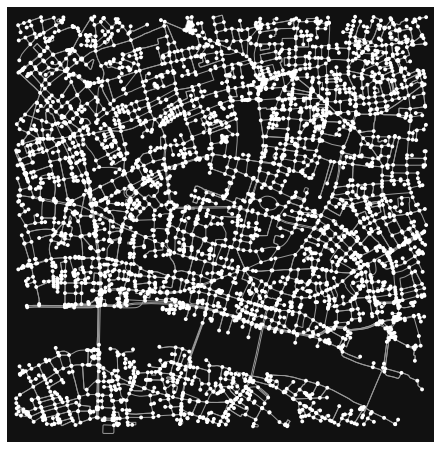
To start the analysis, I download the bike lane network sample area from Openstreetmap.
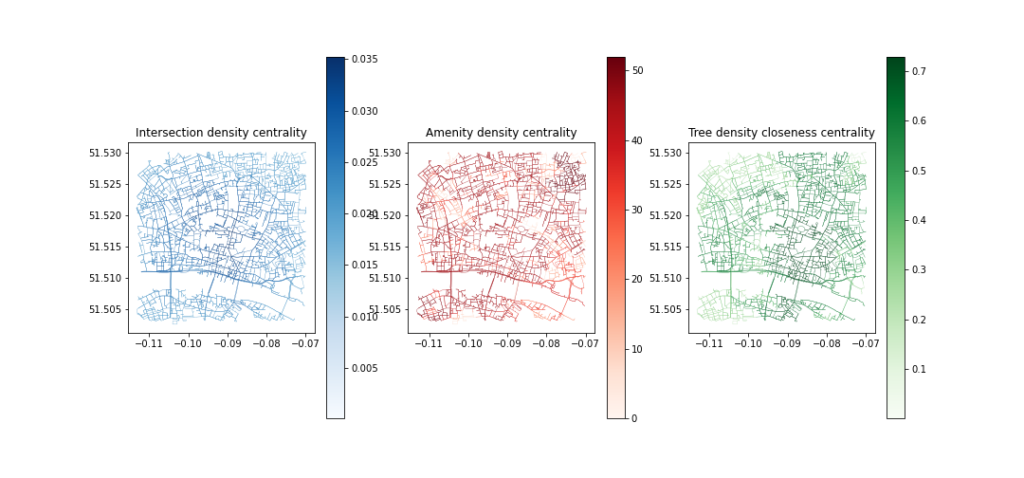
Urban form
Analyzing the density of intersections from the length of streets and numbers of connected streets.
Amenity density
I download the amenity data from Openstreetmap, including bar, restaurant, cafe and fast food. The amenity density is calculated by number of amenities per km for each street segments.
Tree density
Tree density is also calculated by number of trees per km for each street segments.
Then I calculated the closeness centrality for each factor for further analysis.
Traffic counting data
London has a manual traffic counting system, but the counting points are not covering each streets. To get the data for each streets, I generate isochrones for each counting points, and get the average number for each streets.
In the traffic counting data, I separated the data by summer and other seasons, and the number of cyclists have different patterns.
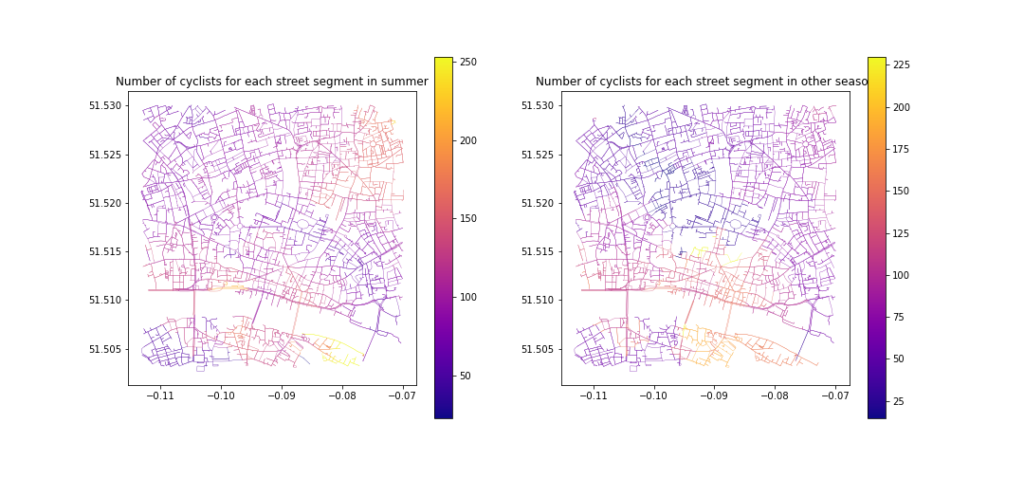
Summer seasons less people choose to cycle. Cyclists can be identified more in the area with lower density of intersections and also lower density of trees.

Conclusion from the maps
From the analysis, The pattern of people cycling in the city differs from sunny hot summer and other seasons. Summer seasons less people choose to cycle. Cyclists can be identified more in the area with lower density of intersections and also lower density of trees. Especially in summer, the streets with high tree density can have less cyclits being identified. For ameinity density, cyclits are tend to choose the streets with less amenities but the correlation is not very clear.
