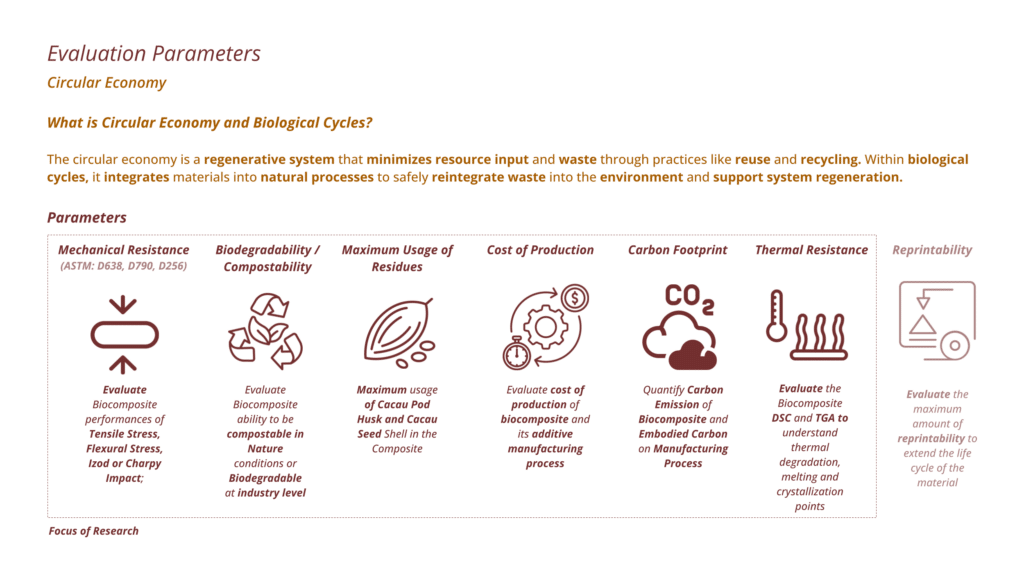
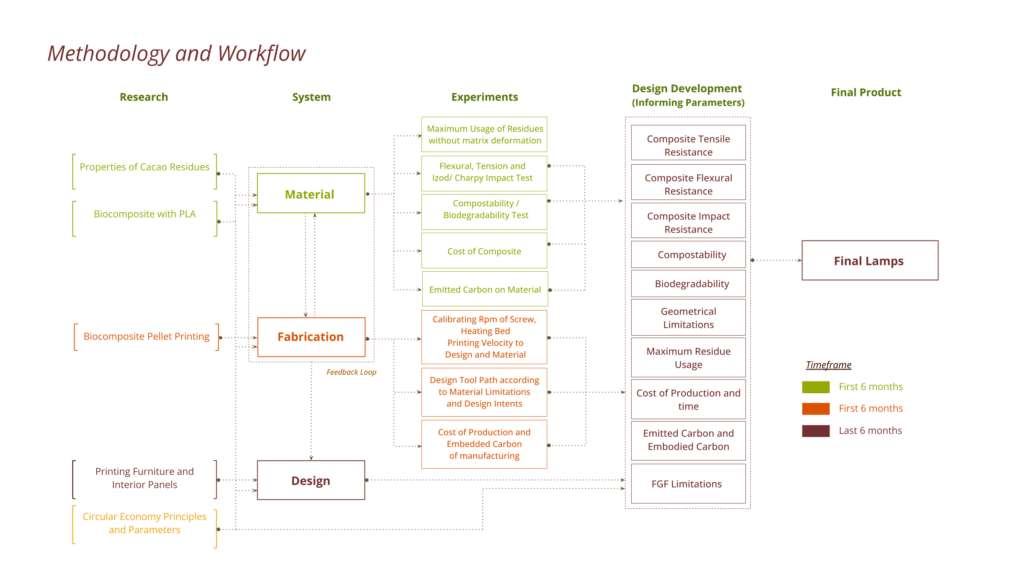
For this term experiments and tests were conducted for the evaluation markers of the biocomposite of PLA with different charges of Cacau Seed Shell and the Fabrication performances of each biocomposite charges. Tests on mechanical perfomances such as Tensile Strenght, Flexural Stress and Izod Impact were conducted. Compostability tests were also setup in the range of 6 months and to be evaluatng the loss of mass. Quantification of Carbon Footprint of manufacturing process from A1 to A3 (sourcing the material, transportation and manufacturing processes). Thermal Resistance were also evaluated to measure the degradation temperatures and losses of masses as well as optimal temperatures for layer adhesion, melting point for extrusion and crystallization temperatures and degrees. These tests and quantifications were evaluated side by side with the information on the additive manufacturing tests, printability, and control of gradient of each charge to understand how the material properties inform printing and how printing tests could use each material perfomance.
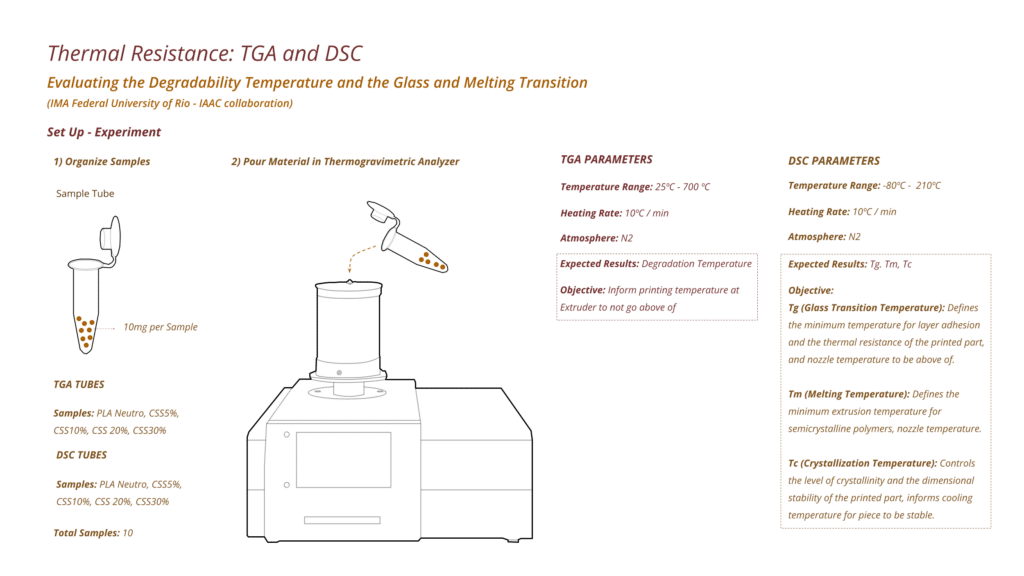
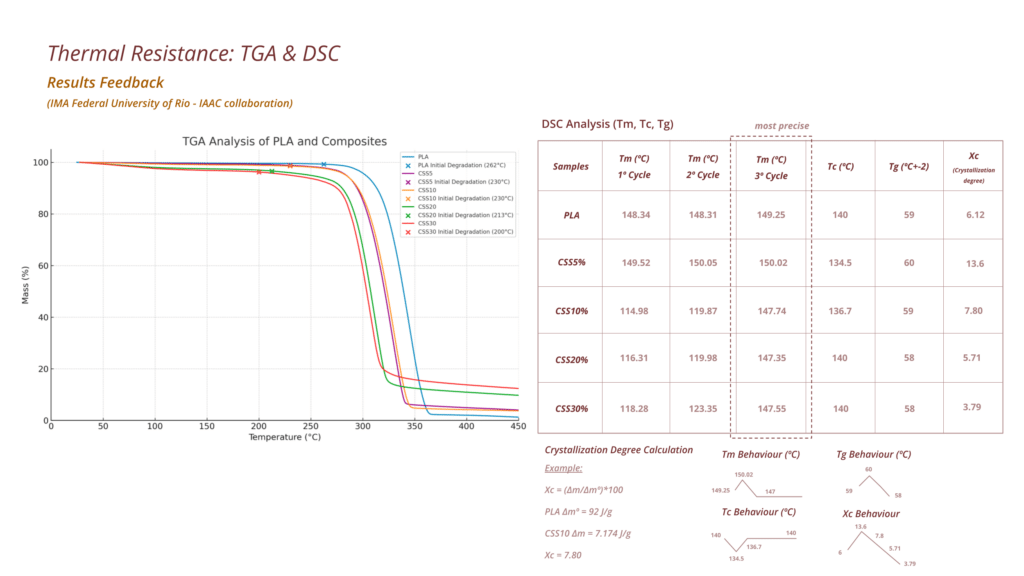
In the side of the Material Tests it started with the Thermal Resistance, which is to conduct TGA and DSC tests. A TGA (Thermogravimetric Analysis) test measures the change in a material’s mass as it is heated, to analyze thermal stability and composition. A DSC (Differential Scanning Calorimetry) test measures the heat flow into or out of a material as it is heated or cooled, to study thermal transitions. Both TGA and DSC were executed considering Neutral PLA with a heat charge, as it main of comparison to other charges, PLA with charges of Cacau Seed Shell of 5%, 10%,20%,30% (named CSS5, CSS10, CSS20, CSS30 respectively). The aim for the TGA tests is understand which are the printing temperatures for each charge, for the extruder to not go above and start disintegrate the biocomposite and understand if the addition of Cacau Seed Shell is helping the stabilizing of the polymer or not. As for the DSC the aim is to observe the optimal TG, TM, and TC for each charge to understand the minimal temperature for layer adhesion, the temperature on the nozzle for melting point and the temperature of colling down and crystallization of the piece, and understand if the addition of the CSS to the matrix has a linear behaviour or if it acts as and effective nucleating agent.
What we could observe in the TGA results is the increase of leftover mass as the composite has more charges of CSS and the creation of instability of the biocomposite chain of polymer. As for the DSC it is possible to observe a non linear behaviour for the Tm, Tc and Tg and Xc (Melting Temperature, Crystallization Temperature , Glass Transition Temperature and Crystallization Degree). From Neutral PLA to CSS5 we can observe an increase of the melting temperature, the glass transition and the cristallization degree, and a reduce on the crystallization temperature. This means that the distribution of CSS5% on the PLA is making the biocomposite to consume less energy of the chain of polymers to solidy in the crystallization phase, therefore the significantly increase in the crystallization degree and at the same time a higher energy to break the same chain of polymer and charge to go into fusion phase. This in the literature it is called effective nucleating agent of the added charge. We can also observe the same nucleating agent behaviour on the TGA where the CSS5% leaves the same amount of residues as CSS10% which it is double its charge.
As we increase the CSS charges from 5% to 10%, 20% 30% we can observe a linear behaviour of reducing the Melting Temperature, increase of the Crystallization Temperature, decrease of the Glass Transition Temperature and significantly decrease of the crystallization degree, making the biocomposite behaves less like a glass (prone to breakage) and more resistance to impact. This happens because of the the amount of dispersion and proportion of the charge throughout the polymer being compounded together. More CSS charges need more exothermic energy for the chain of polymers to bound together and endothermic energy for it to enter on fusion stage (melting).
This informs that most of the temperatures for printing are significantly low for all of these charges in order for the print to be sucessful, also relying more on the power of the motor to crush and push the material out (values of the RPM).
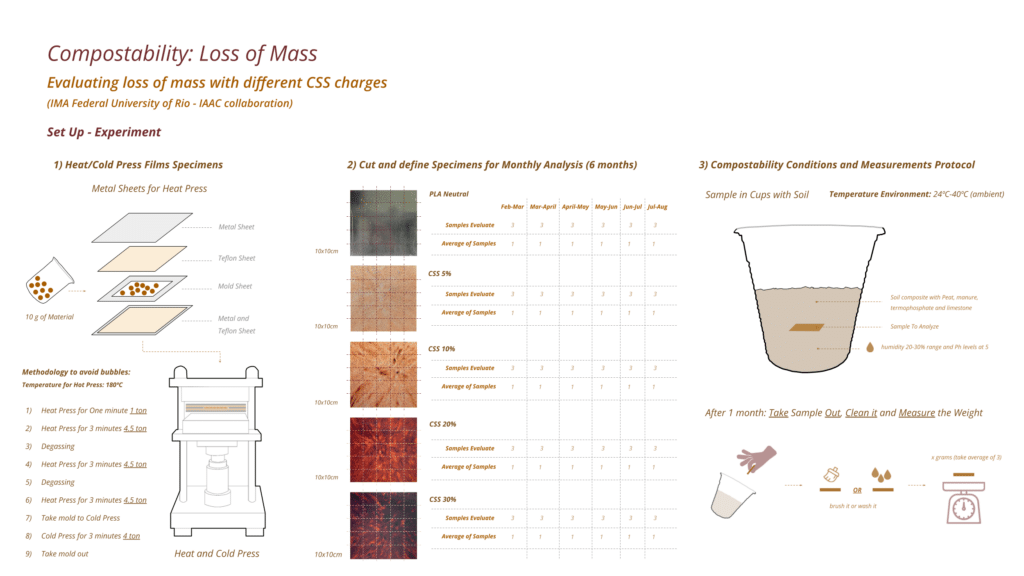
Another test that were executed to evaluate the perfomance of the charges was the compostability tests and its relationship of velocity of loosing mass. In order for a biocomposite out of a polymer to be considered biodegradable the tests need to be in a range of 6 months of evaluation if it shows a significantly loss of mass. The Set Up of the experiment was creating films out Neutral PLA, CSS5%, CSS10%, CSSS20%, CSS30% utilizing 10g of pellets for each charge and utilizing a heat press and a cold press machine. Different timing and pressure in tons were used in order to fabricate theses films that were 10x10cm squares. Than, each square was cutted into 25 squares of 2x2cm each so we can evaluate 3 specimens of loss of mass for each month. We are utilizing the triplice methodology to obtain less erros in the quantification, and taking the arithmetic average and standard deviation. After creating the squares we position each in a plastic cup containing earth with peat, manure, limestone and thermophospate in an ambient temperature ranging from 24ºC to 40ºC, in a Ph level of 5 and a humidity range of 30%. For each take of the evaluted month the 3 specimens are collected from the cup, cleaned with a brush and measure on a scale and documented.
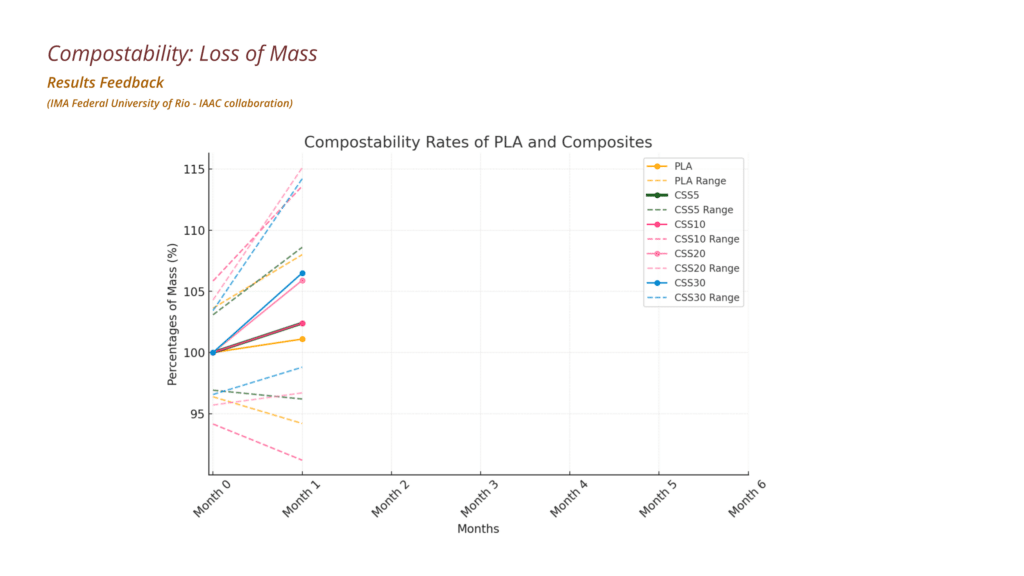
From the month 0 (initial measures) to the first month we can observe that as the CSS charges increases we have a significantly increase of the mass (CSS30% on its maximum of the standard deviation increased 15% of mass). This happens, accordingly to literature, because both the PLA and the CSS are higrophilic materials and in the first 3 months of its process of decomposition it is going to pass through a swelling process , accumulate water, bacteria and decomposition agents, than start to loose mass from month 4 to 6. Demonstrating that not only the behaviour is expected accordingly to literature but the as we increase CSS30 charges we are also increasing its compostability rates.
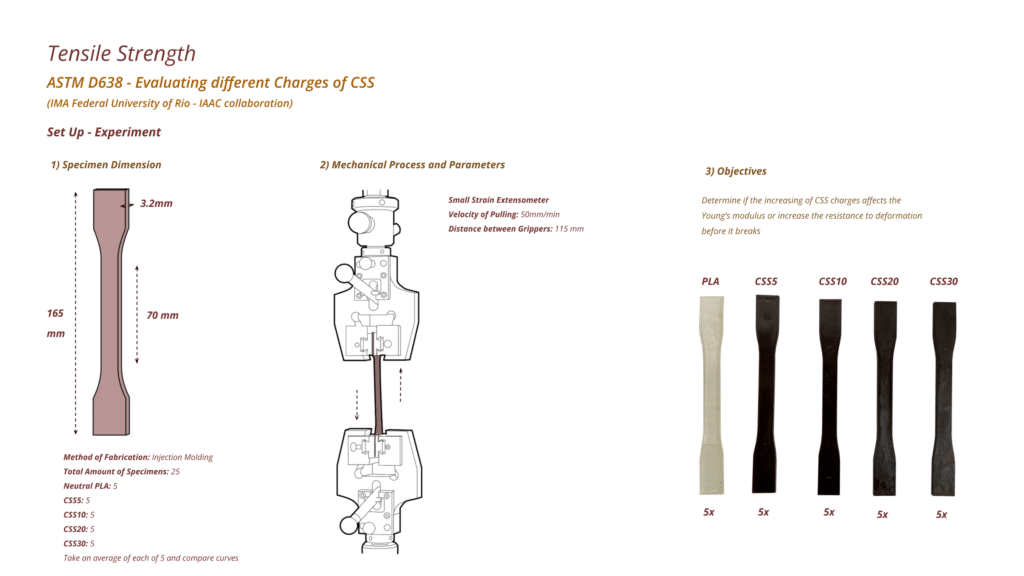
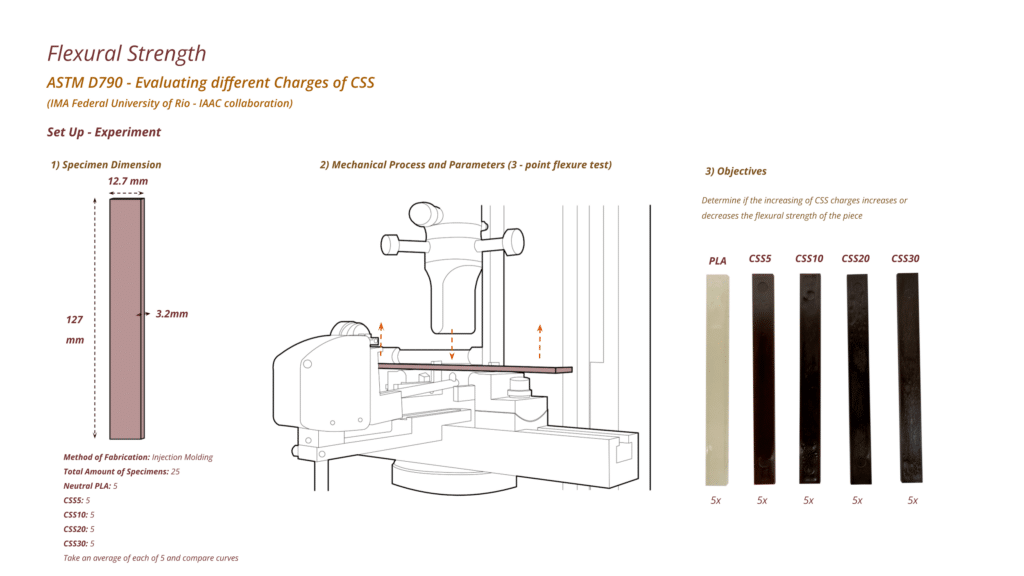
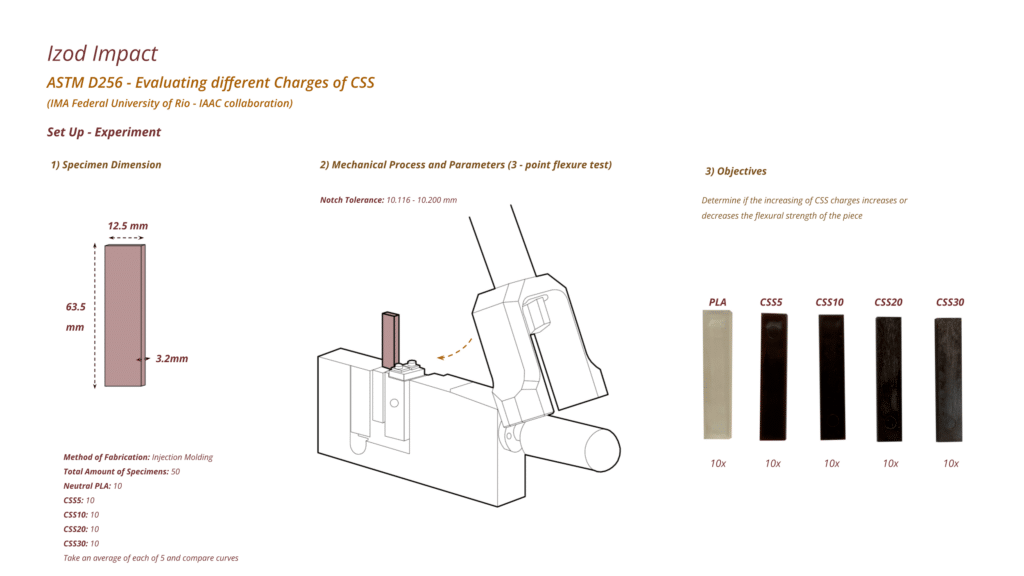
Mechanical tests were executed as well to understand the impact of the addition of CSS charges. Following the ASTM norms for plastics, specimens for Tensile Strenght, Flexural Strenght and Izod Impact (ASTM D638, ASTM D790, ASTM D256). For Tensile Strenght a total of 25 speciments were injected, couting 5 for each charge (5 PLA, 5 CSS5 and etc). This is to guarantee the margin of error and get the average of behaviour. Velocity of Pulling was set to 50mm/min and distance between grippers of 115mm. Specimens that were injected we can see a different in brightness, colour and surface texture from the increase of charges.
As for Flexural Strenght the same number of specimens were injected for each charge and for the Izod Impact 10 specimens for each charge were injected and the notch tolerance was set to 10.116 – 10.200 mm. Results of all these tests are going to be available 28th of March and cross referenced with the crystallization degree of each charge.
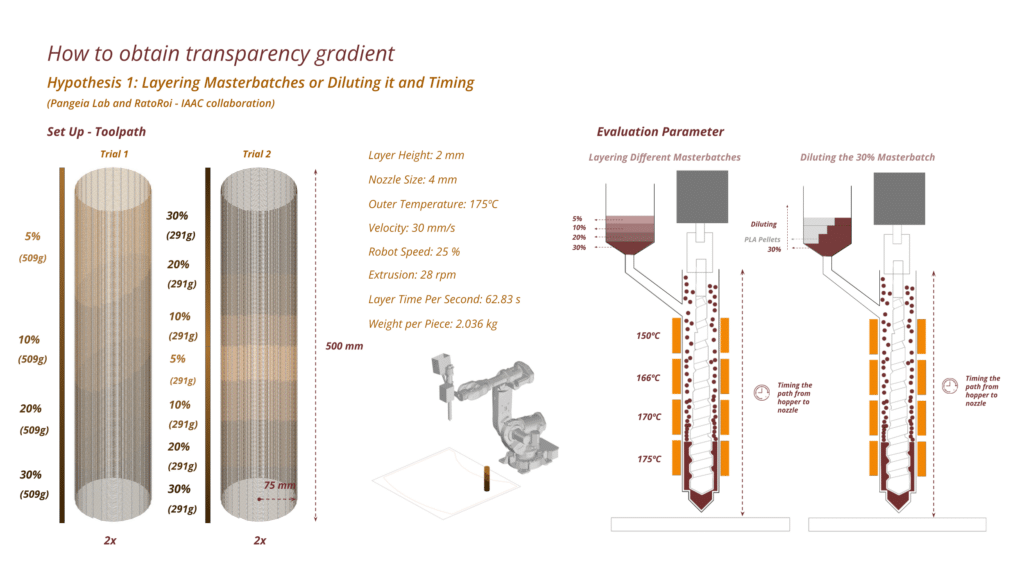
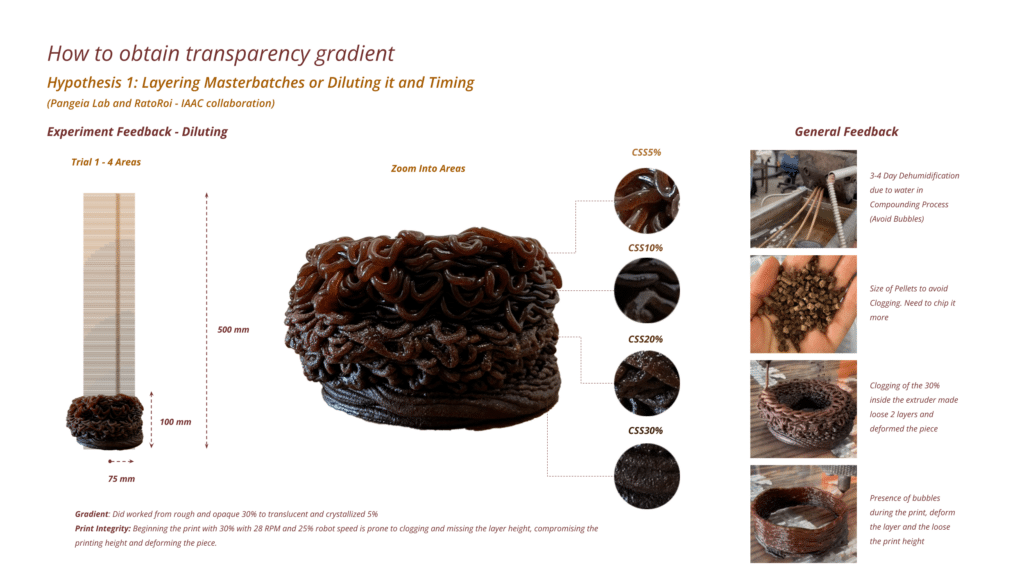
For the Fabrication Tests, different hypothesis of how to generate gradient of opaque-translucent and surface texture (smooth to rough) were executed to understand of how to have control on the same printing object of the multiple CSS charges. The first hypothesis was to layer each charge on the hopper according to time that gets from the hopper to the nozzle and the quantity it needs to be on the printing specimen, in order to evaluate if the different charges in a particular order in the hopper could generate gradient of transluncency and surface texture. Two Specimens were designed one with 4 areas of expected ranges of colours and other with 7 areas of colours, these specimens have 509 g and 291 g of material in each area. Temperatures parameters are set it up according to diagram, nozzle size of 4 mm , velocity of printing of 30 mm/s, robot speed percentage of 25% and extrusion of 28 rpm. Layer time per second of 62s.
As another hypothesis taking the same two specimens of evaluation is to take CSS30% as its main masterbatch and dilute it with Neutral PLA to obtain the other charges in the same piece. Printing parameters are set the same as the previous hypothesis.
For the first hypothesis we can observed that the layering method only showed translucency in the first beginning of the specimen with 4 colour areas and the rest of the colour areas remained as a mix of the other Charges. Pointing that inside the extruder the different charges are being mixed and not differentiating it on itself. Printing failures were noticed as well like the print integrity and loose of the layer height. These are due to temperature and timing of drying of the pellets before printing, because on the compounding process it passed through water to crystallize it, and during the print it was noticed bubbles that altered the layer height by increasing the margin of accumulated errors on printing height. Another failure noticed that affected the printing integrity and the layer height was the clogging of the printing process due to the different sizes of pellets that got out from the compounder machine. Lastly the temperature set up also demonstrated that the biocomposite was not adhering well between layers compromising the printing height. All in all, even if the printing mistakes were not noticed and maintained the integrity of the piece, the layering method of the charges on the hopper was not demonstrating the gradient of translucency and surface texture for specimens of 4 areas and 7 areas.
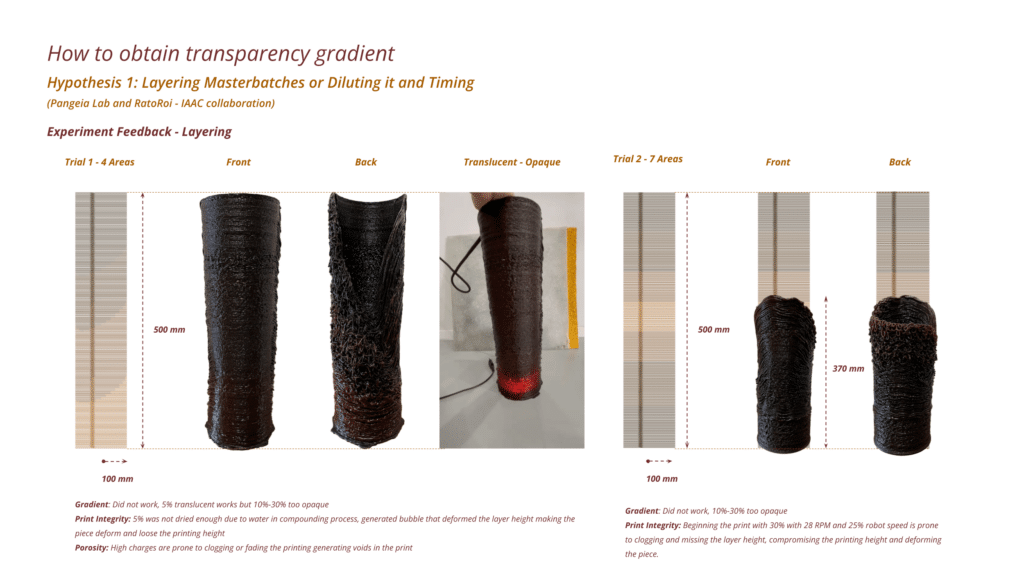
The second hypothesis was the diluting method using the CSS30% as a masterbatch and diluting it the other areas with neutral PLA. This method worked in terms of diluting it but the same printing demonstrating different charges in the same piece and the gradient of translucency. However the same failures of printing integrity were also persistence in this hypothesis, due to dehydration time, size of pellets and temperature setup.
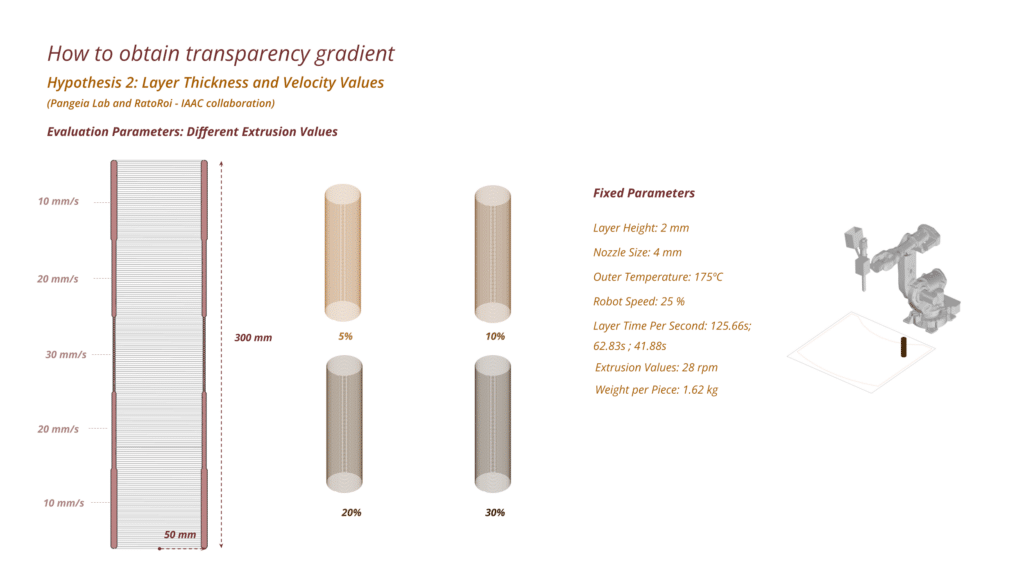
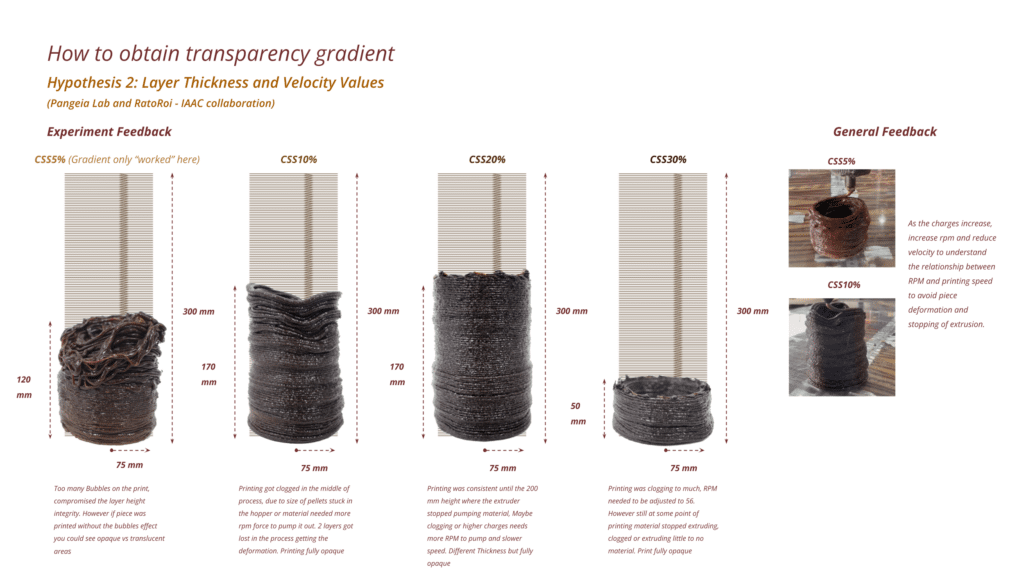
The third hypothesis was to control the printing speed in the same piece and trying to understand if the higher the speed the thinner was goint to be the layer thickness, therefore passing more light (contributing to control of gradient of transluncency). This hypothesis was tested with CSS5%, CSS10%, CSS20%, CSS30%, with the same printing parameters as hypothesis 1 and 2 only chasring the layer time per second.
The results for this third hypothesis was that the the slightly change of opacity was observed in the CSS5% and the CSS10%, CSS20%, CS330% were to dark eventhough some areas of the layer were thinner than the others. However the same printiting errors from clogging, bubbles, and temperature set up were still showing up. Demonstrating that some control to reduce these errors needed to be considered.
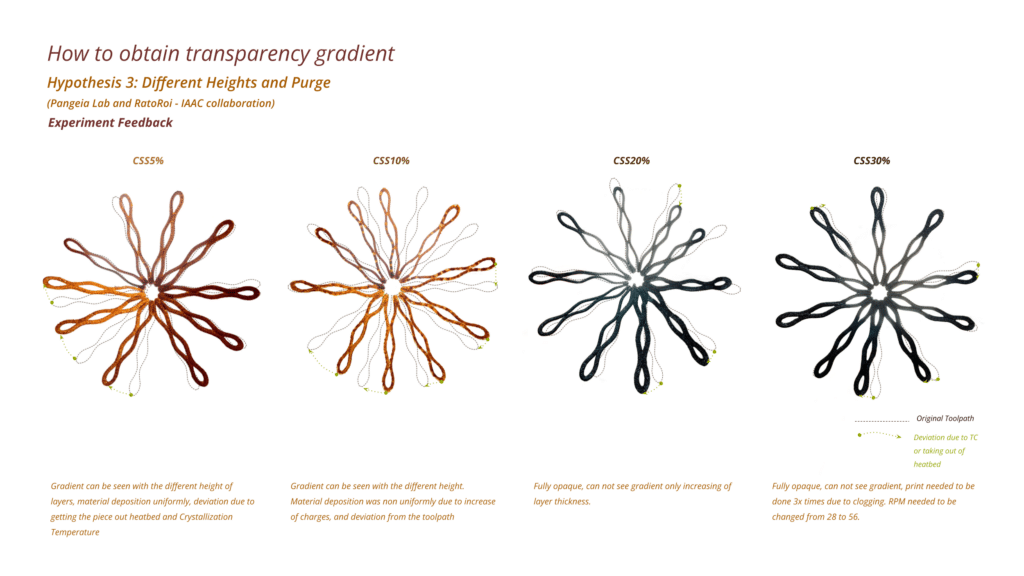
A fourth hypothesis was changing the printing height in relationship to the heatbed to generate higher layer with more concetration of material and thinner layers with a spreadout of the material when the height is closests to the print bed, to control the gradient in the same print, ranging from dark to transluncency. The same printing parameters were setup as hypothesis 1, 2 and 3 only changing the printing height and the layer time per second. This experiment was conducted with each charge of CSS.
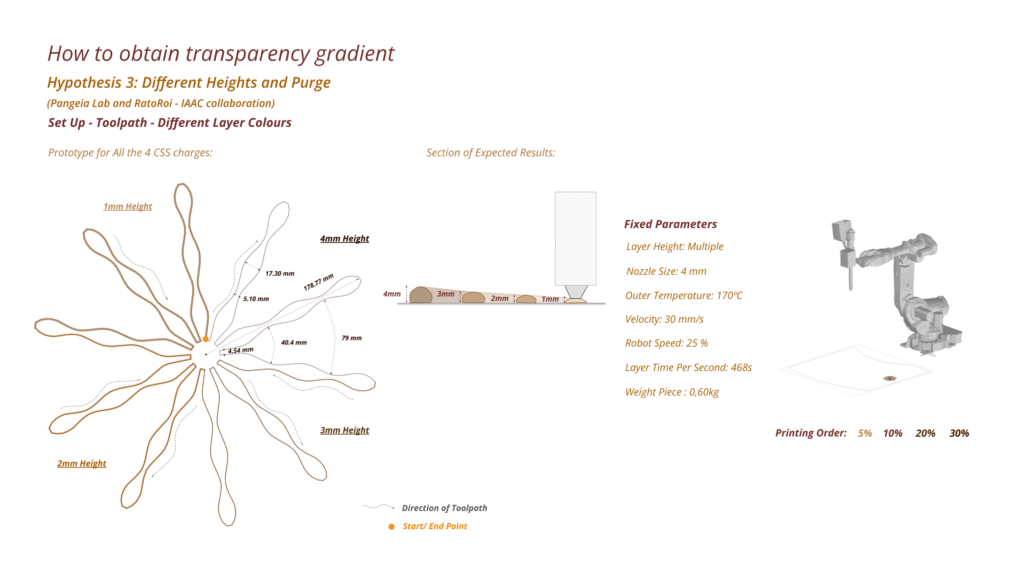
The results have shown that this control of translucency only worked with CSS5% and CSS10% because CSS20% and CSS30% were already to dark and very rough finish. Demonstrating that the same can not be shown with higher charges of CSS. However the printing failures from the other hypothesis were not observed in this test due to the fact of being a single layer print.
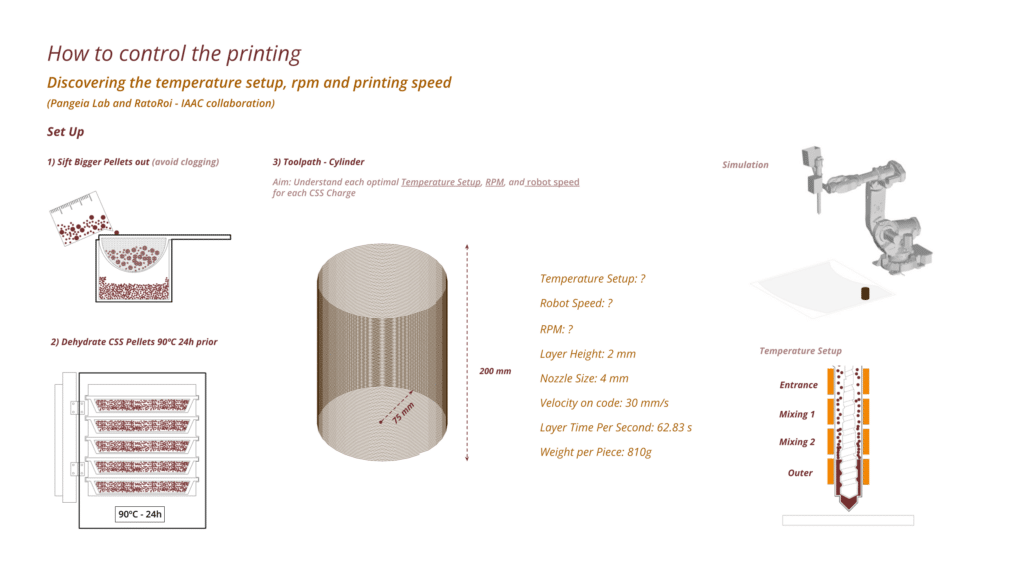
By having the feedback from Hypothesis 1 to 3 of the printing mistakes, a step back was taken to mitigate the errors and understand the best RPM and temperature set ups. and robot printing speed percentage for each charge. First the bigger pellets were sifted out to avoid clogging. Each charge was putted 24h before in the dehydrator on a 90ºC temperature. Than in a cylindrical specimen of 75mm radius and 200 mm height we were trying to find the best Temperature Setup (Entrance, Mixing 1, Mixing 2, Outer), Robot Speed Percentage and RPM, condindering a print with 2 mm layer height and 62s per layer as well 4mm nozzle size.
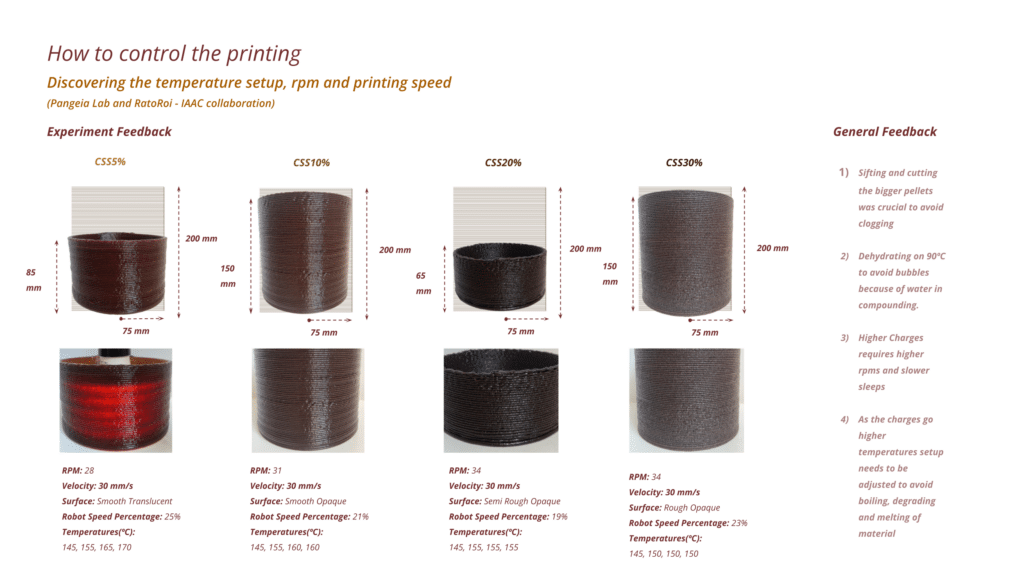
By having all these processes to mitigate the errors we could stablish a relationship between increasing of the CSS charges the RPM, Robot Speed Percentage and Temperature Setup. As we increase the CSS charges the RPM increase in order to pump the material that it is more dense in charges. To maintain the thickness of the printing layer according to the same diameter of the nozzle the Robot Speed Percentage needs to reduce in order to guarantee the printing quality, so it is a material that requires a slow print. The biocomposite it is very sensitive to temperature based on the fabrication tests and as shown on the DSC analysis. So as we increase the charges the 4 entrances of temperatures need to be decreasing in order to guarantee the integrity of the layer height. CSS30% it has the temperatures as Entrance: 145ºC; Mixing 1: 150ºC; Mixing 2: 150ºC; Outer: 150ºC. This also inform that in order to print with this material the extruder needs to rely on the motor power for printing biocomposites with low temperature ranges.
The dehydration of 90ºC 24h prior to print and the sifting of the bigger pellets were also crucial avoid bubbles and clogging inside the hopper and the upper part of the printing screw. Nevertheless the size of pellets are considered to be a parameter specific for this thesis since the pelletizing machine produced irregular size pellets and the extruder used had a small neck diameter to accomodate different size of pellets.
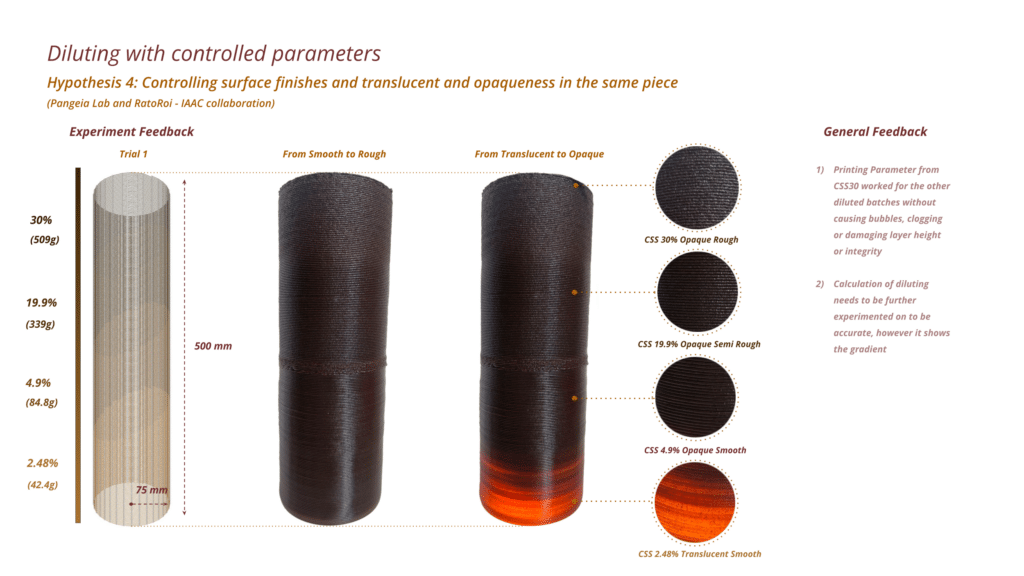
In order to sum up the new findings about the temperature set up, robot speed percentage and rpm, a new hypothesis was conducted to understand if taking the parameters we used on the CSS30% and apply to the diluting method we could obtain in the same piece the desired gradient of translucency to opaqueness and surface finish. To calculate the dilution for each area we used the logic as shown in the diagram bellow where we take the desired percentage to obtain from the total masterbastch of CSS30%, take what it is supposed to be the amount of Masterbatch and subtract from the total amount of grams from the printing part.
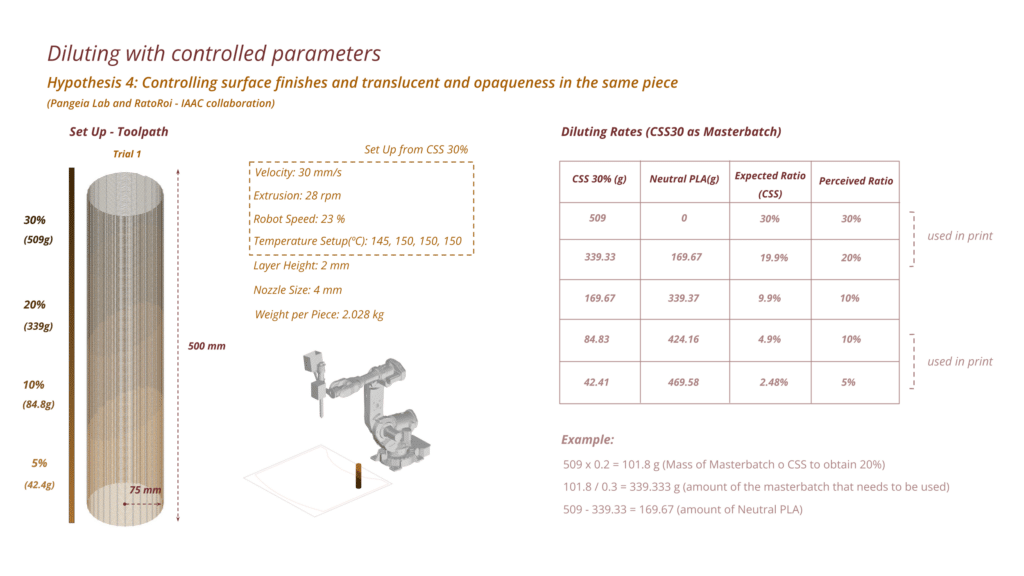
By utilizing these parameters and the diluting method we have achieve control of the CSS charges in the same piece. Ranging from CSS2.5% to CSS30%, showing a gradient from translucent to opaque and from smooth to rough surface. This method with the printing parameters could be further explored with different geometrical shapes to understand it this could be applied to other shapes that are not modular or equidistance.
One of the last aims for this trimester was also to quantify the carbon footprint for the manufacturing process of the lamp and understand the increase of CSS charges in the PLA matrix and if it reduces or increases the carbon footprint, also comparing it to other plastics used in the Market. Calculations were considering the Transportation and the Energy Consumption in Brasil ( Bahia to São Paulo, Minas to São Paulo). The first part considered on the carbon footprint was the embedded carbon from the Cacau Seed Shell on the Cabruca Culture in the South of Bahia, its transportation to São Paulo and the industrial processes from the Chocolate Factory to Extract the Cacau Seed Shell from the nibs, this on its own already has 6.62 kgCO2/kg embedded on the Seed Shell as a residue/byproduct of the Chocolate Industry. On the other hand it was necessary to calculate also the Virgin PLA from Minas and its Transportation to São Paulo. By combining it through compounding and robotic printing to obtain one Lamp of 790g. What we could observe from the whole process is that as processes (A3) the ones that produces more carbon are the Roasting Machine, from the Chocolate Producing Process, the Compounding of PLA and CSS and the Robotic Printing.
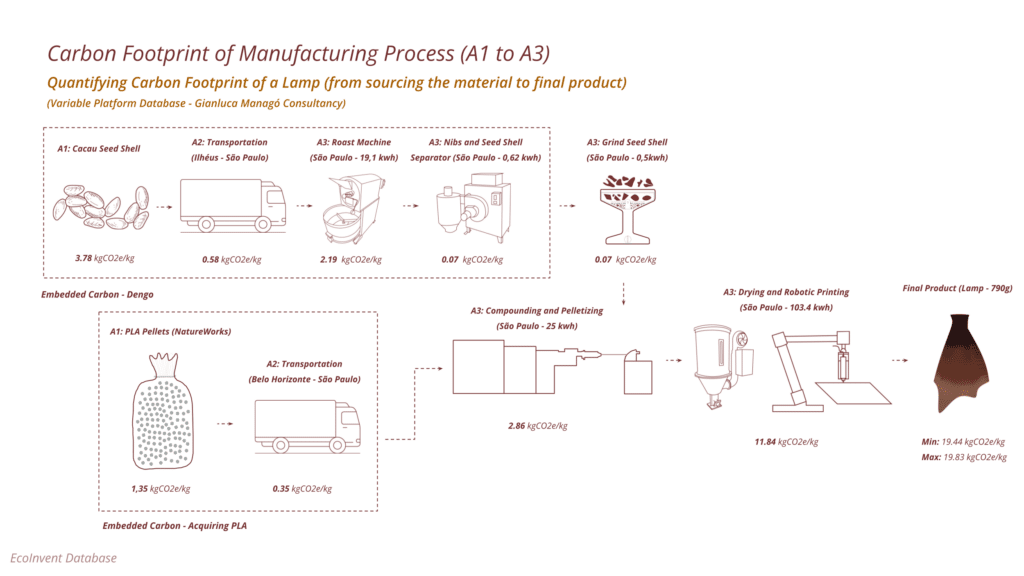
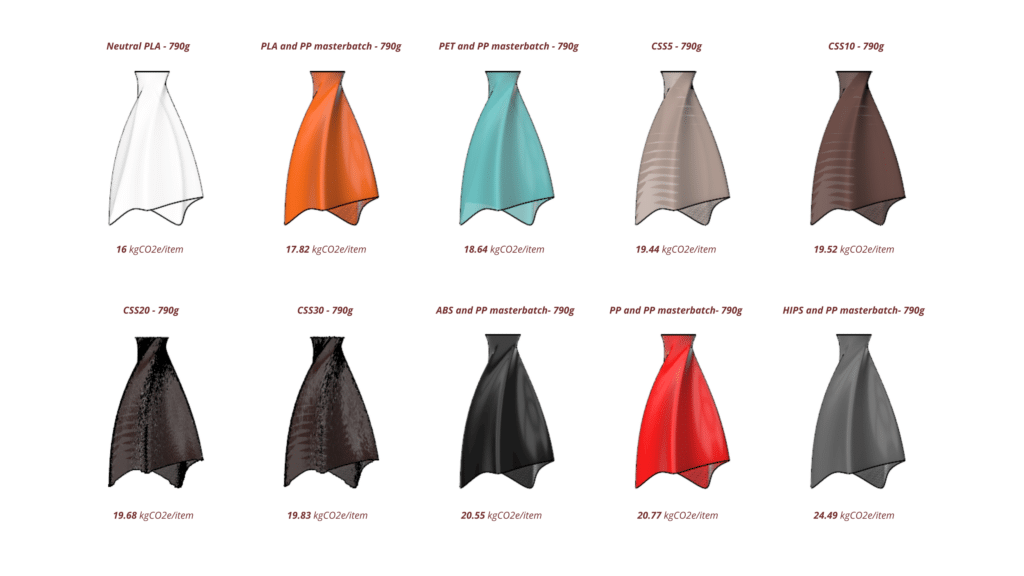
Based on the Calculations, considering A1 to A3 (sourcing, transporation and processing/manufacturing) it is noticle that Neutral PLA it is the lowest one in carbon footprint. When it adds PP masterbatch of it is printed with PET it increases in carbon. From the point of view of the Lamps with different charges of CSS5 the carbon footprint ranges from 19.44 to 19.83 kgCO2/item showing that any biocomposite out of polymer using organic residues have carbon embedded from the processing of the residue from printing or already processes that are applied from other industries that produced this residue. However compared to ABS, PP, and High Impact Polysterene still the biocomposite out of PLA are less carbon intensive.
In order to have some comparinson of what we use in our day to day lives 20 kgCO2/item is also equivalent to a cotton T Shirt and eating 2 meat beefs per day. This quantification was considered the manufacturing process and it considers until the end of life of the products maybe the numbers of the biocomposites could reduced compared to other fossel fuel plastics, once we consider eutrophication of water bodies and land, water contamination, amount ending on landfills or burning processes. Nevertheless it does not reduce the processing of preparing the residue to be able to be accomodate in another industry (cradle to gate instead of cradle to cradle).
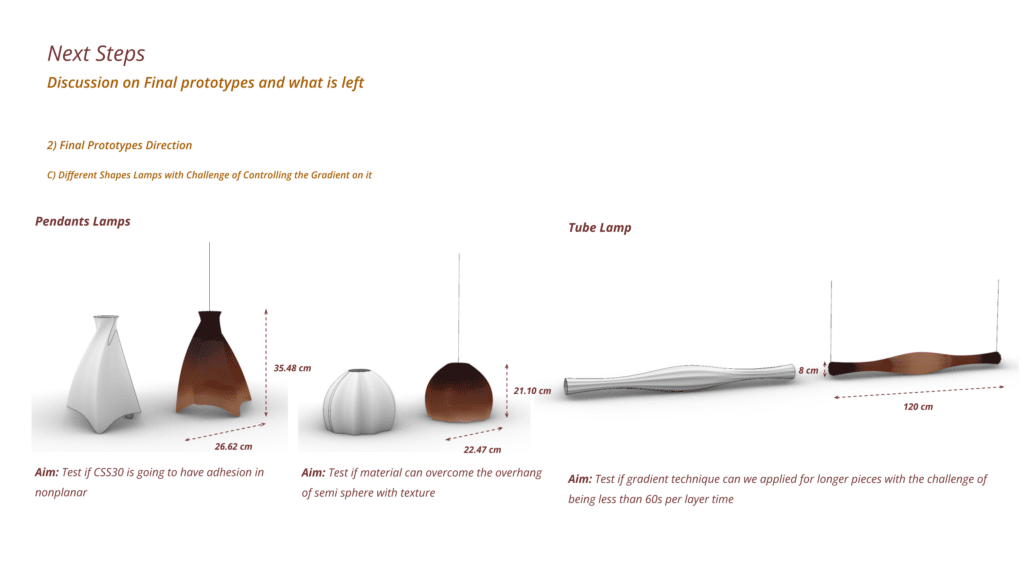
Walking towards the next steps of the thesis, quantification of costs and comparinson with other products still needs to be done and the profit margin on printing with this biocomposite as well as development of final prototypes understand on how different geometrical shapes could accomodate the diluting method with the printing parameters learned in this phase. Other printing design and experiments could also be developed together with the different geometrical shapes, considering degrees of crystallization, bendability, and the mechanical properties that the tests of the next week are going to inform from the biocomposite.