
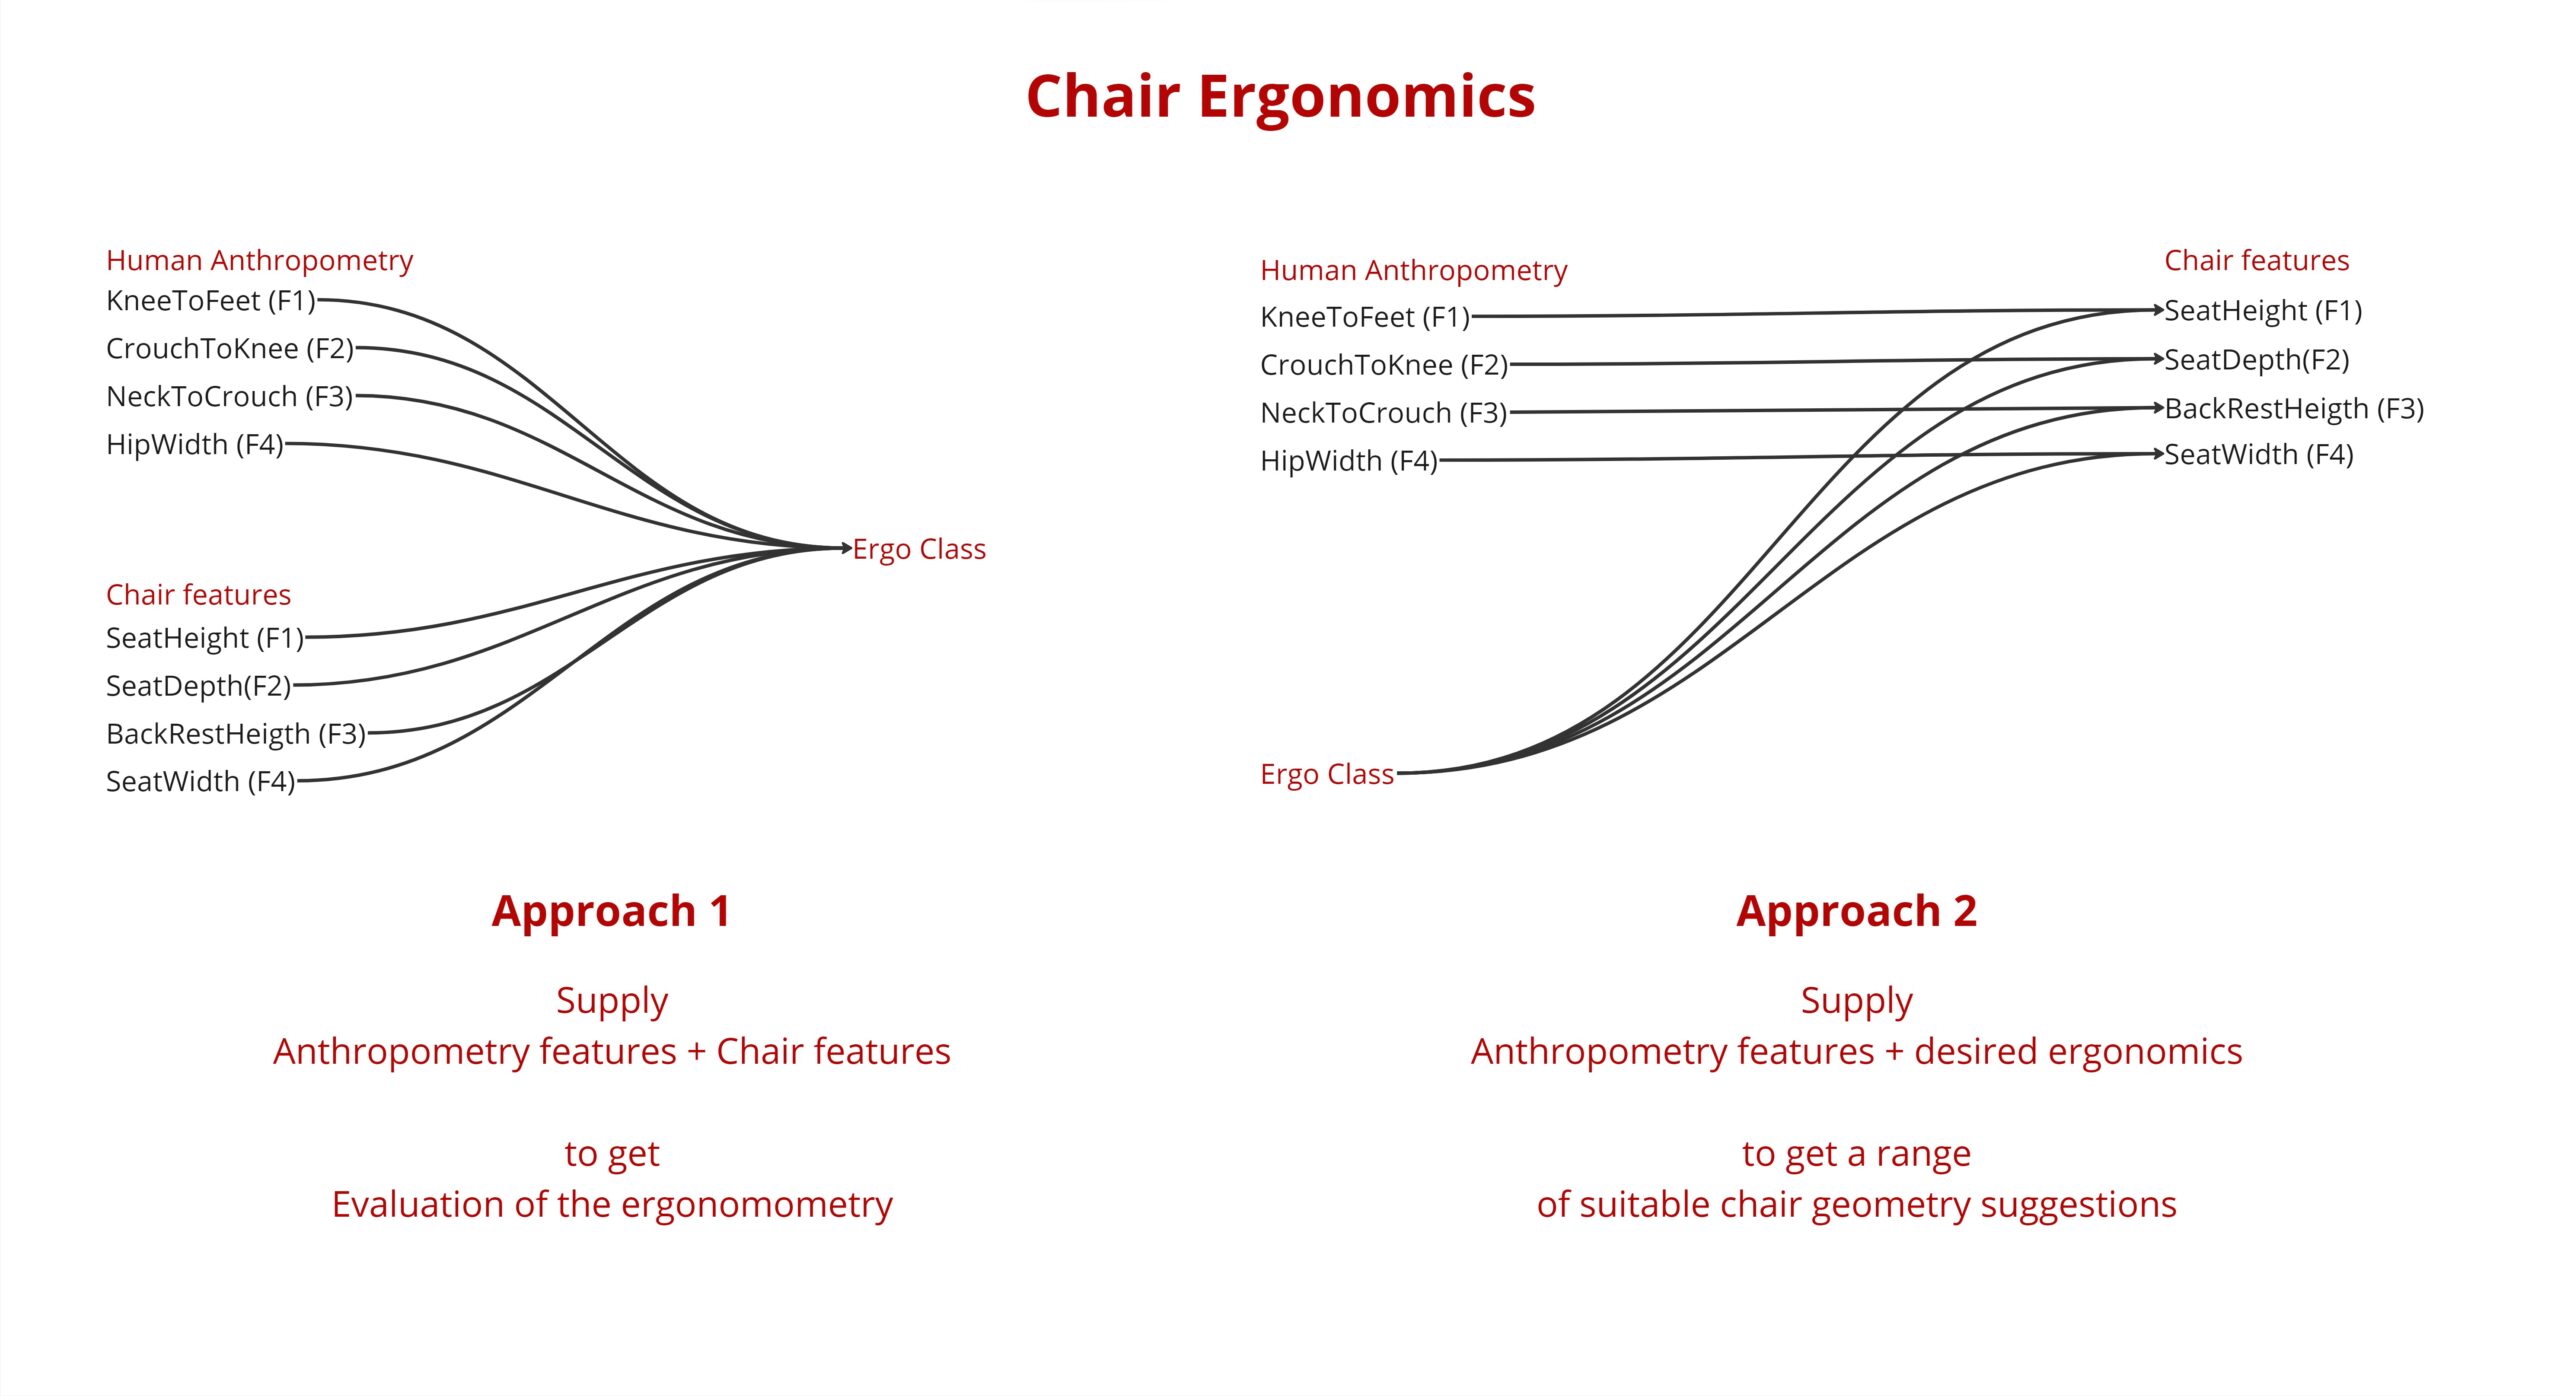
We have 2 target approaches :
In the first approach we Test some of the relevant human Anthropometric measurements with a chair parameters and predict the Ergo Class.
The second approach is to input the Human Anthropometric measurements with the desired Ergo Class and predict a range of chair parameters matching this Ergo Class.
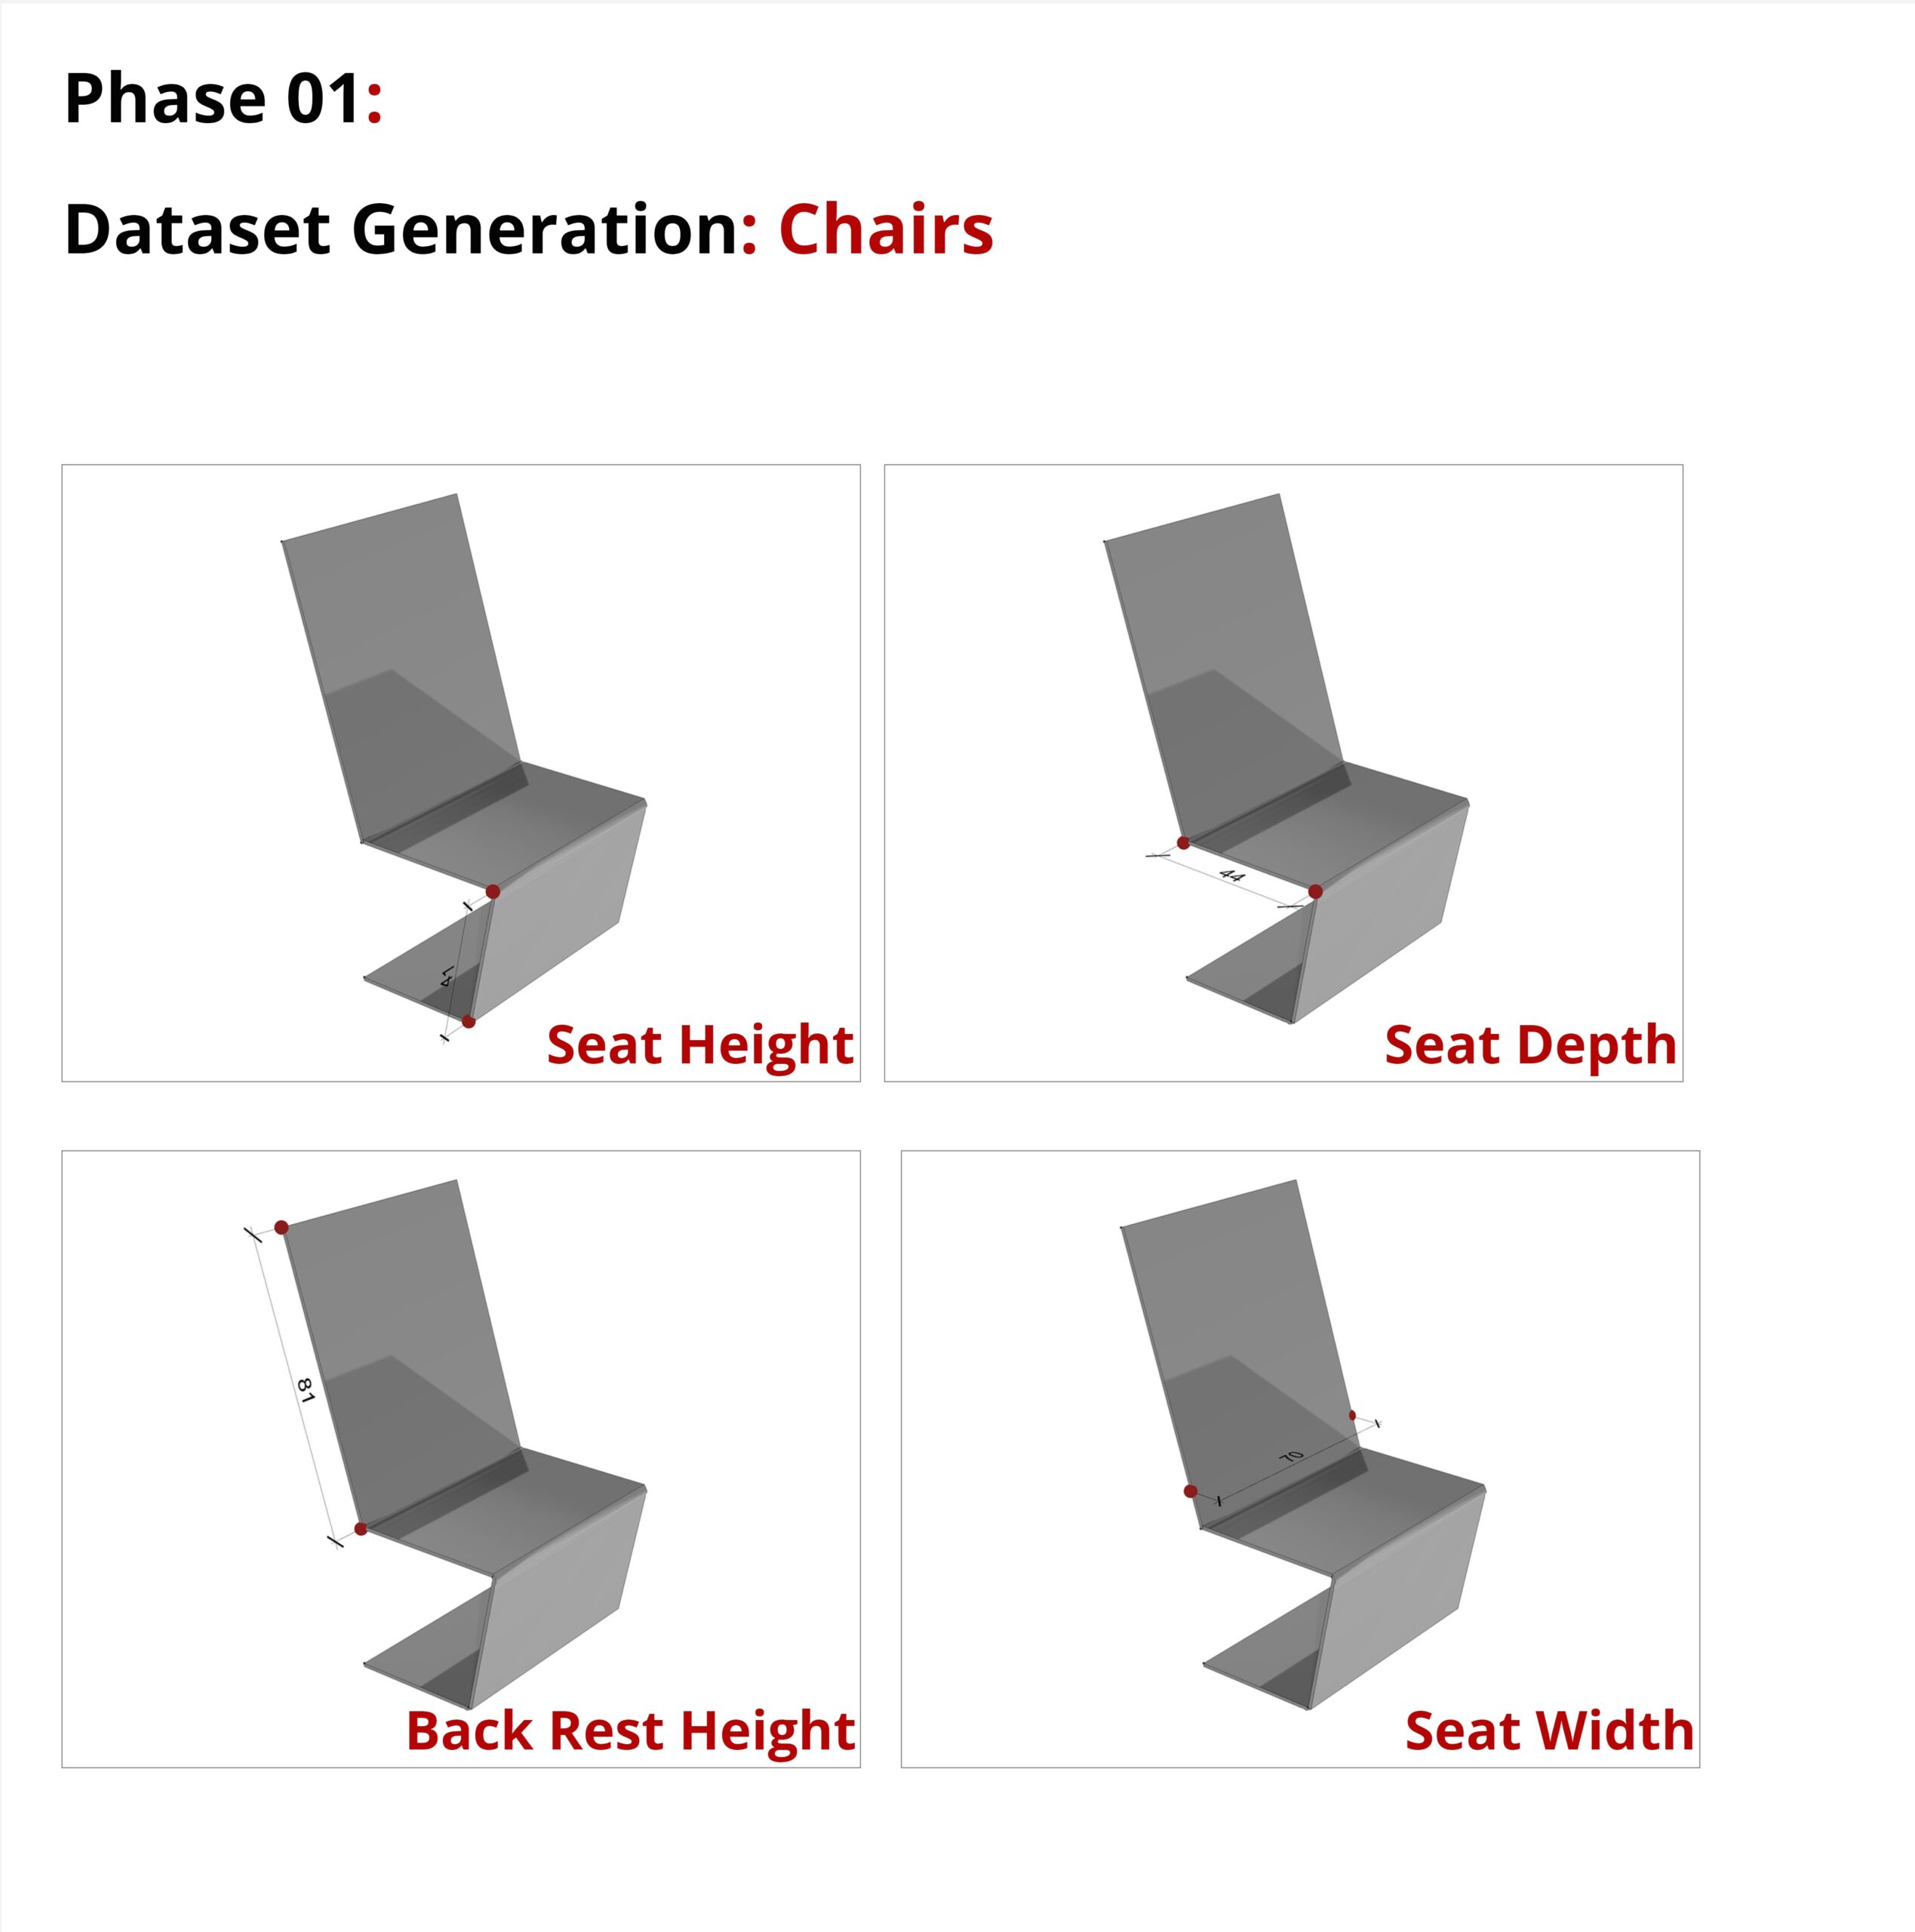
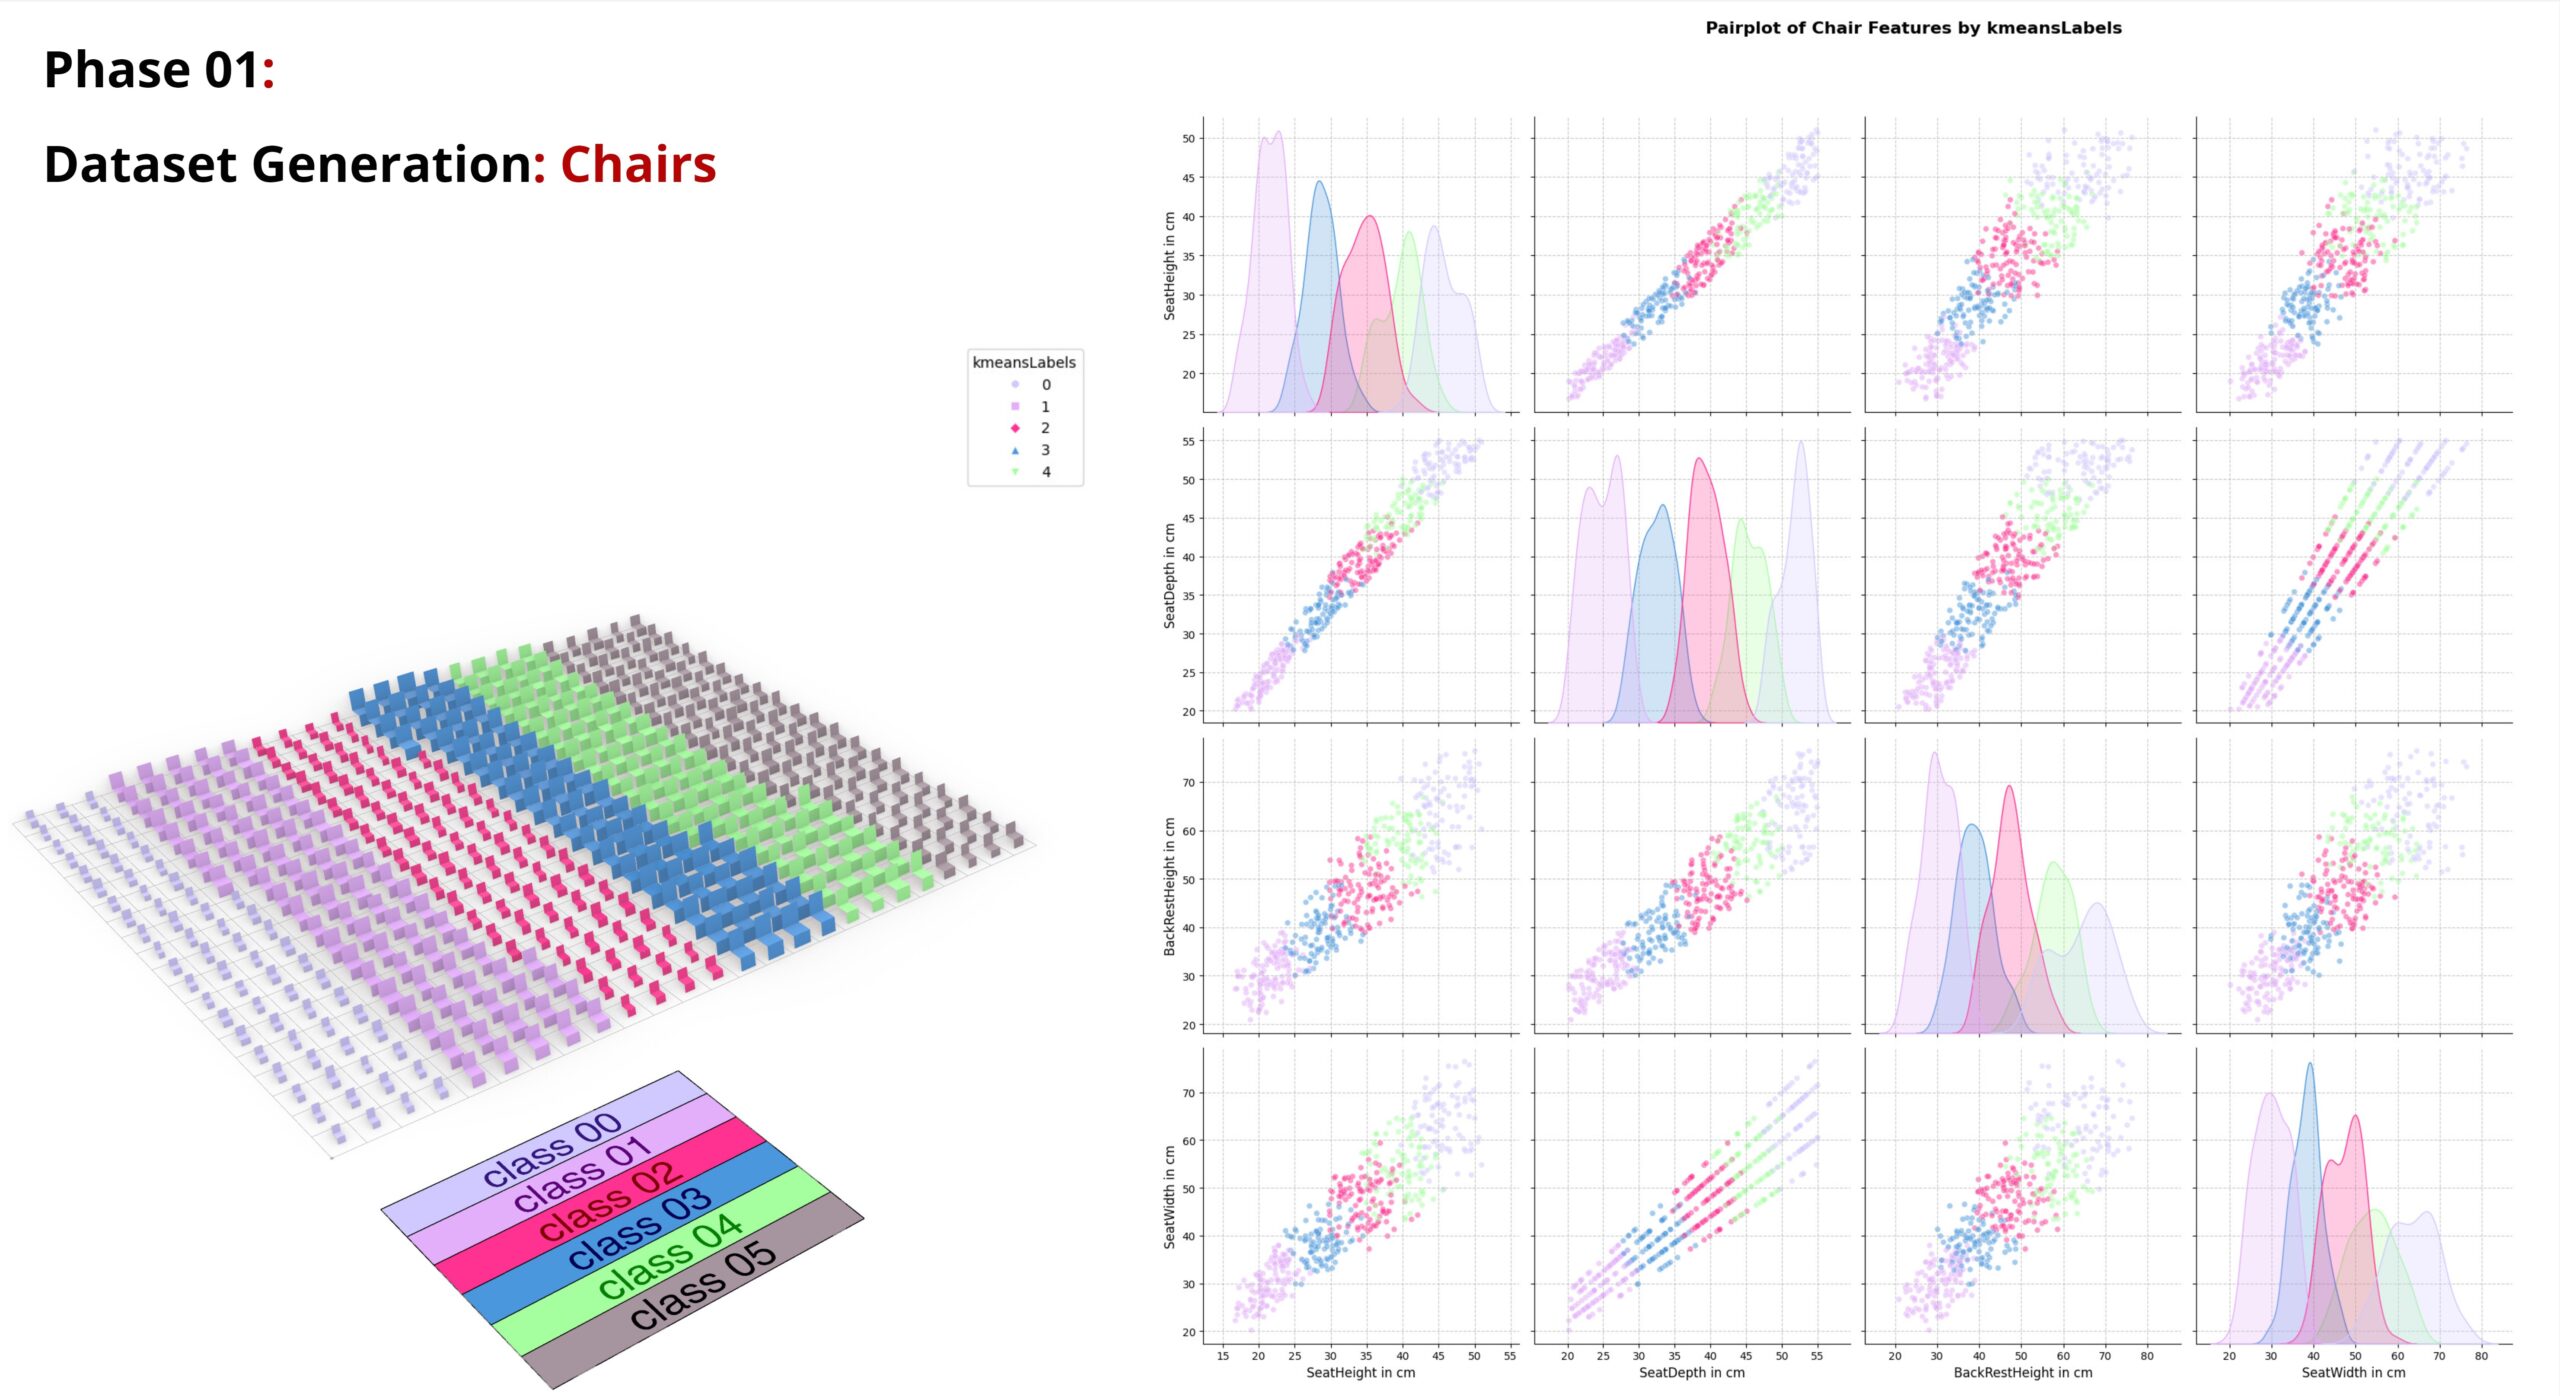
For the Dataset Generation : we start with Generating a simple parametric chair and then generating our dataset of these Chair parameters :
Seat height, Seat Depth, Back Rest Height and Seat Width.
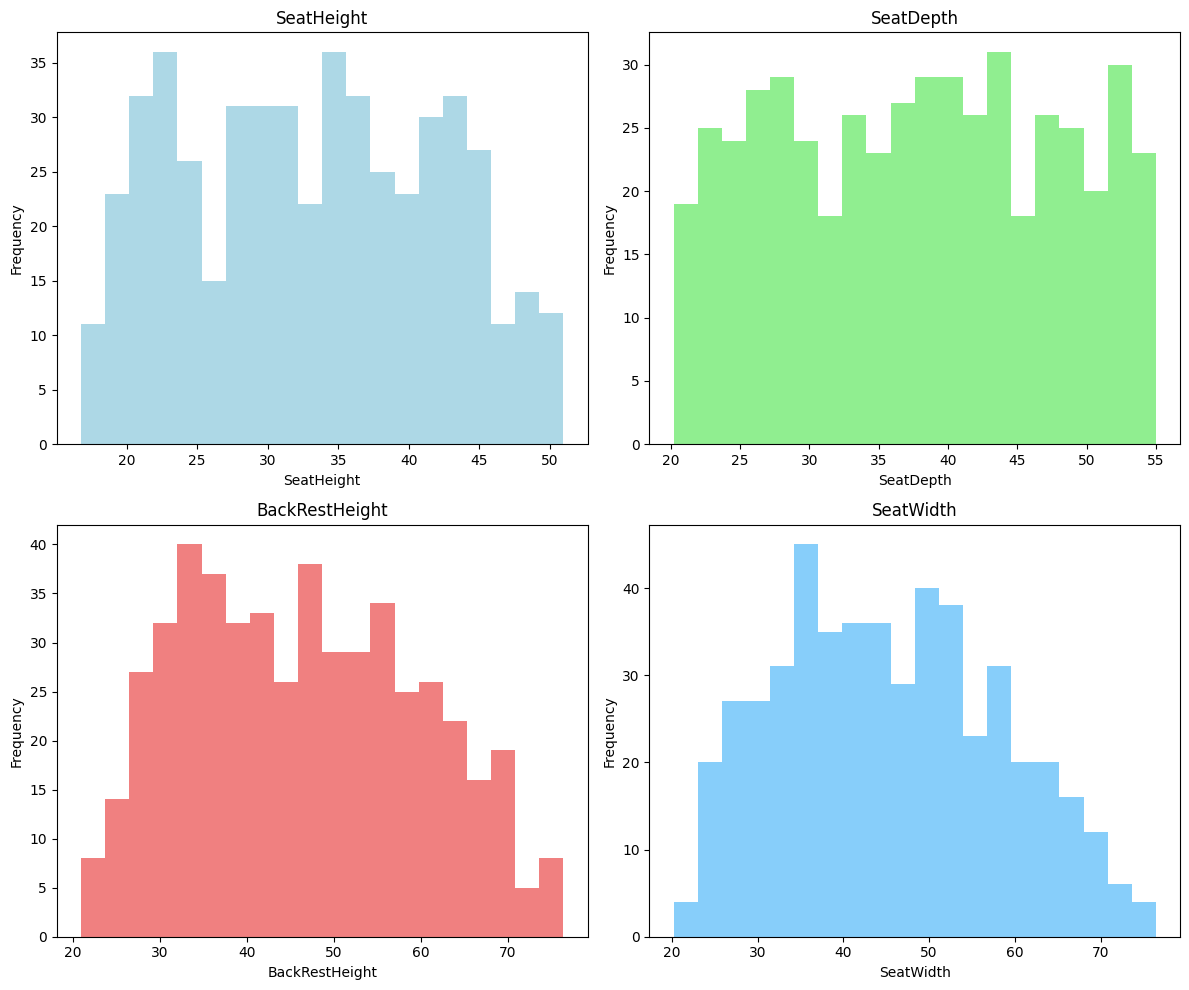
We review our dataset of 500 samples to see the variation of these parameters along the dataset and we have a good variation for Seat height, Seat Width and backrest height, although the seat depth can be improved to have a wider variation,
Applying K-Means Clustering also helped us being more Visually familiar with our dataset readings distribution and we also visualize the corelation between the chair features colouring them with their cluster number .
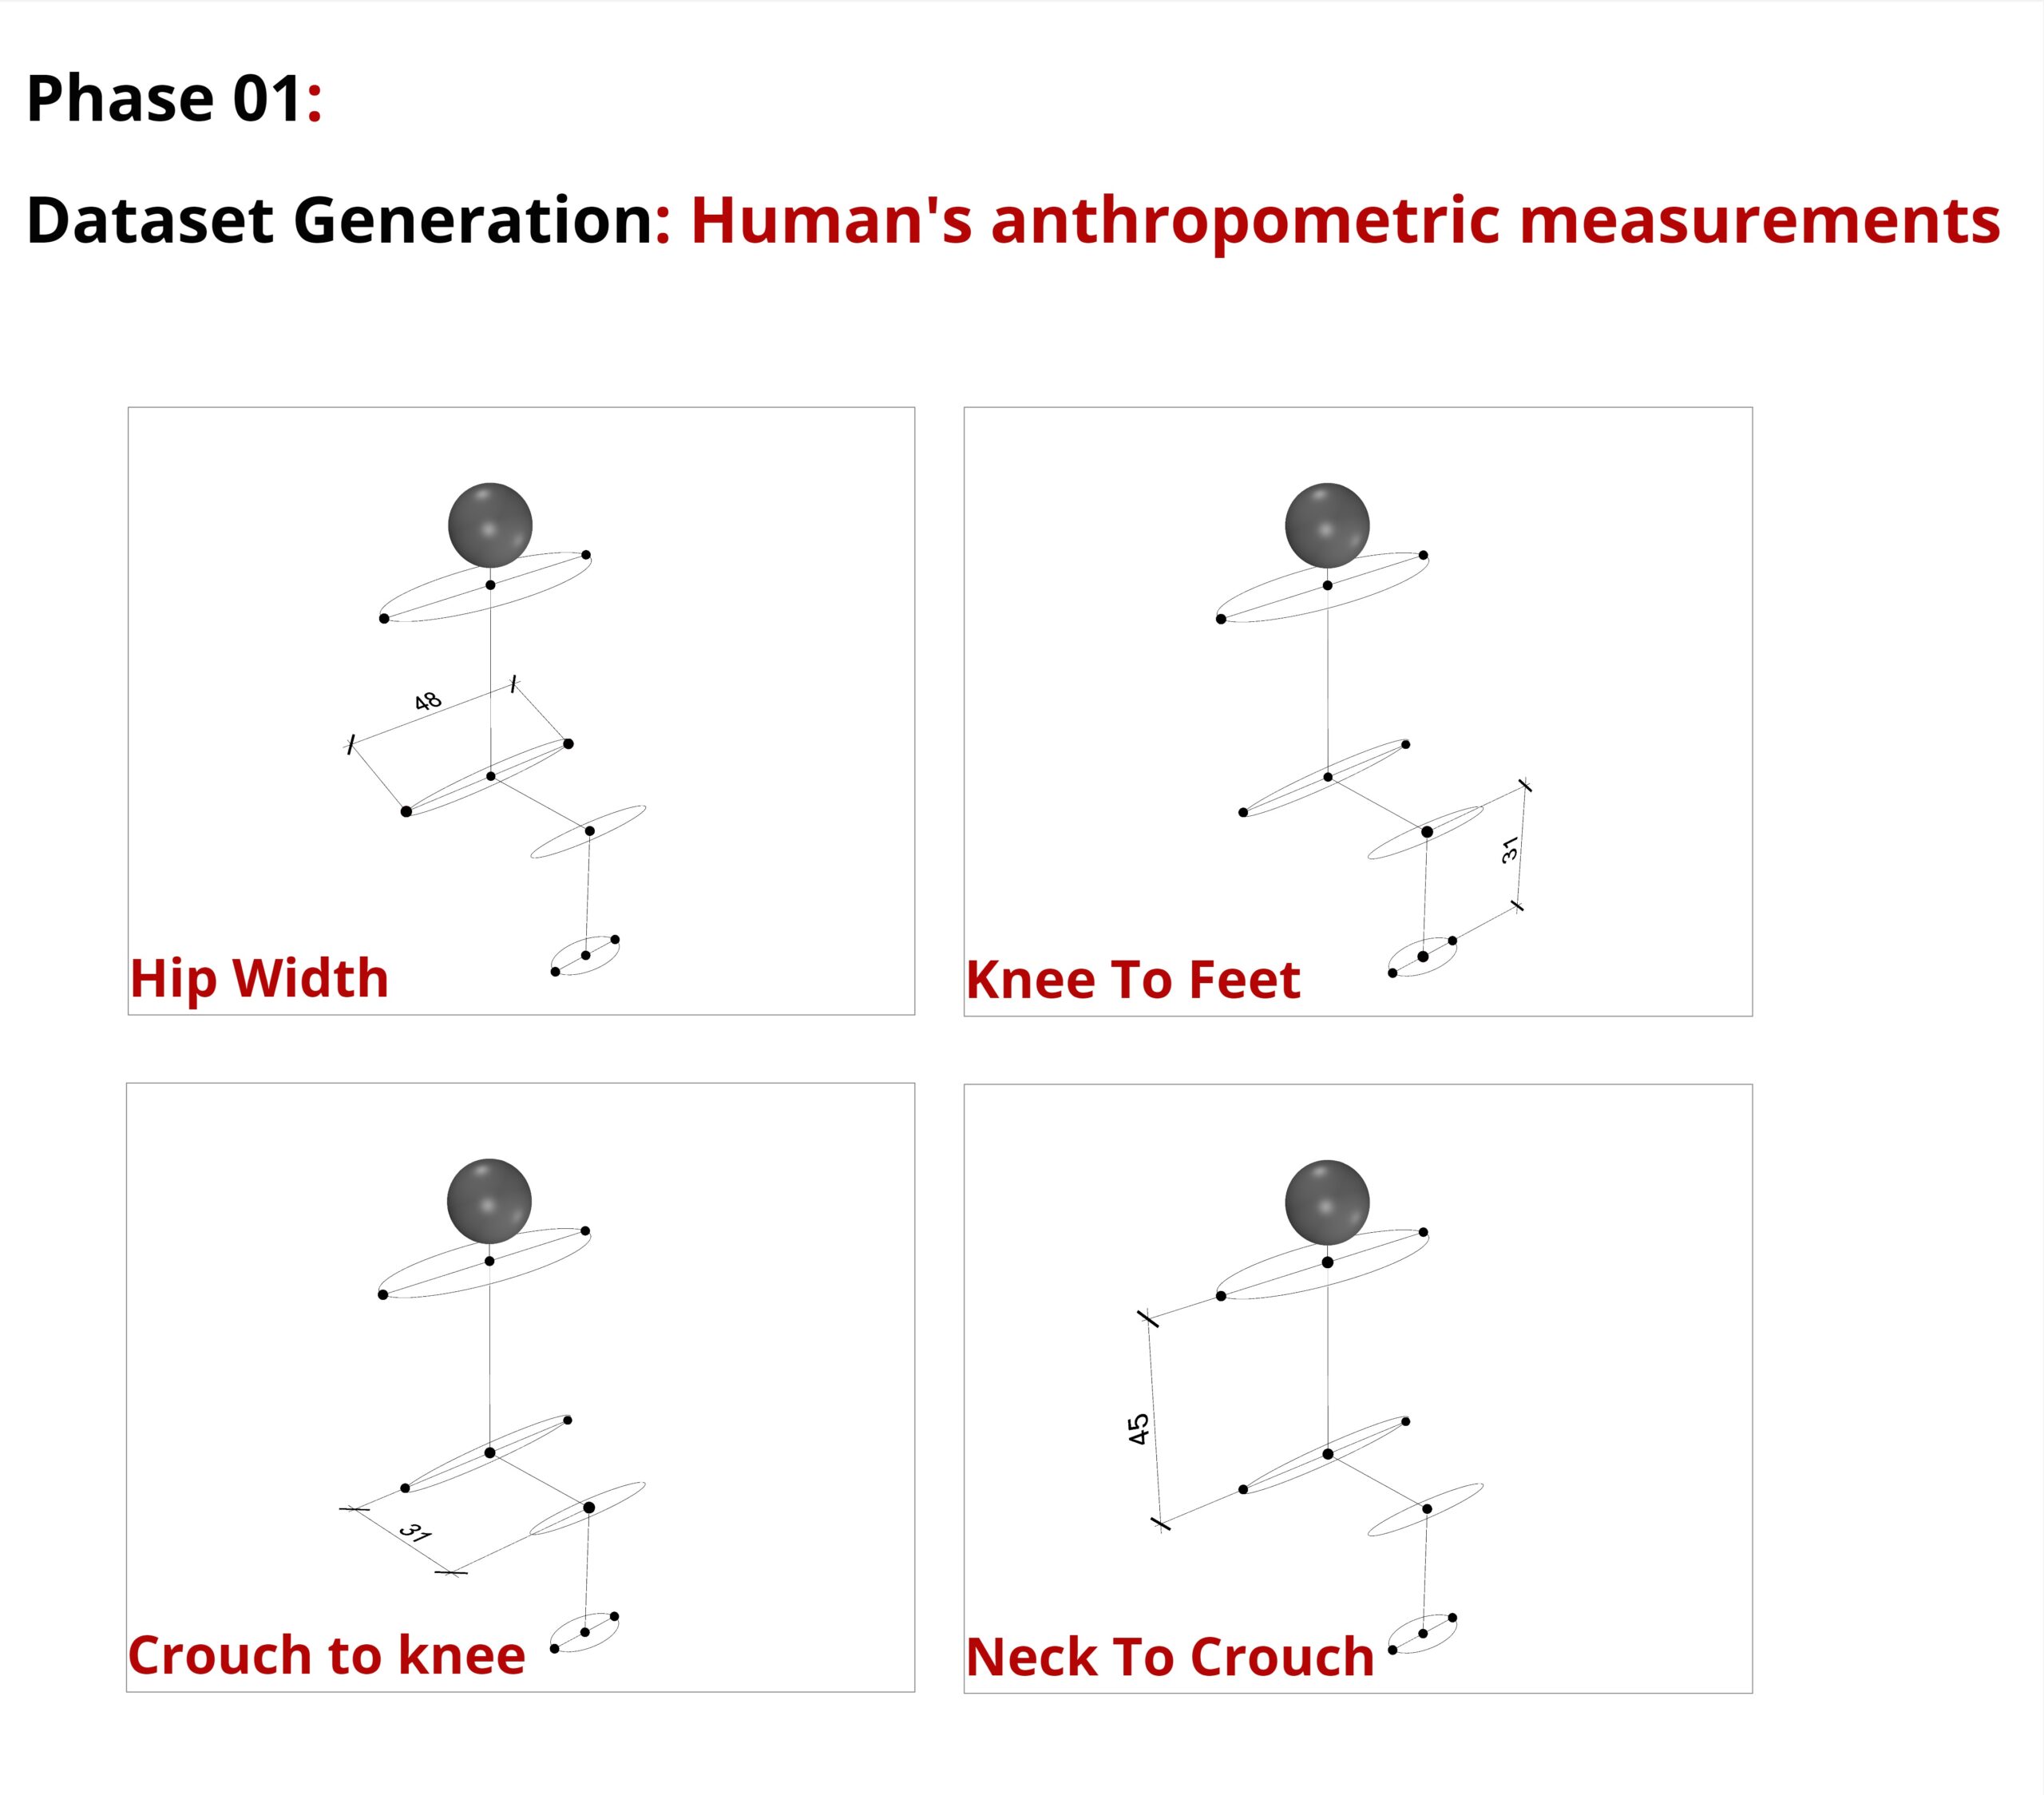
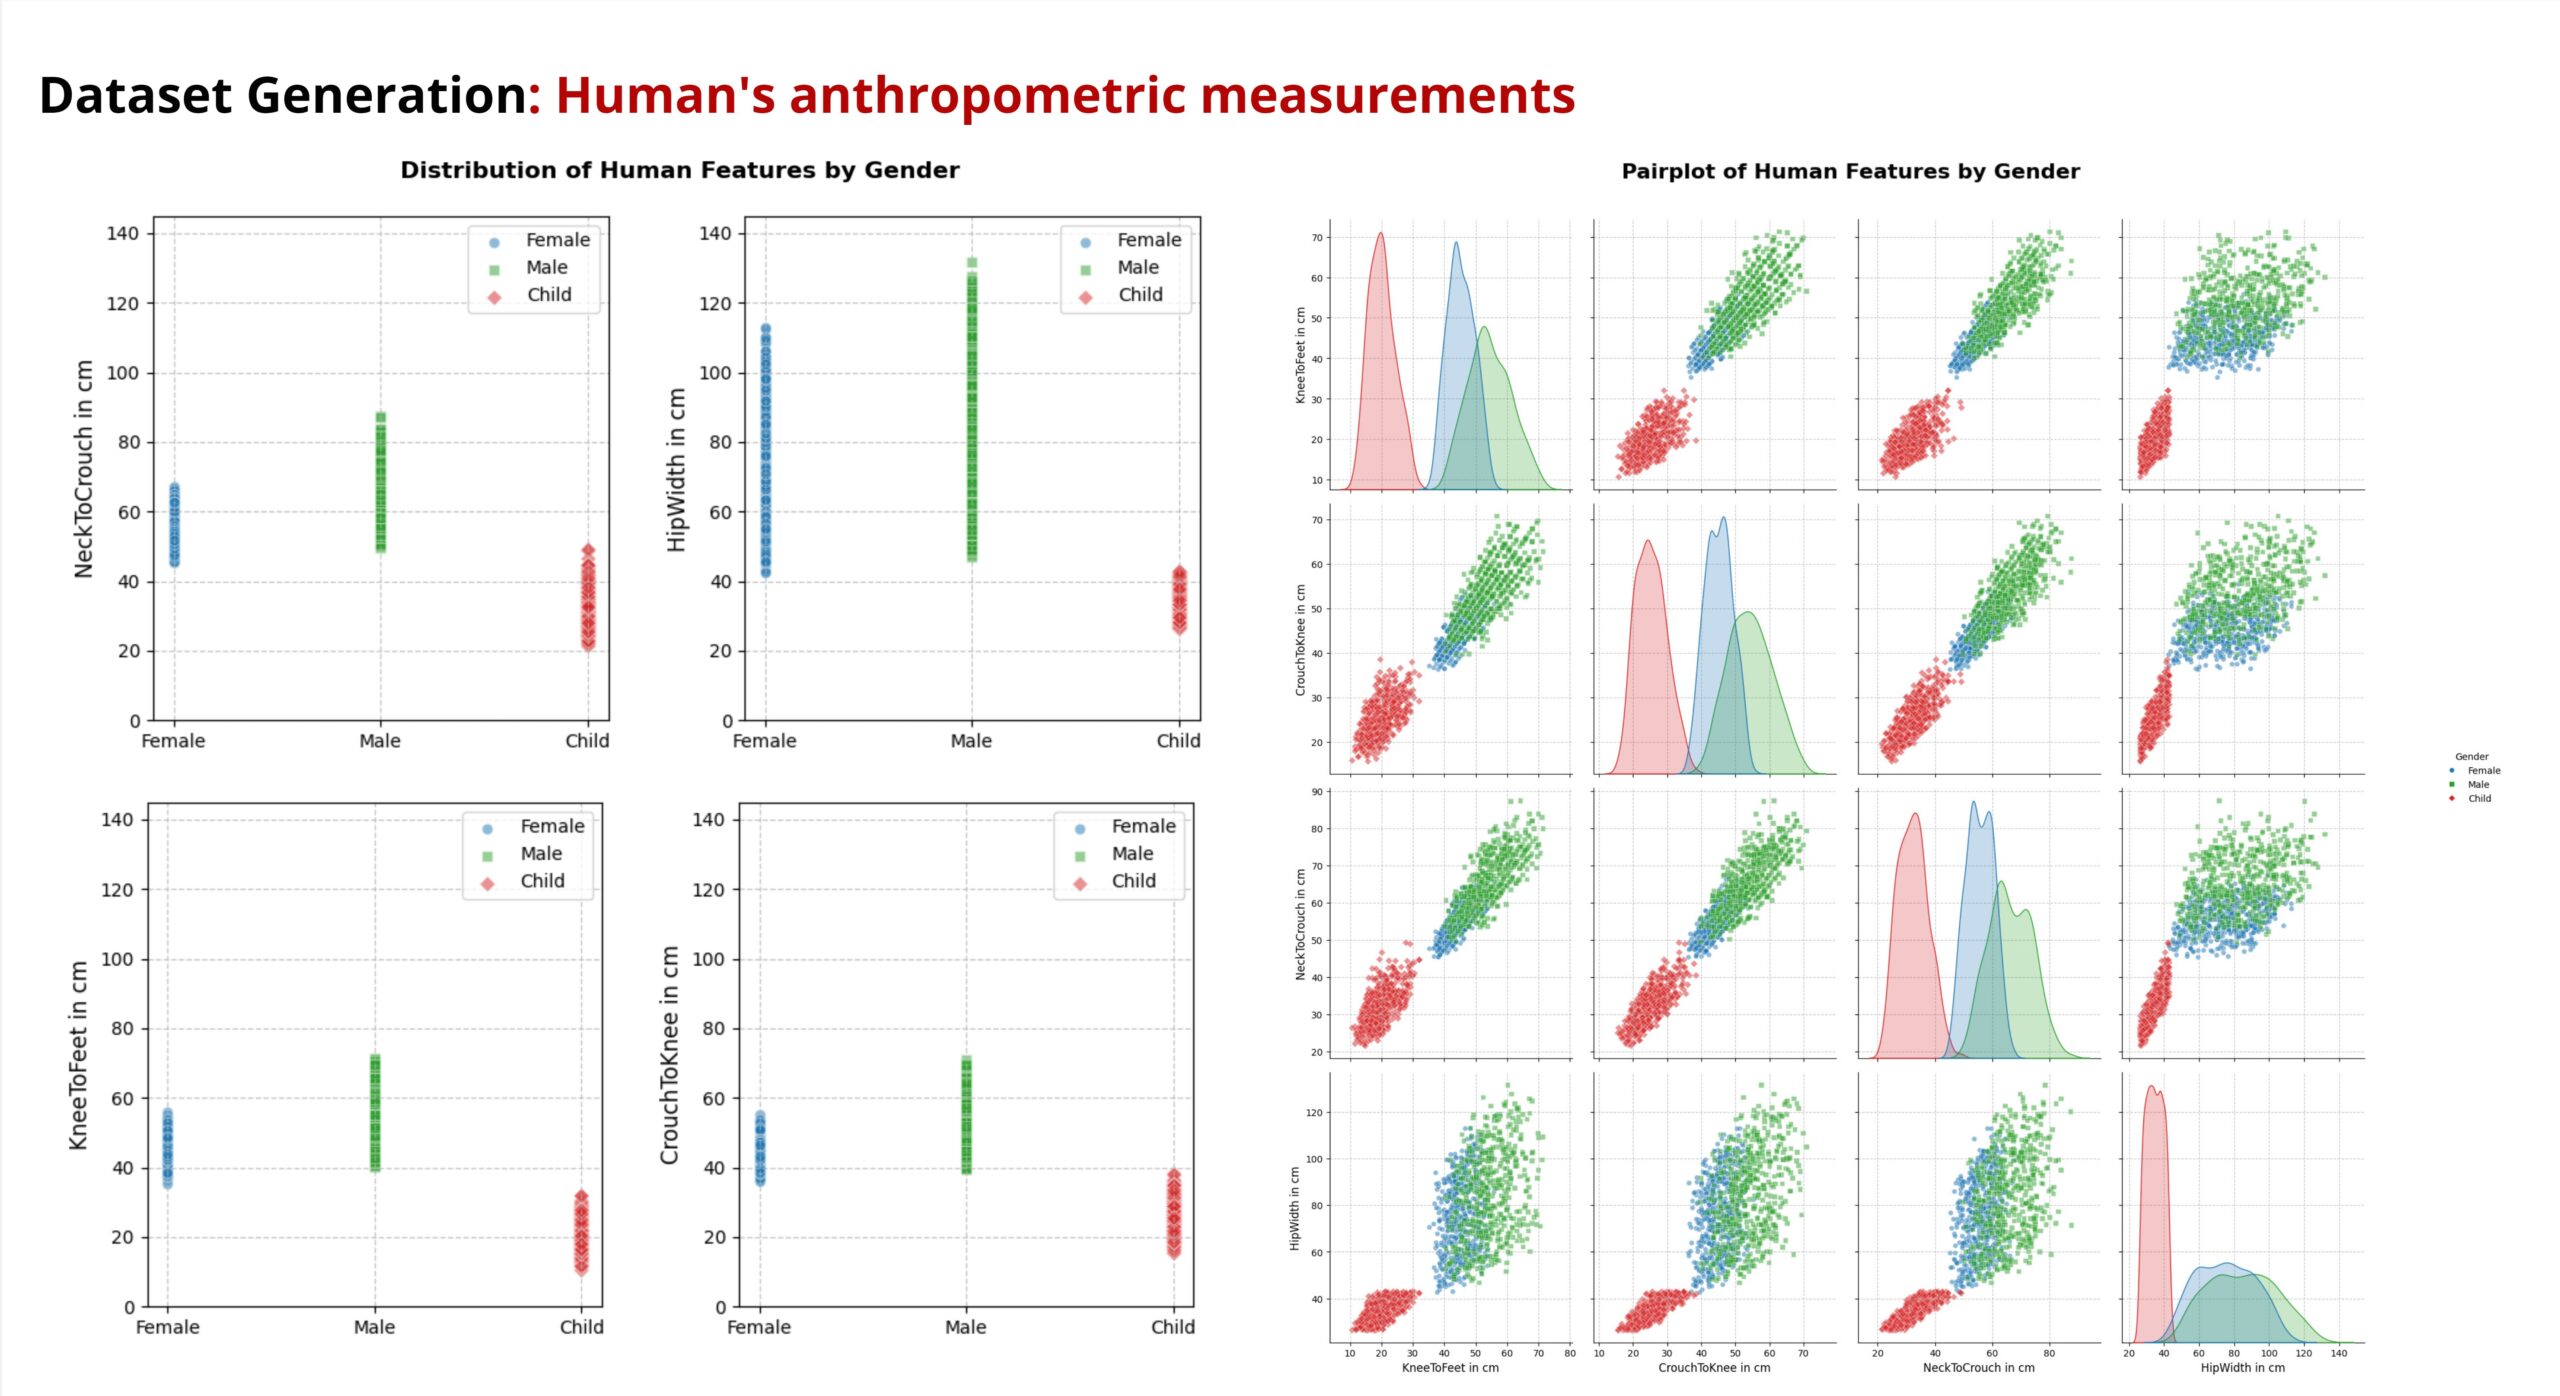
As a second dataset, we have created a dataset with 6000 persons.
Features such as Hip Width, Knee To Feet, Crouch To Knee and Neck To Crouch were defined for each of these people.
These dimensions correspond to the four chair parameters shown before.
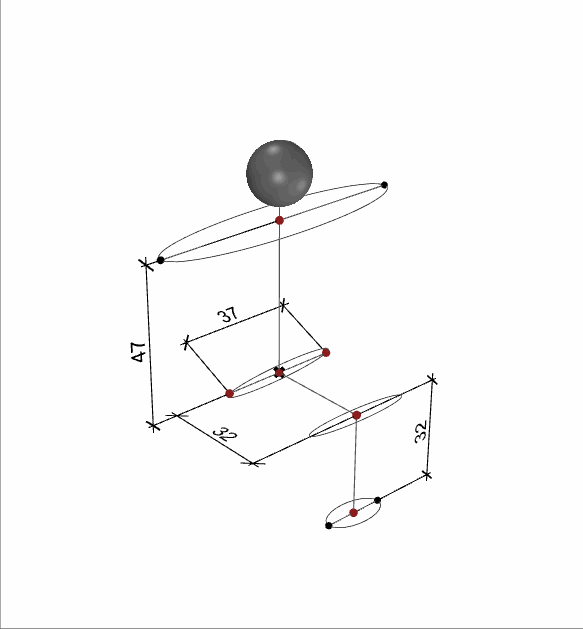
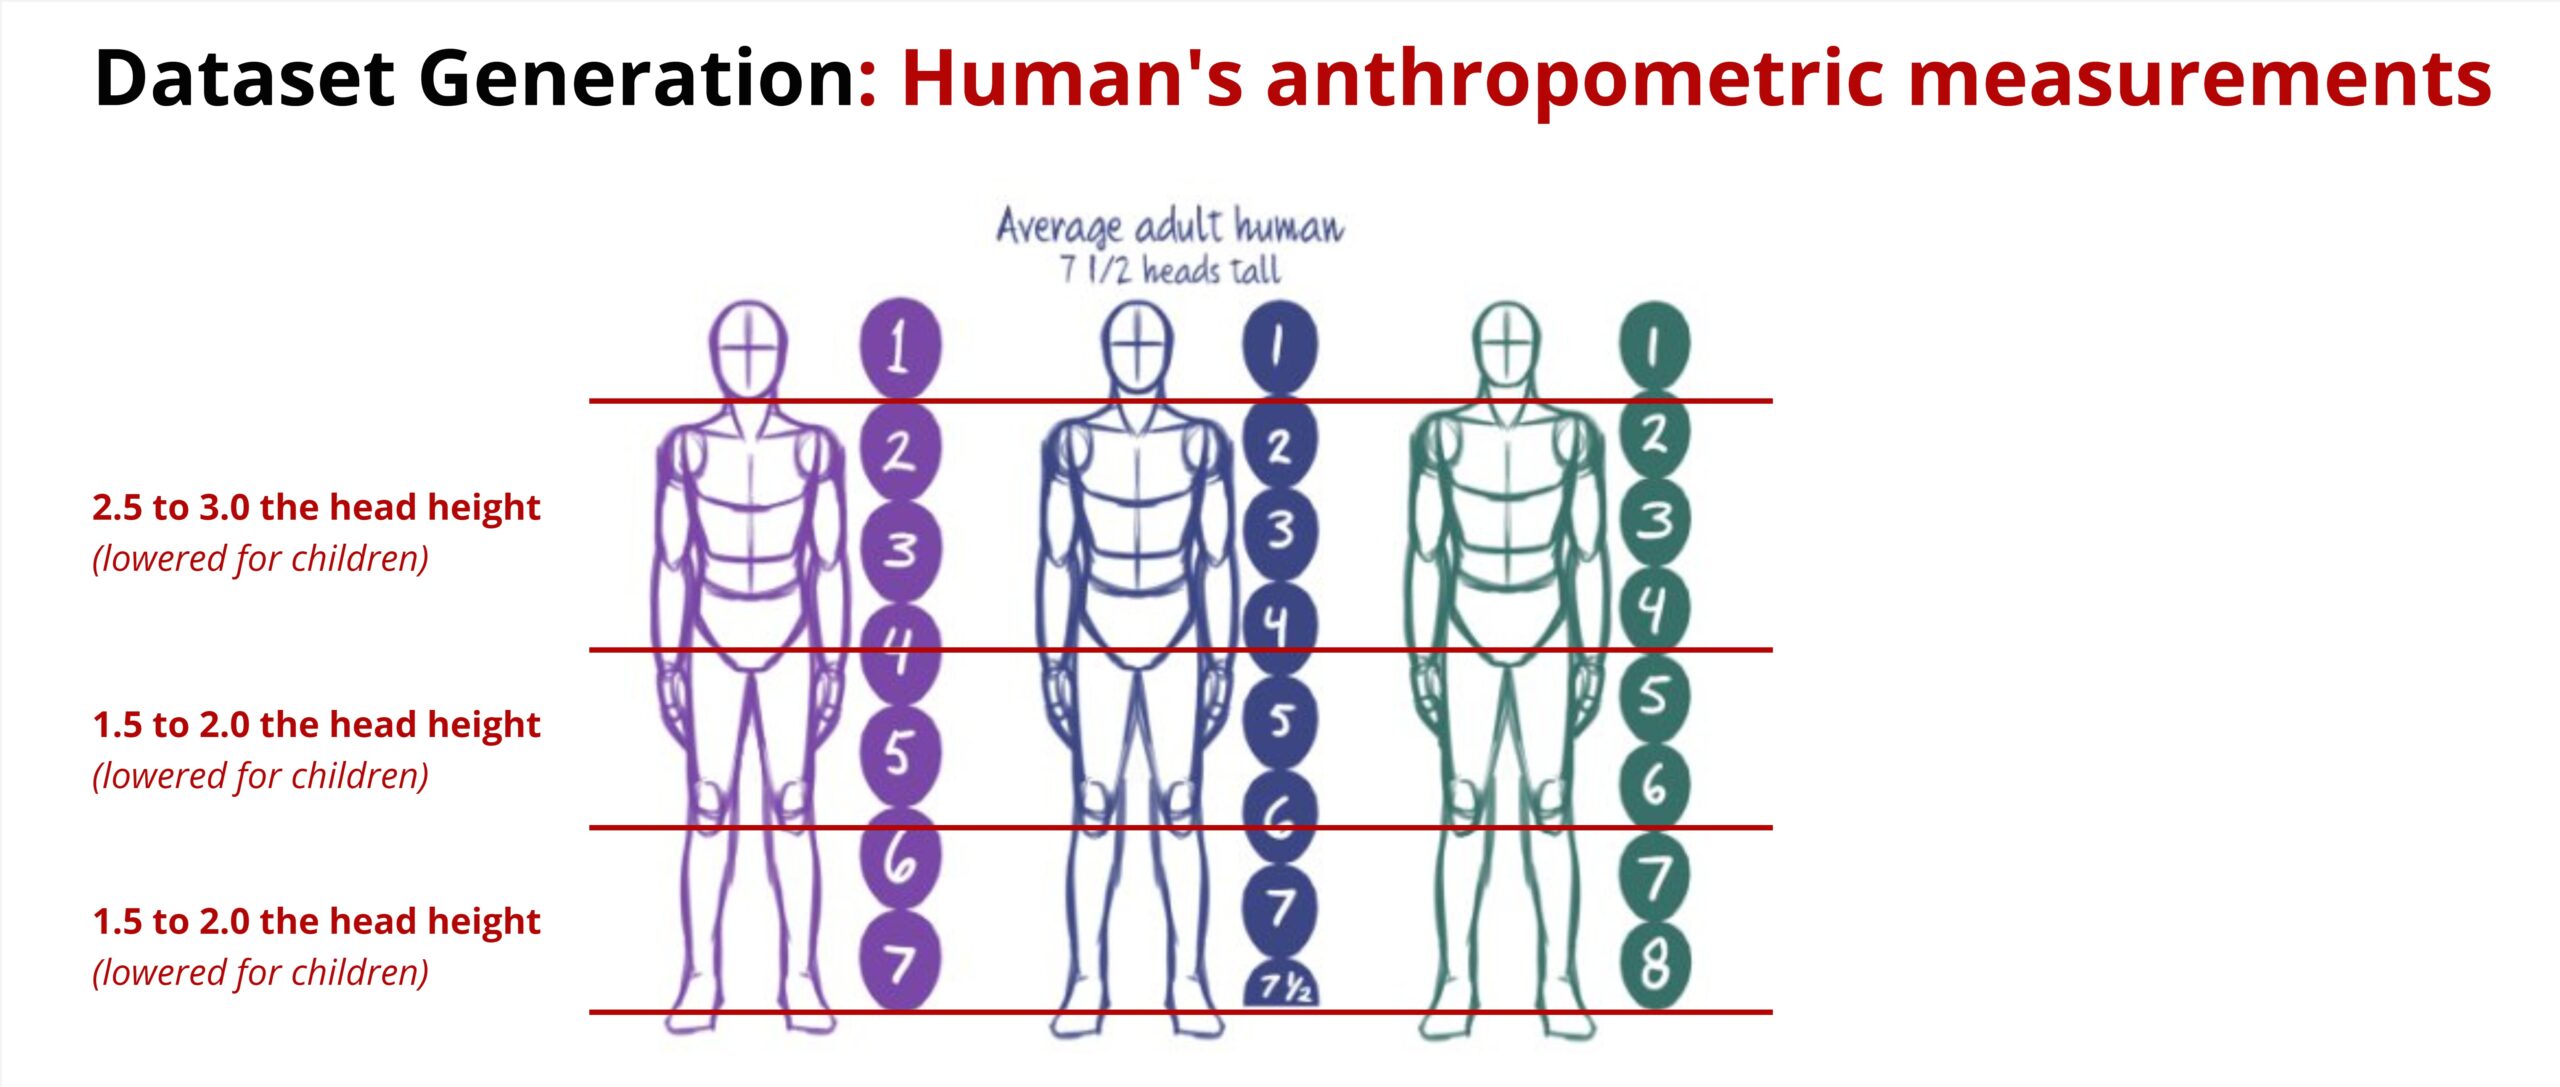
When creating these human parameters, we made sure that the different body measurements were in a certain ratio to each other.
The sketch shows how the proportions relate to the size of the head. We have implemented this and added a small variation in the generation and Generating 2000 samples for Children, Adult male and adult females.
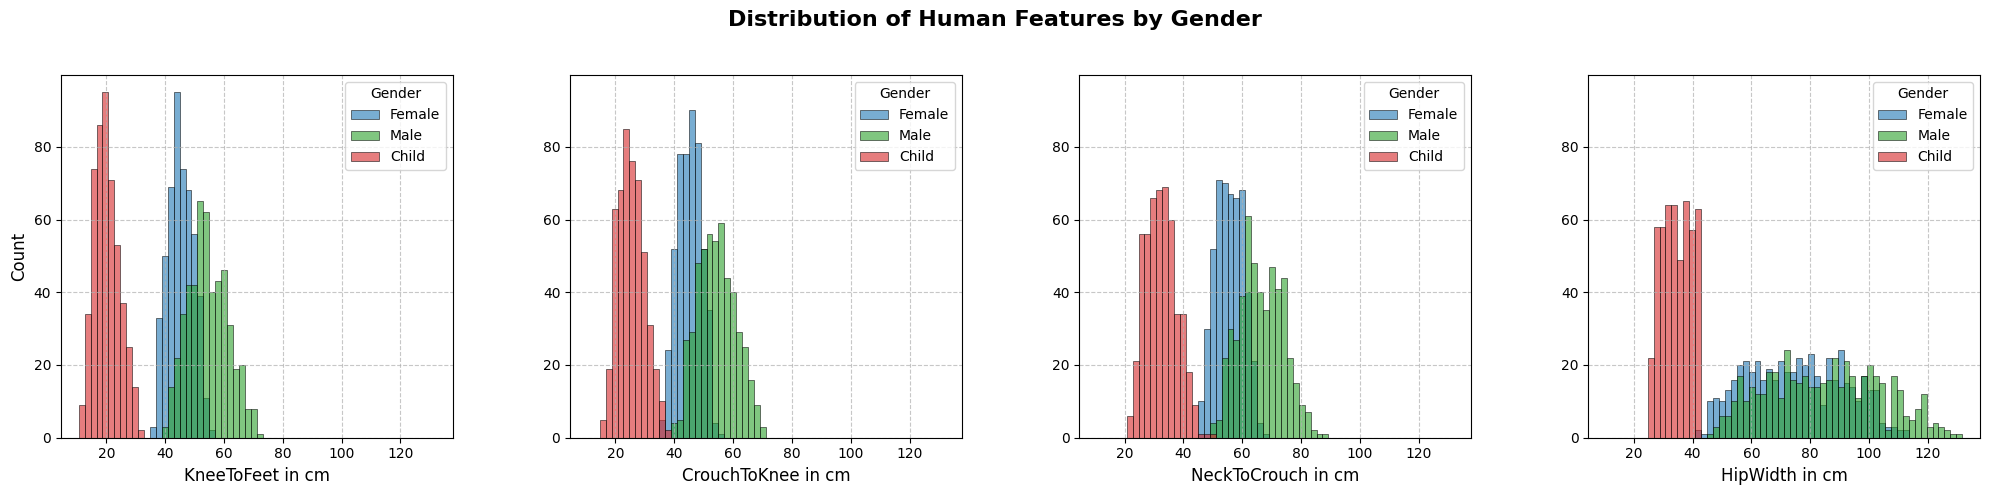
Furthermore, we made sure that the distribution of human features roughly follows a normal distribution. As can be seen in the four plots, the distribution of the data points in all genders forms a bell curve.
A closer look at the data set reveals the following:
The children’s data points (red) are in a clearly separate area from the adult data points. Their values are significantly smaller in all measurements.
Women (blue) and men (green) overlap in many charts, but there are also differences.
In most plots, a positive correlation between the measures can be seen. If the value of one increases, the value of the other also increases.
The variability within the children datapoints is lower than in adults.
After generating the chair and human datasets, we merged them into one combined dataset.
Using a routine we had each person take a seat on each chair.
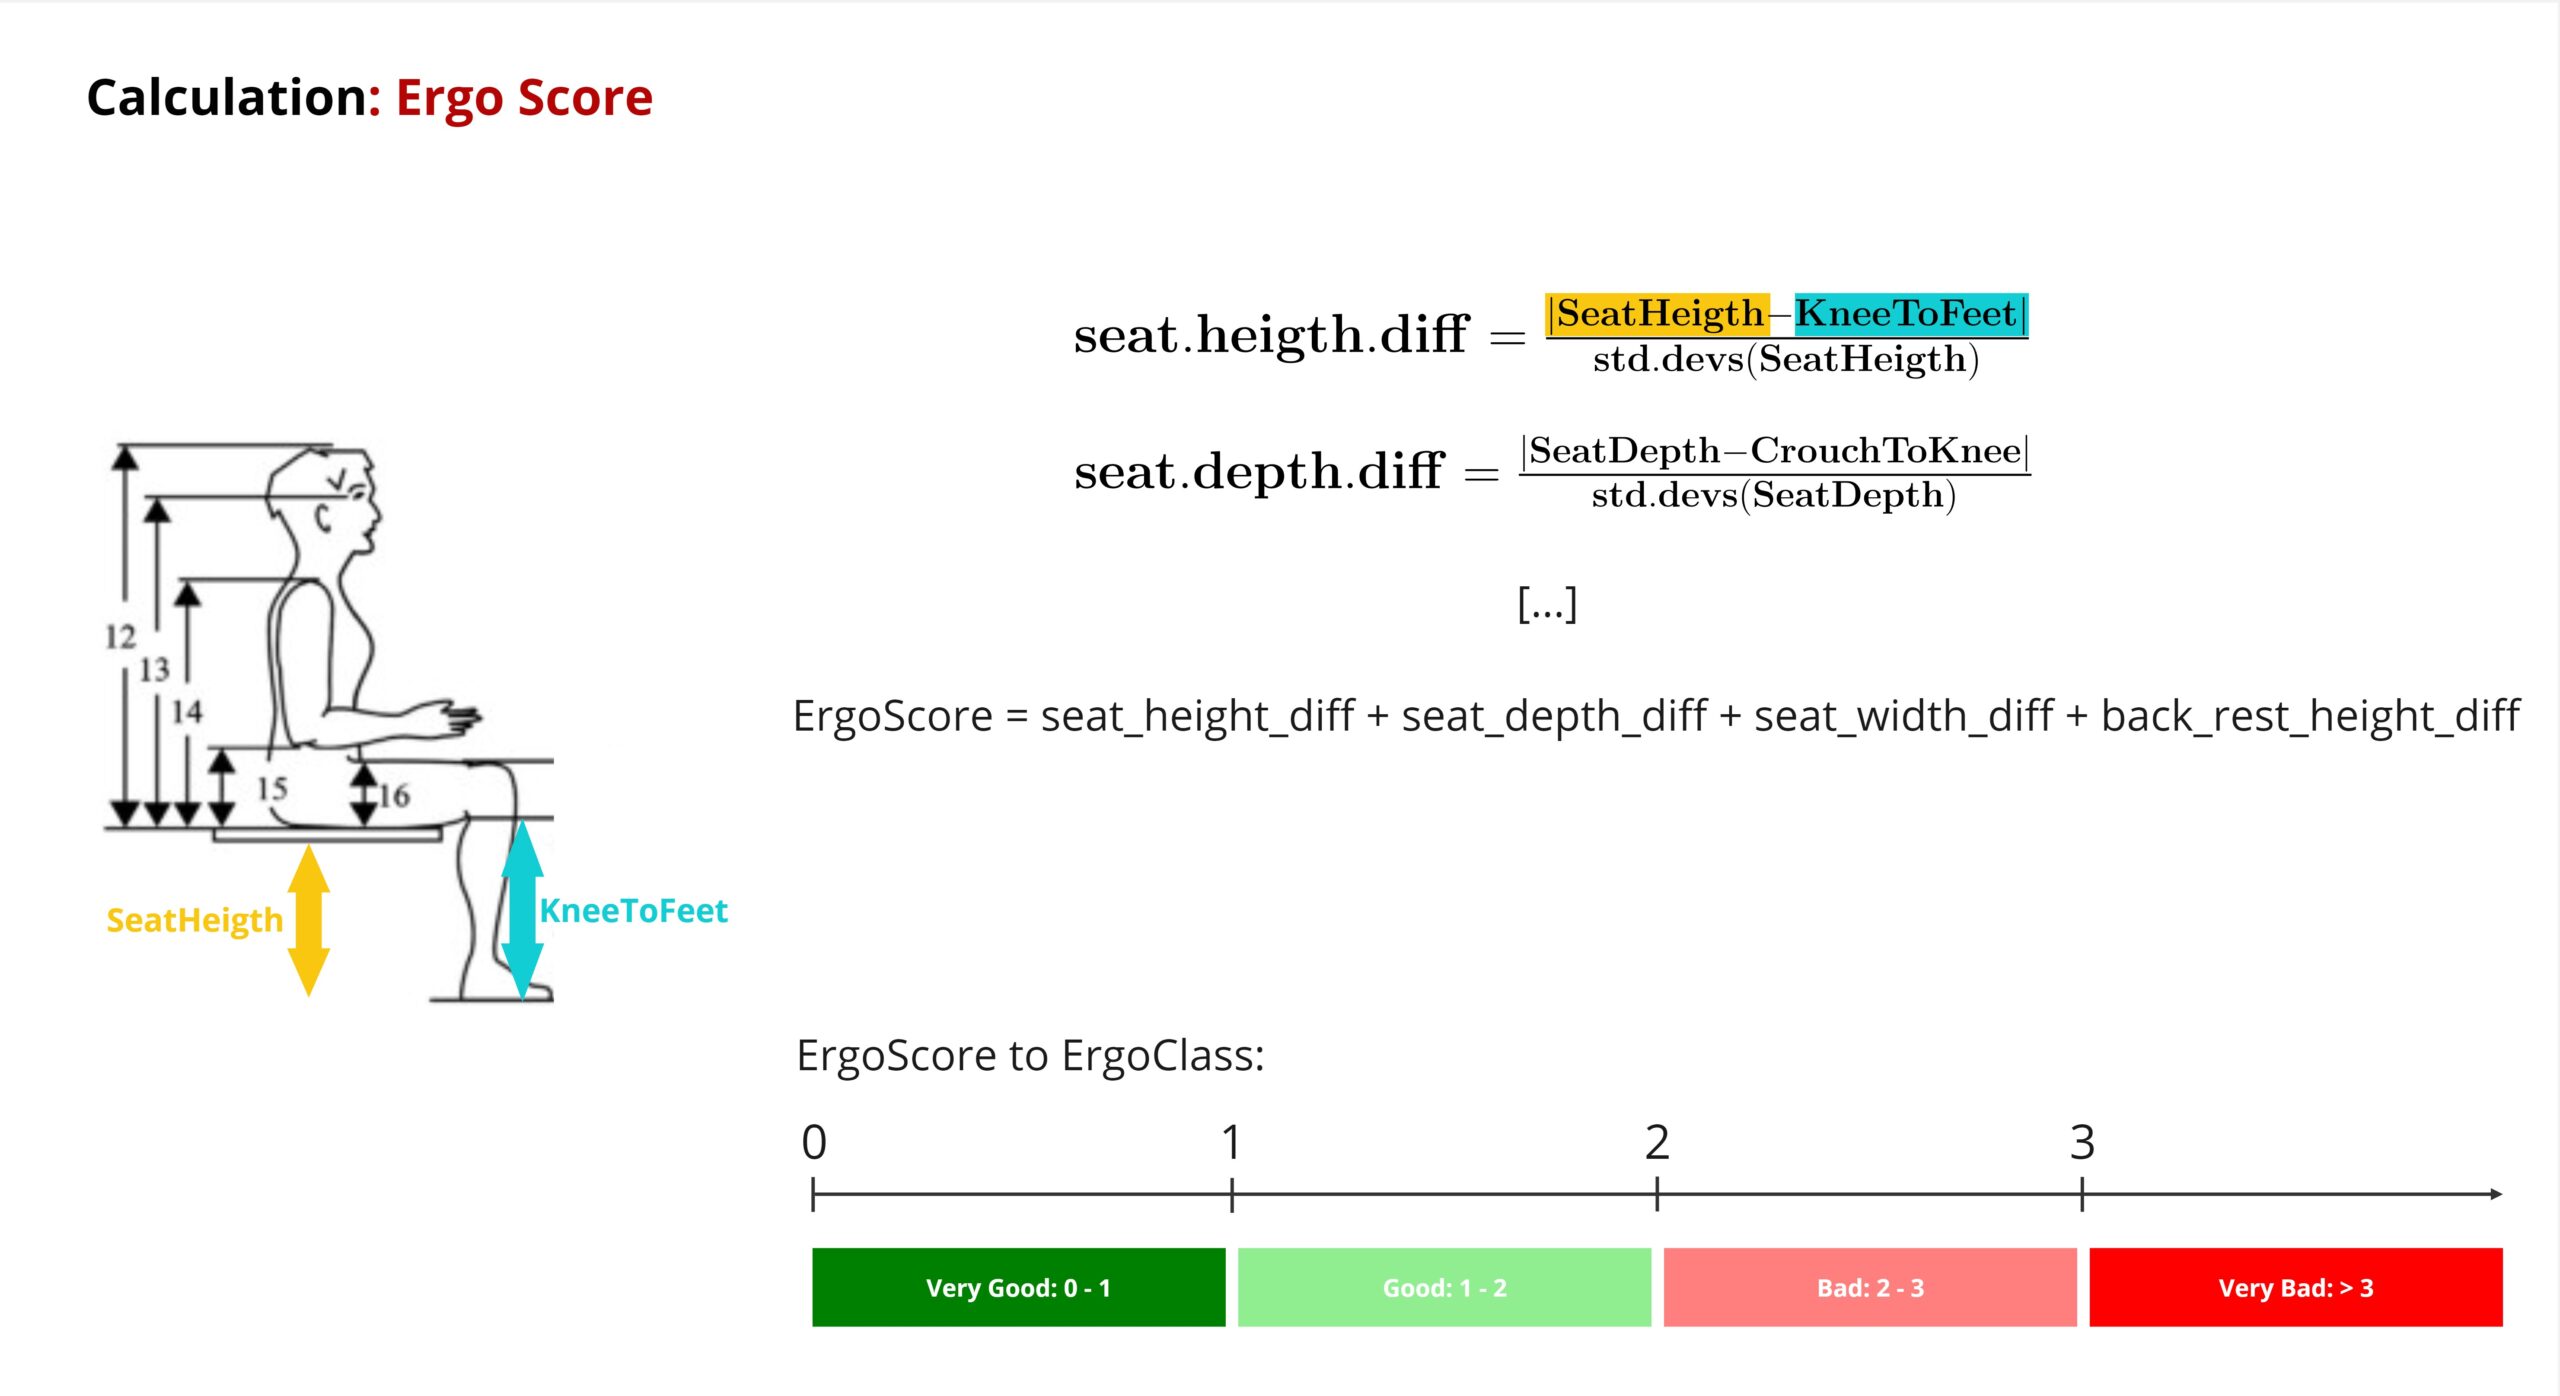
For each of these combinations, a ErgoScore and a ErgoClass were then determined to record the ergonomics of this configuration.
The ErgoScore was calculated as follows:
For a respective combination between related chair and human parameters such as SeatHeight and KneeToFeet length the absolute difference was determinated.
This value was then divided by the standard deviation of the chair parameter to obtain a normalization.
This process was repeated for all four feature pairs and then a sum is formed from the values.
This means that a combination with only minor deviations will receive a very low ErgoScore.
Finally, we used the ErgoScore to assign the ErgoClass. The limits shown here are freely chosen by us.
In the bottom area you can see how our combined data frame is composed.
In Index0-4 you can see how the person with ID0 (cyan marking) gradually tries one chair after another (green marking) and ErgoScore and ErgoClass are determined for each combination.
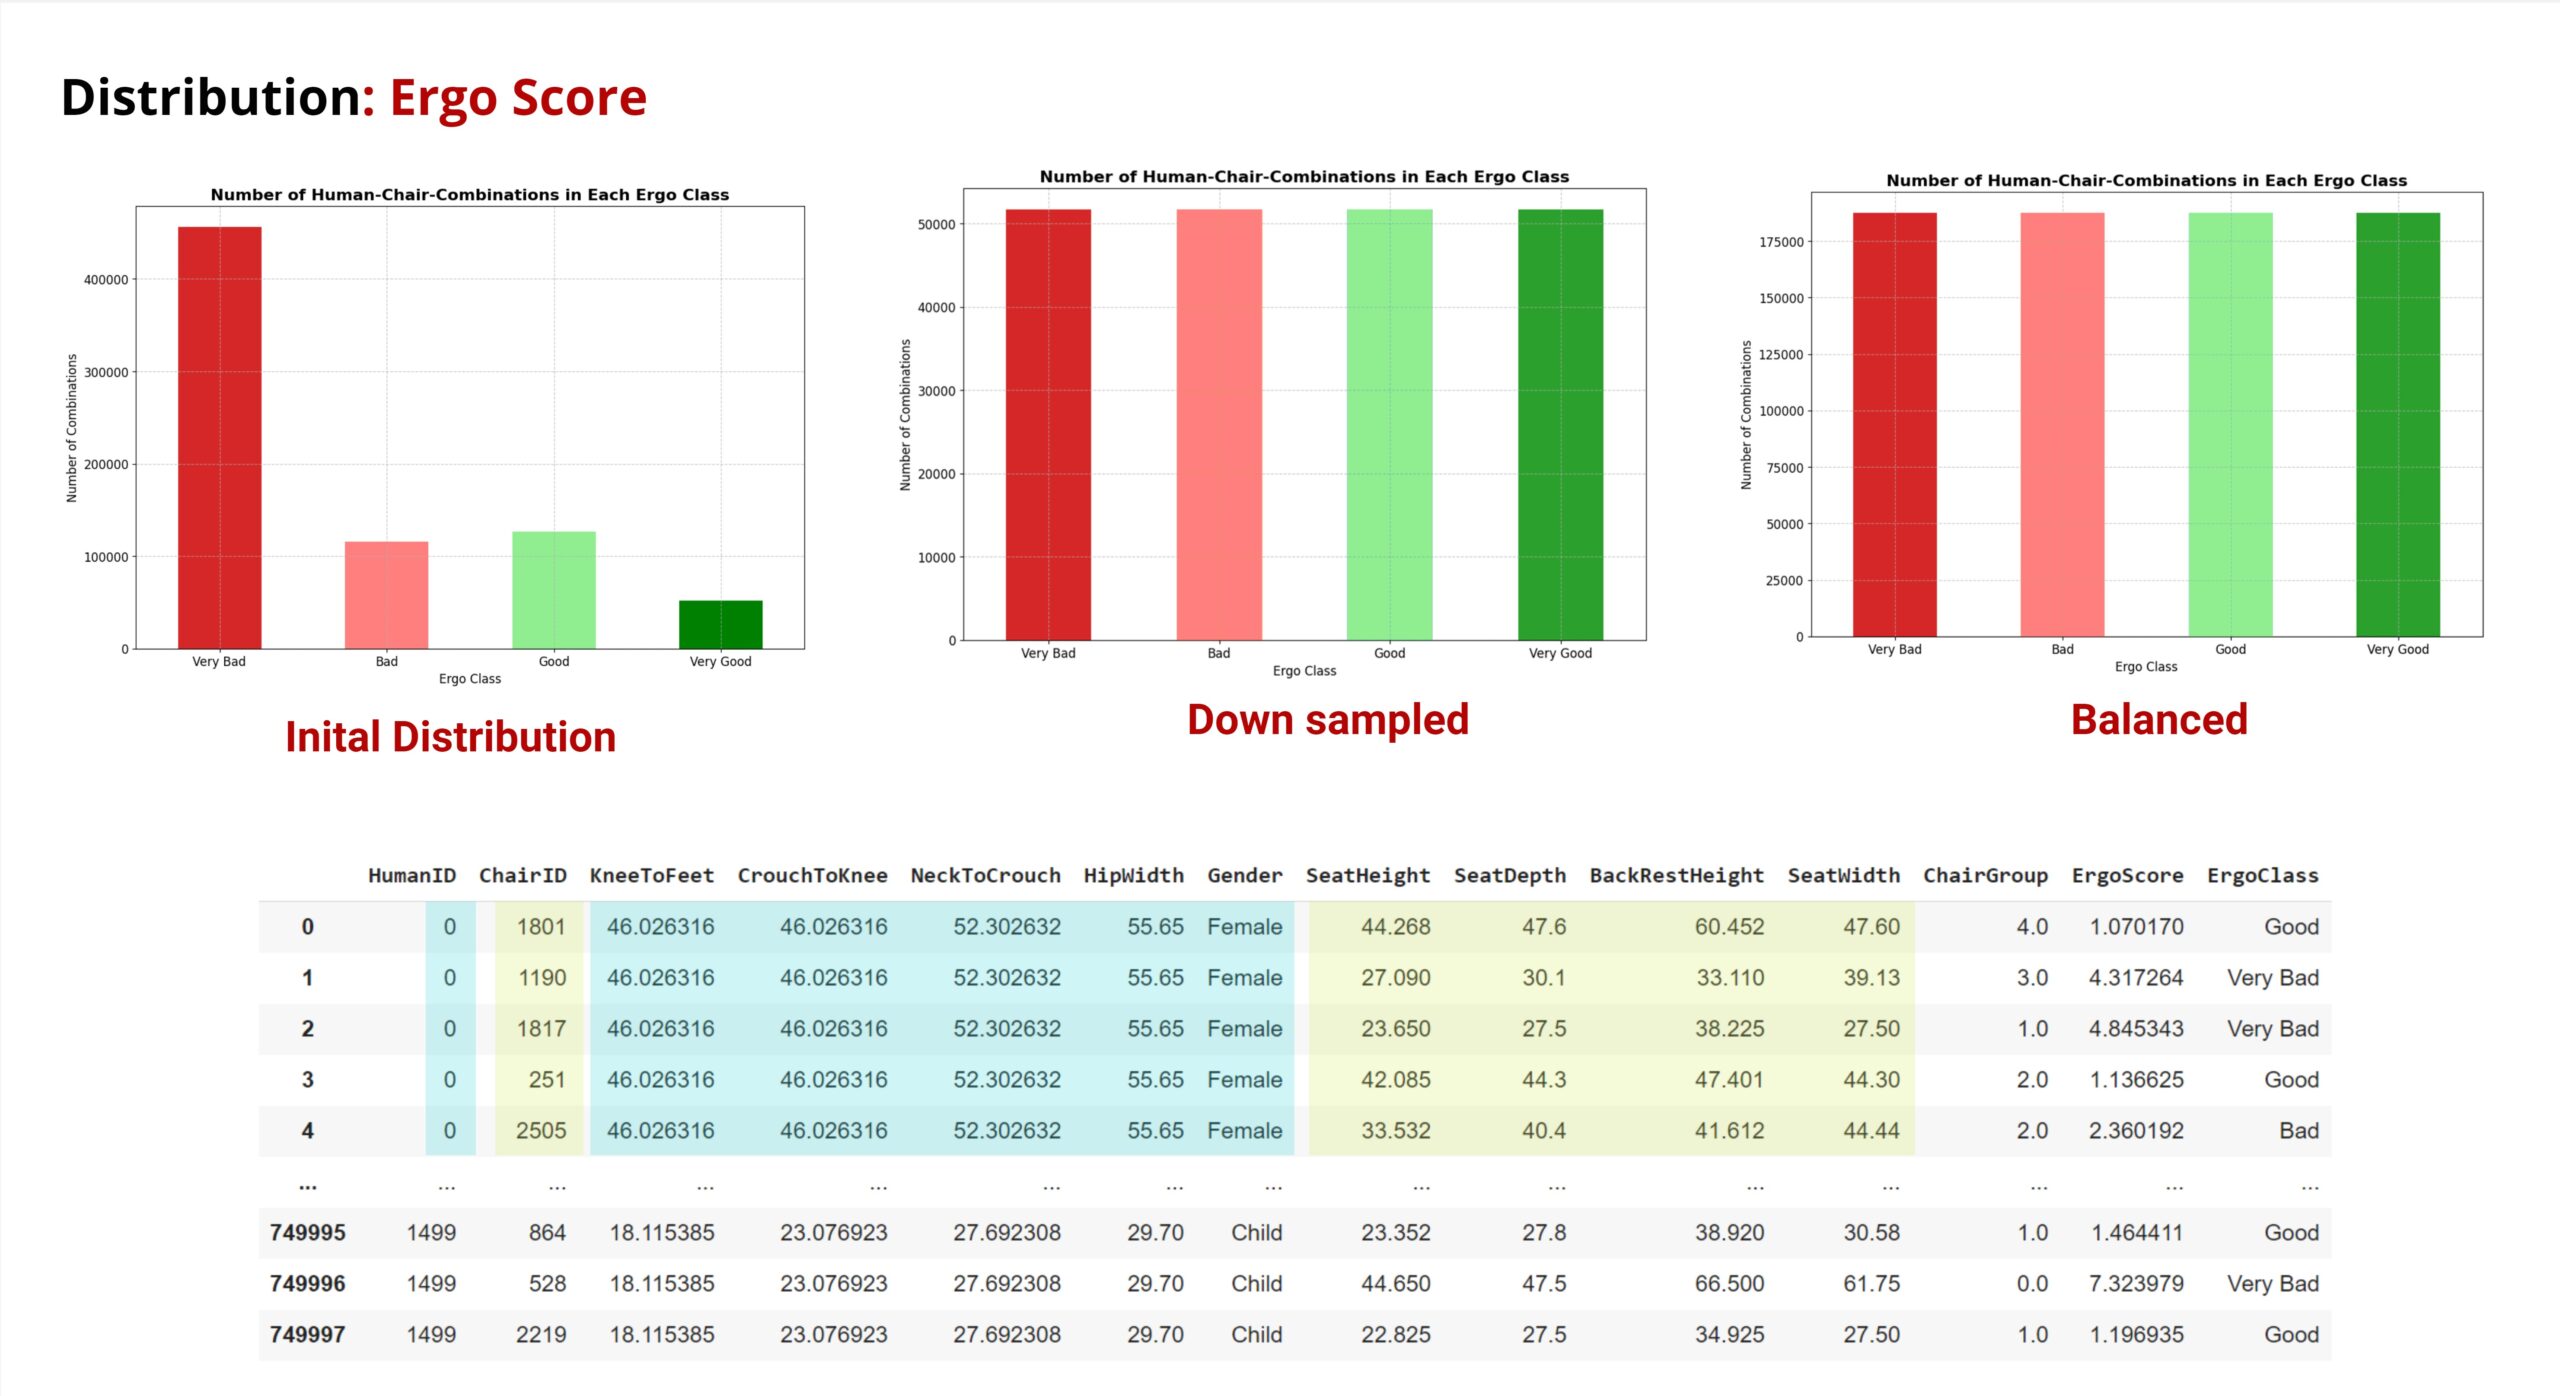
The top section shows the distribution of our ErgoClass. In the course of our project, we tried out various assignment criteria.
The plot on the left shows the original distribution.
The plot in the center shows downsampling in which the corresponding data points were reduced to the number of the smallest “Very Good” column.
The plot on the right shows a Distribution determined by quantiles. This one actually provided the
best result, but we decided not to continue using it. Because we would be giving up control over our class boundaries
We have opted for the downsampled version, even though many data points are discarded in the process.
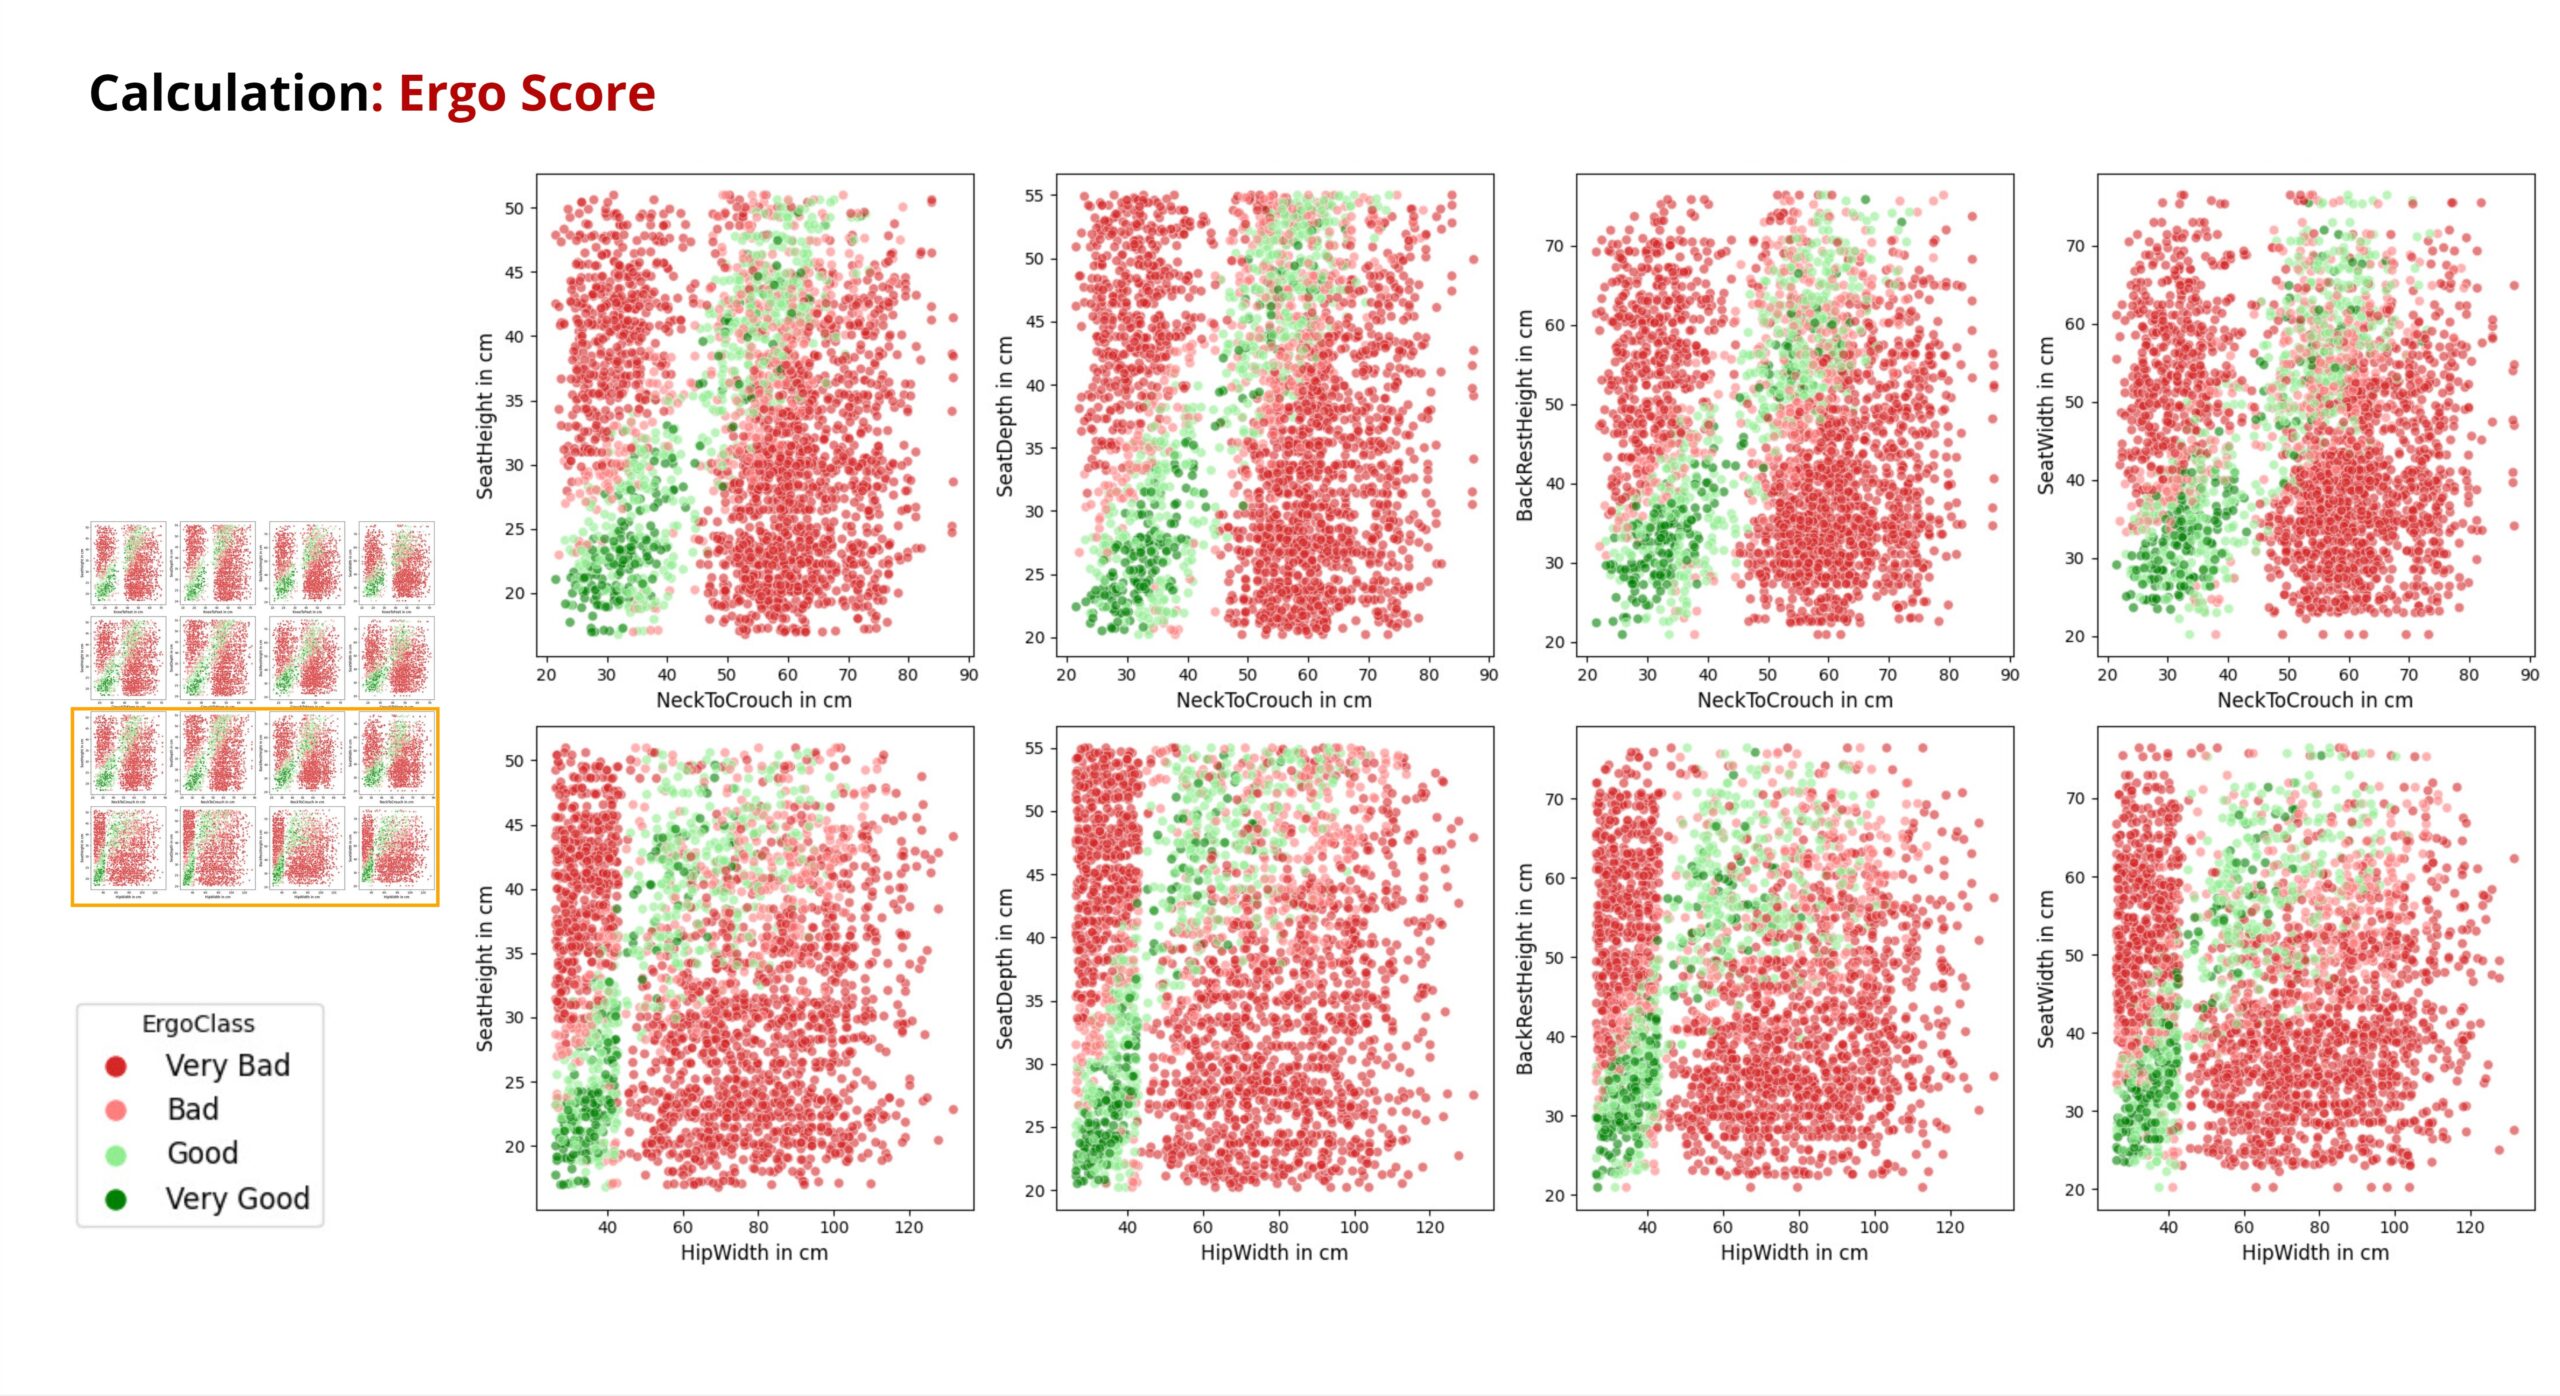
Let’s take a look at the results in this scatterplot that shows the human features against the chair features. As it could already be seen from the distribution bar chart, the unergonomic chairs are in the majority.
For the green and light green points, again a positive correlation can be observed in most plots.
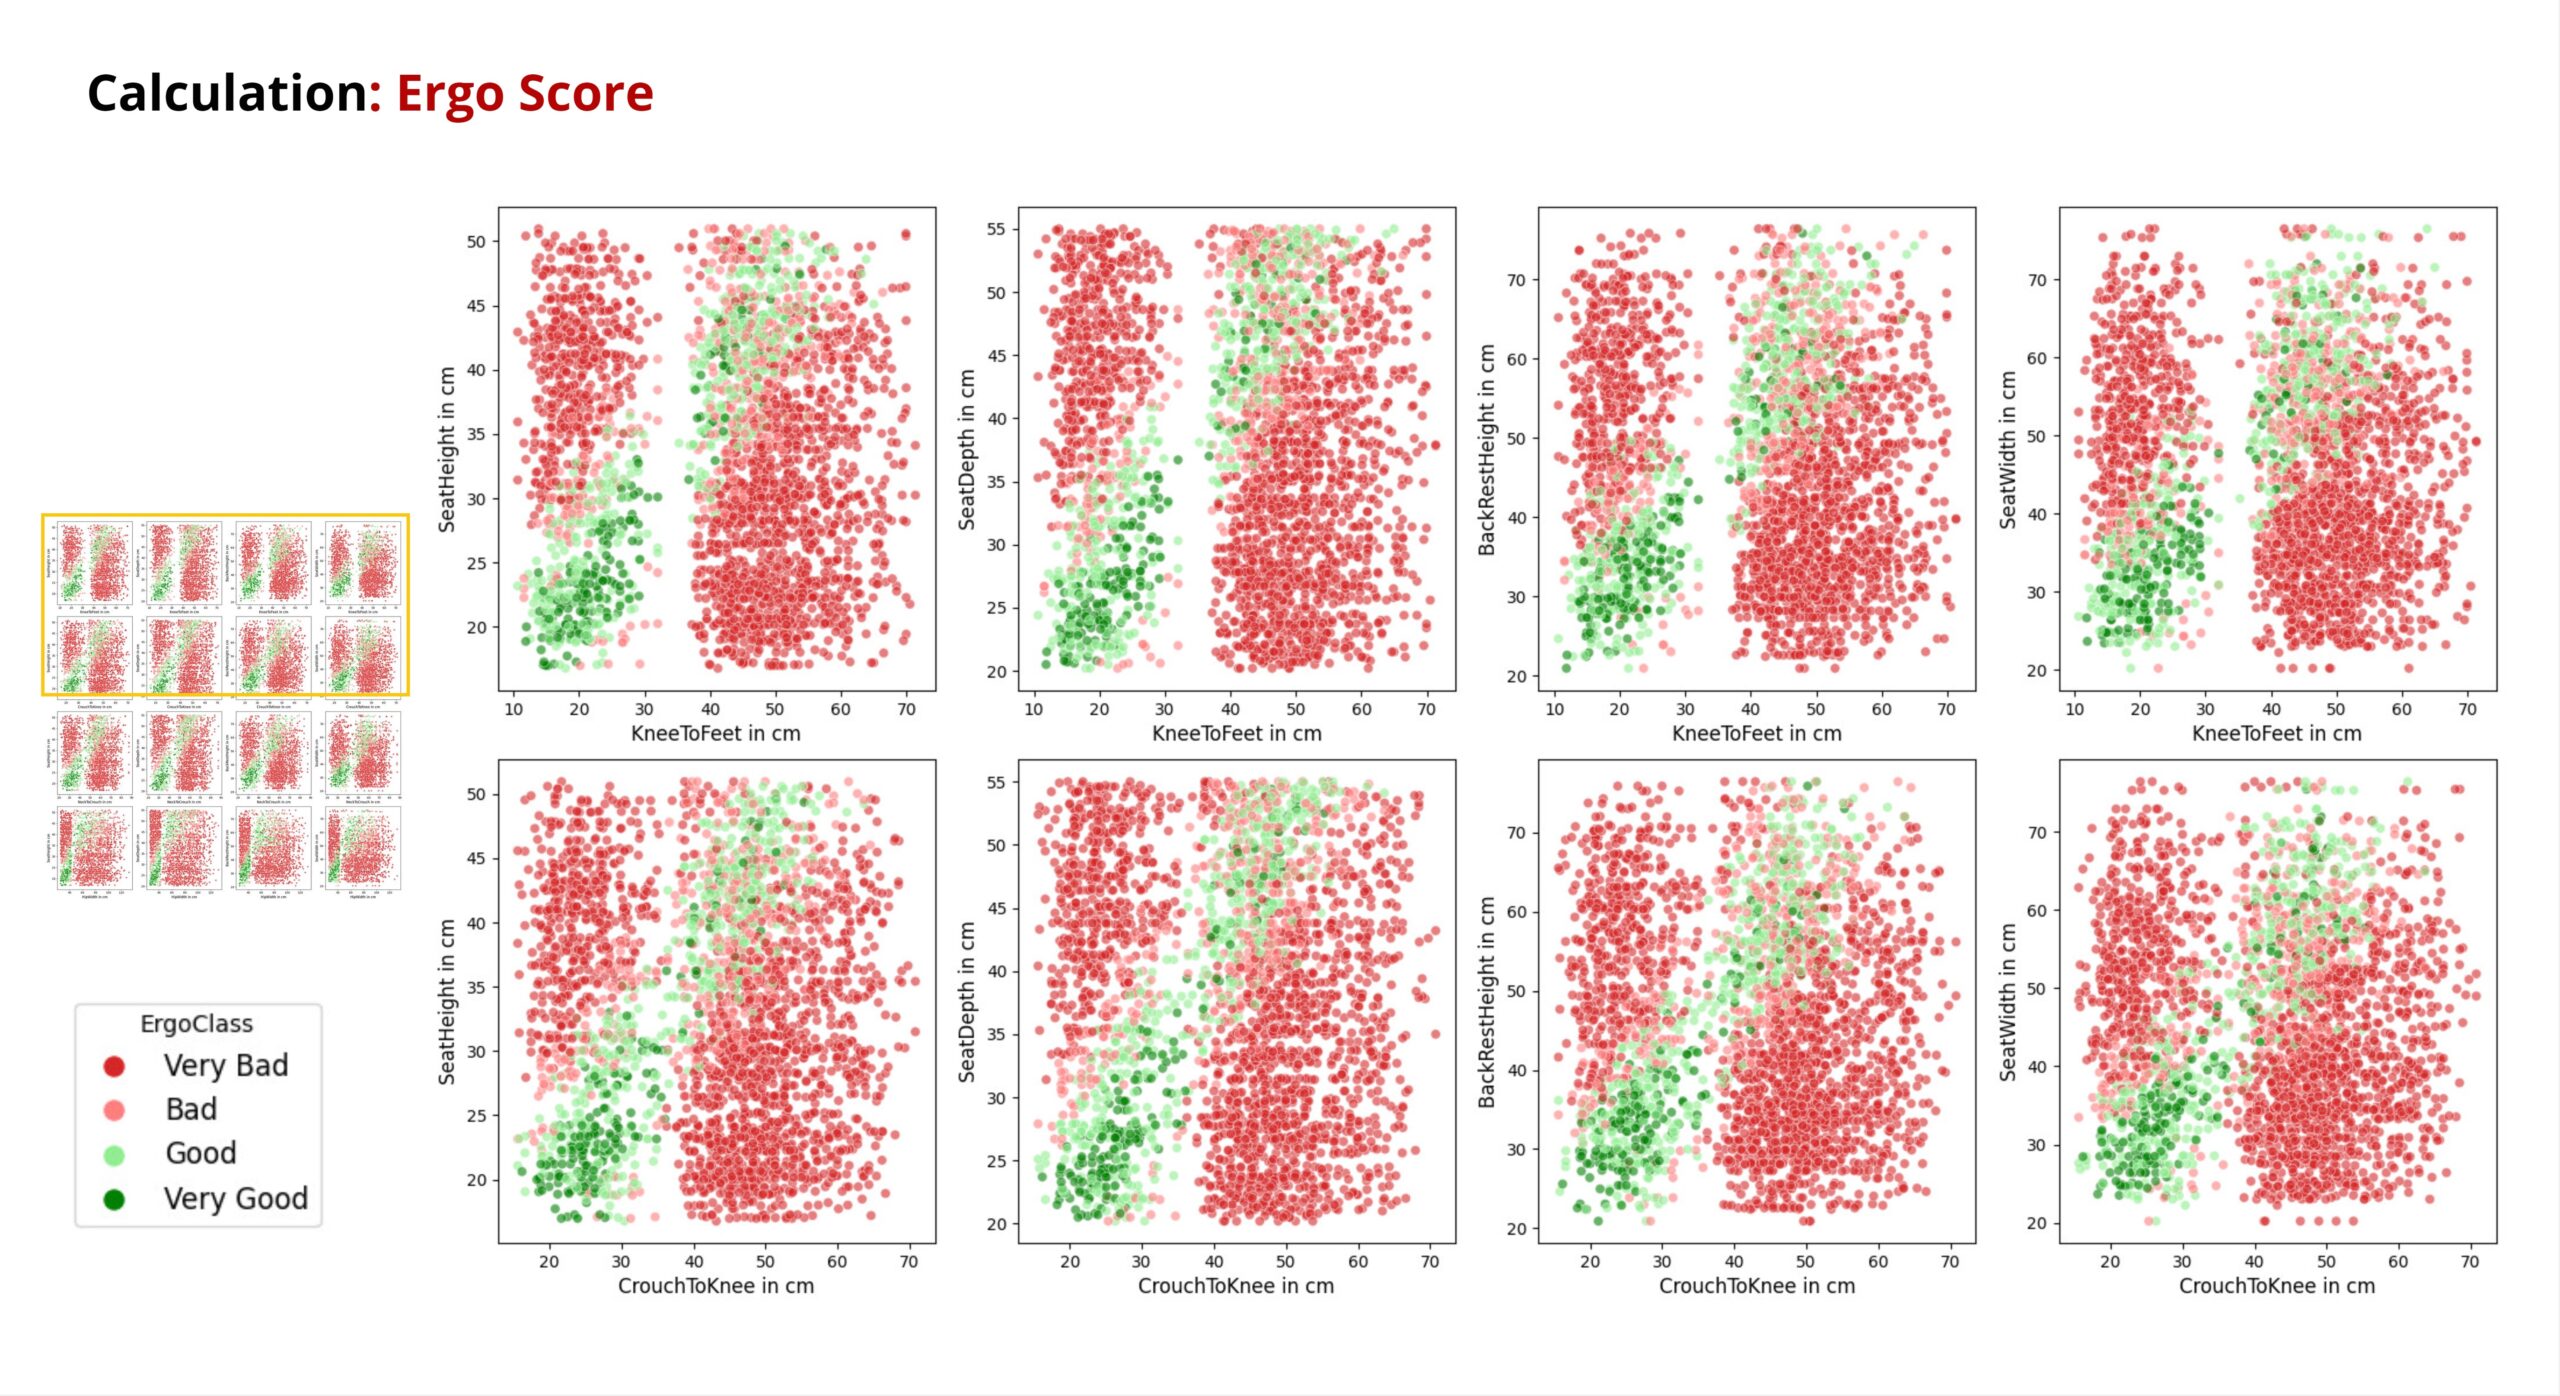
By showing the bottom part of the scatterplot also the gap between children and adults can also be recognised.
Now for the Training part Let’s take a look at the results
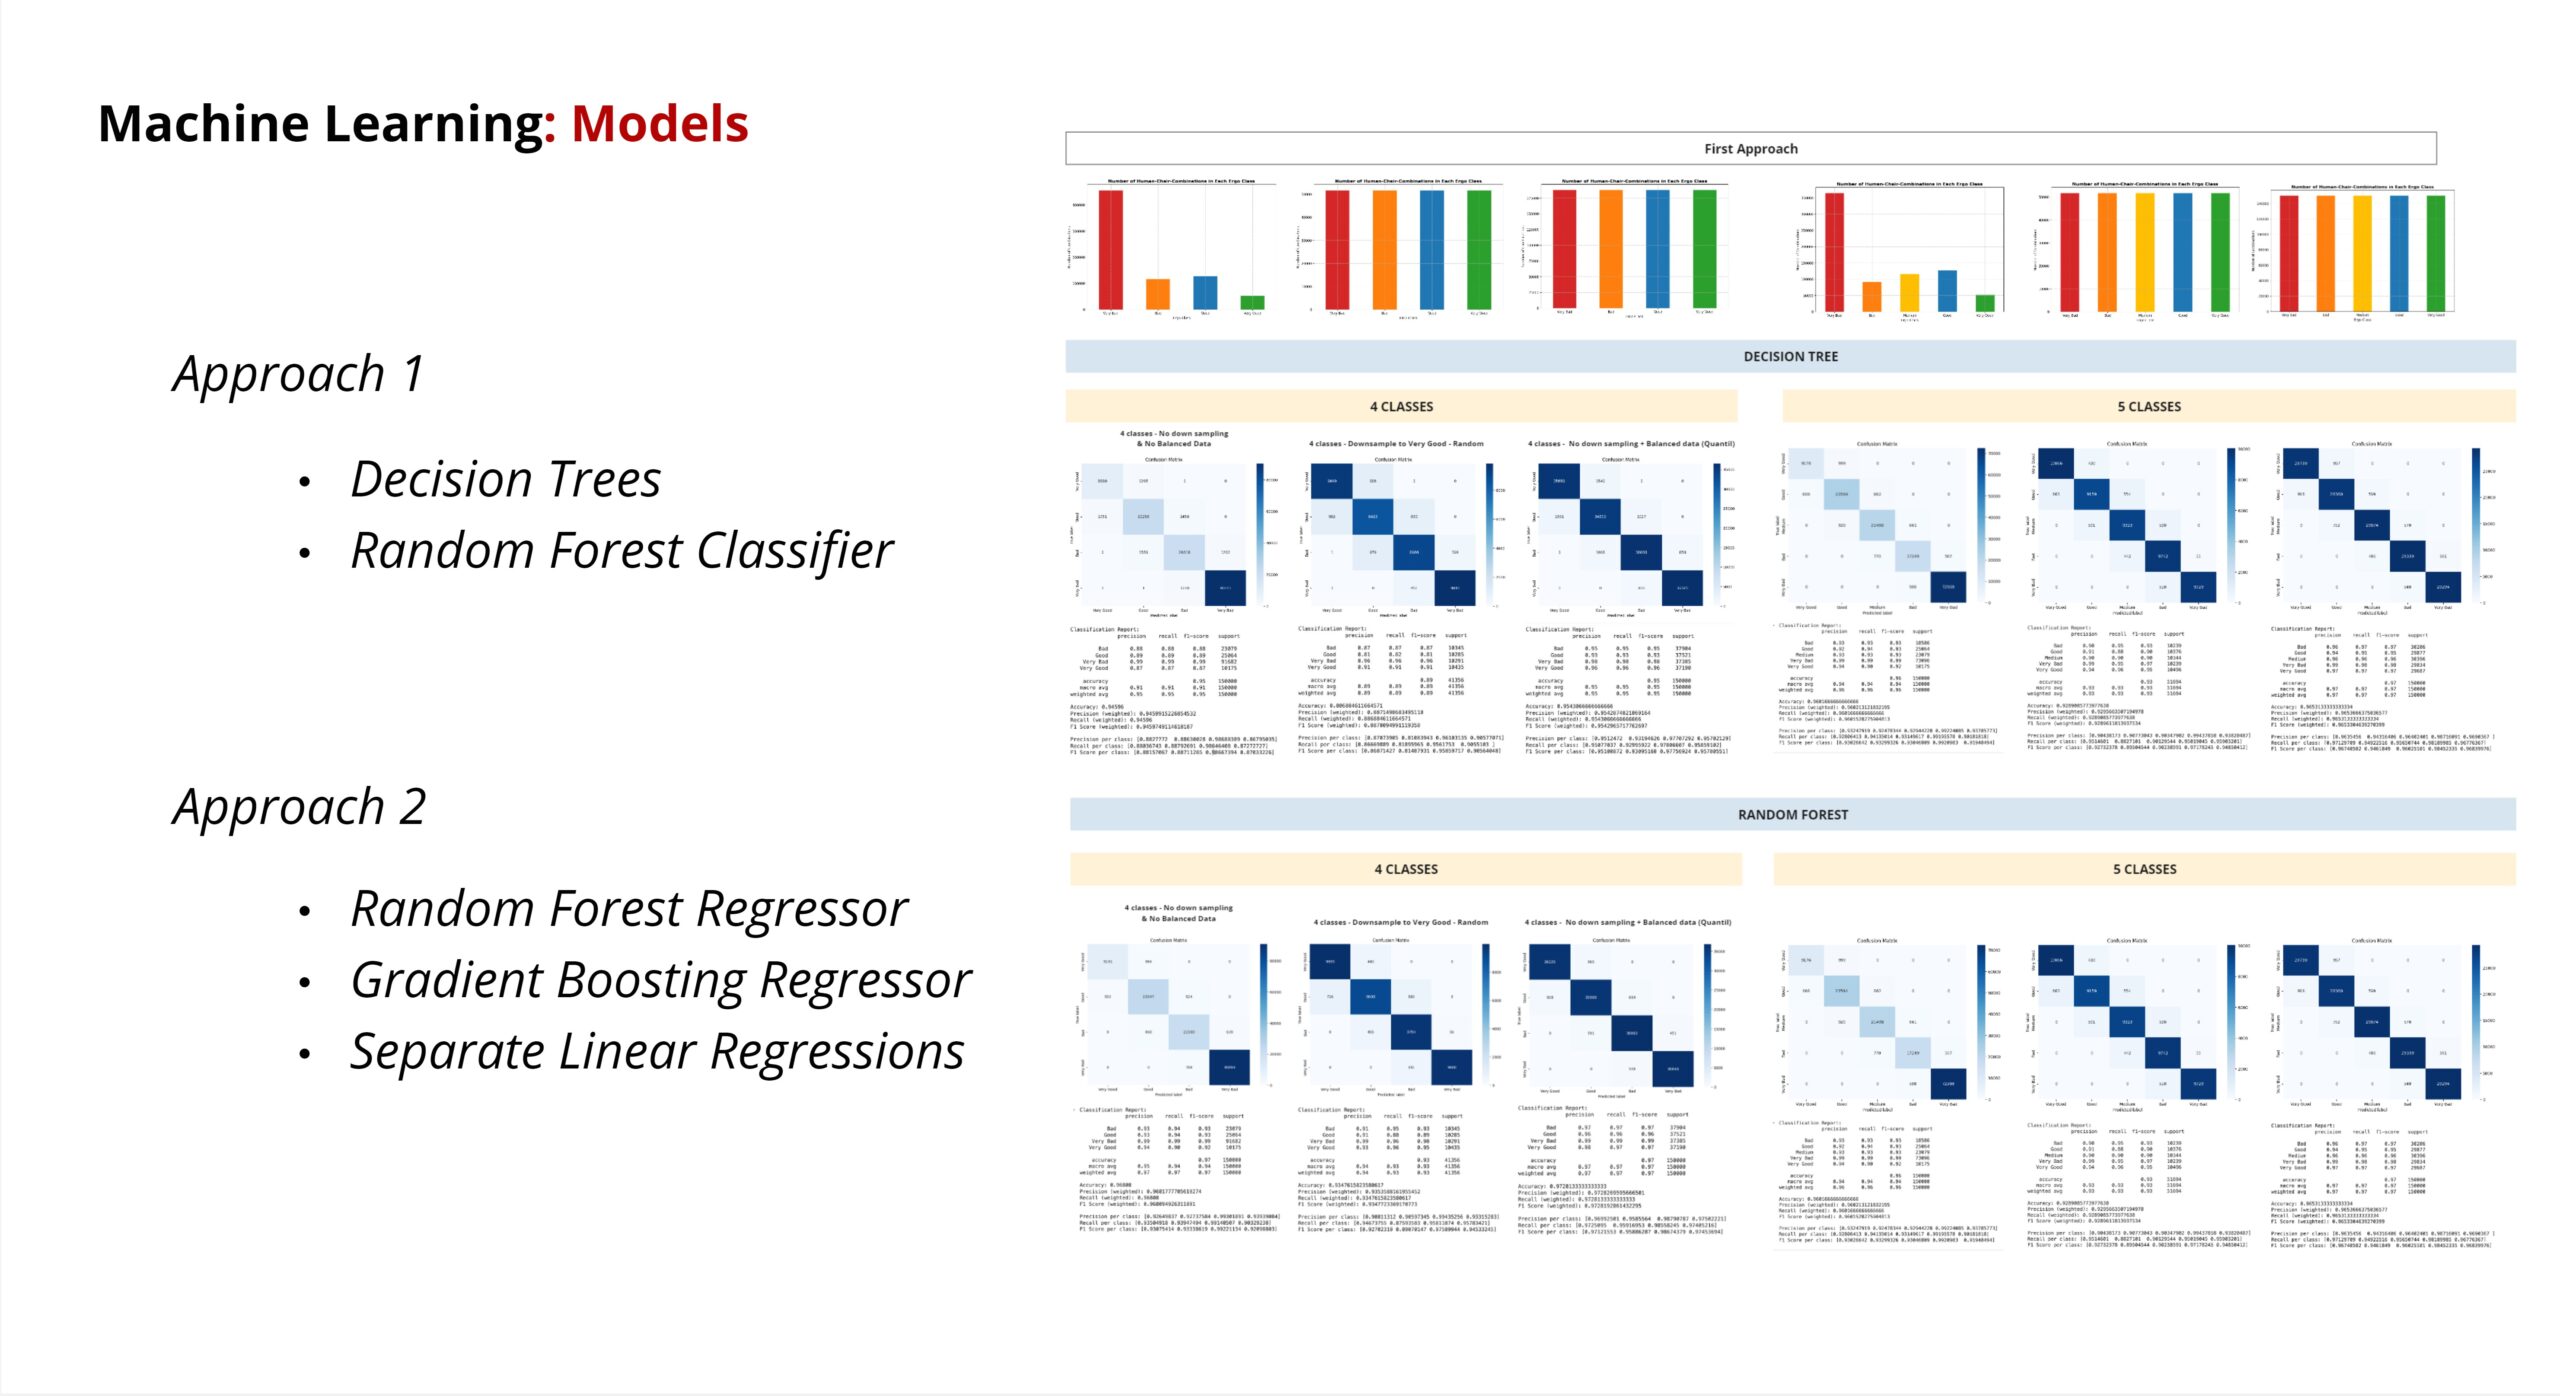
In order to follow our original approaches, we had to choose different ML models.
We have Tired various models for Approach1. The best classification was achieved with Decision Trees and the Random Forest Classifier.
For Approach2, we initially tried to perform a prediction using separate linear regression models – but with less success.
Tests with the random forest regressor were most successful.
On the right you can see some of the records we kept to document the results of varying the number of classes, ML models , and assignment methods.
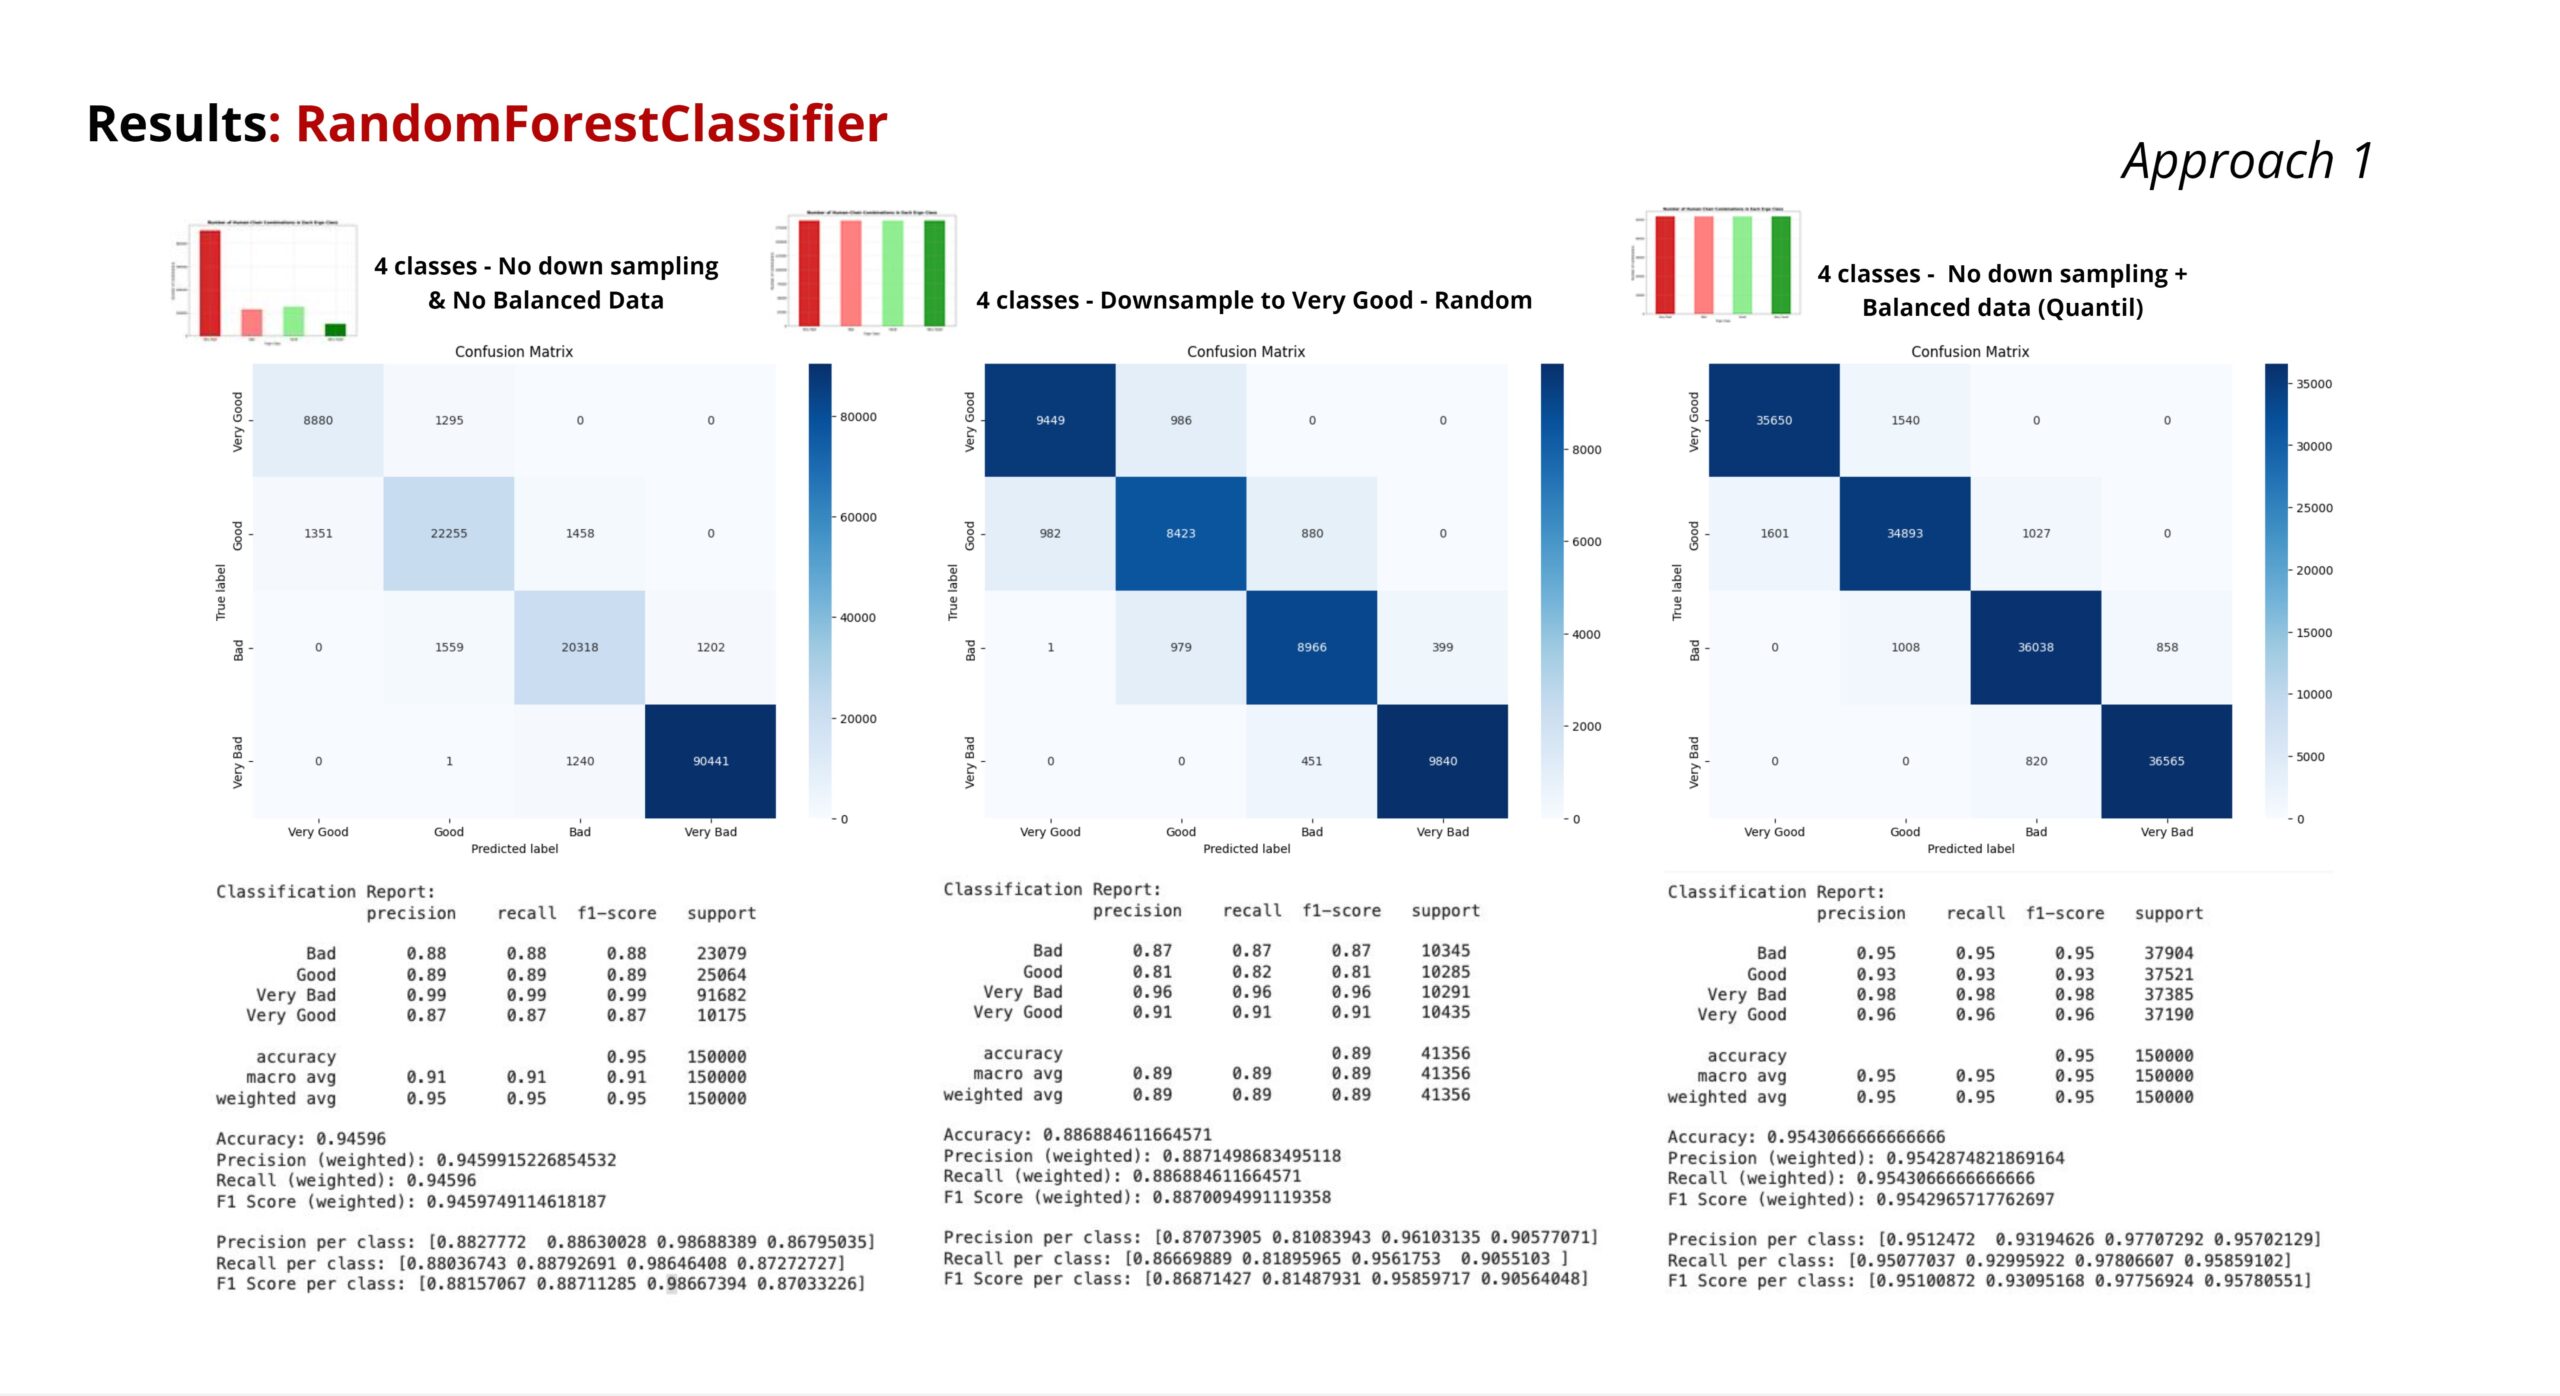
Here are the results for our classification task in Approach1
These confusion matrices originated from a Random Forest Classifier with the three described Data processing methods.
the values of all three are predominantly above the 0.85 mark.
the original model with a strong imbalance naturally has a high accuracy in the special category.
The quantile approach has very good values, but as we said, we are not continuing with it.
Despite the lower values, we have chosen to follow the middle approach, as we assume that the most balanced result can be achieved by adding further synthesised data.
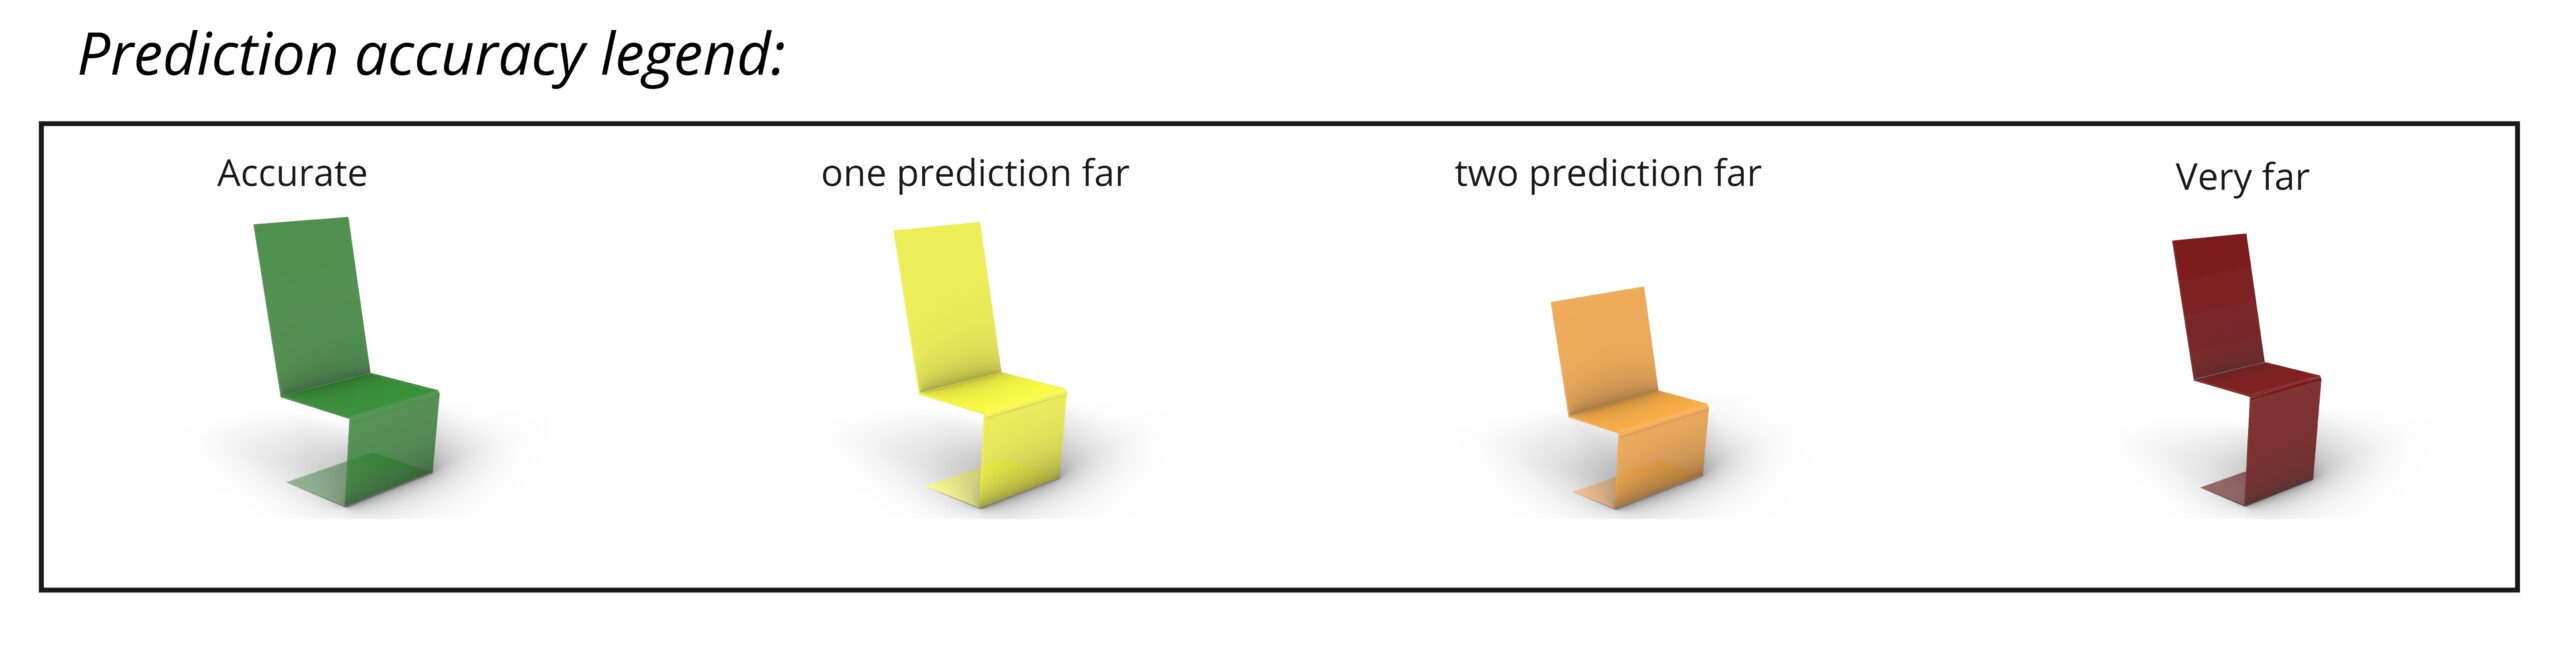
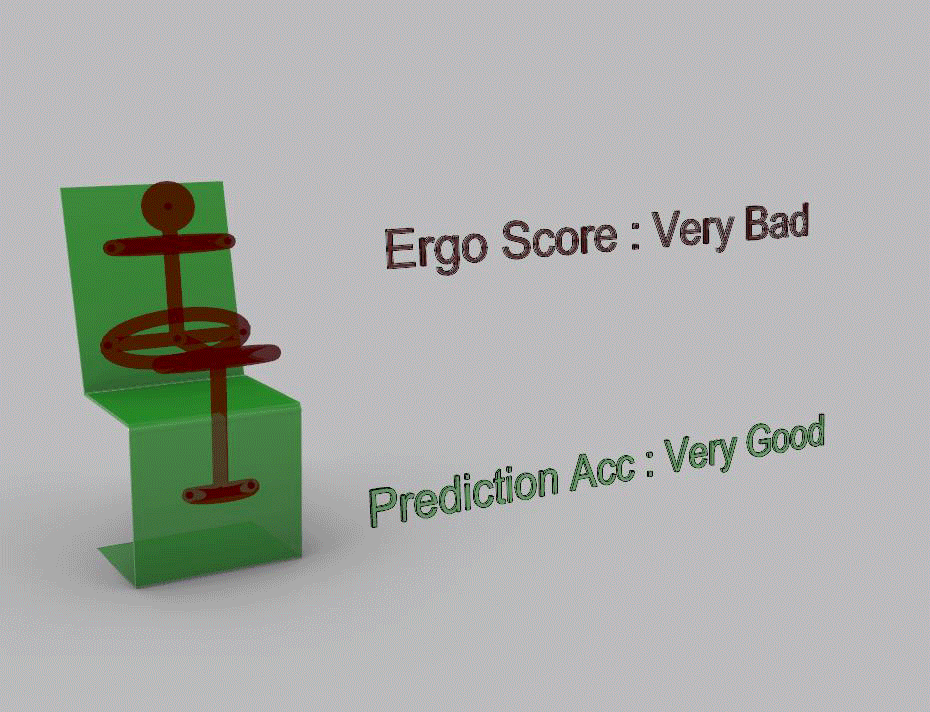
On the right side is the prediction accuracy legend, indicating if the prediction is accurate, one prediction away, two predictions away, or three classes away.
The measurements of randomly generated people and selected chairs are passed to the model to observe how far the prediction deviates from the ground truth.
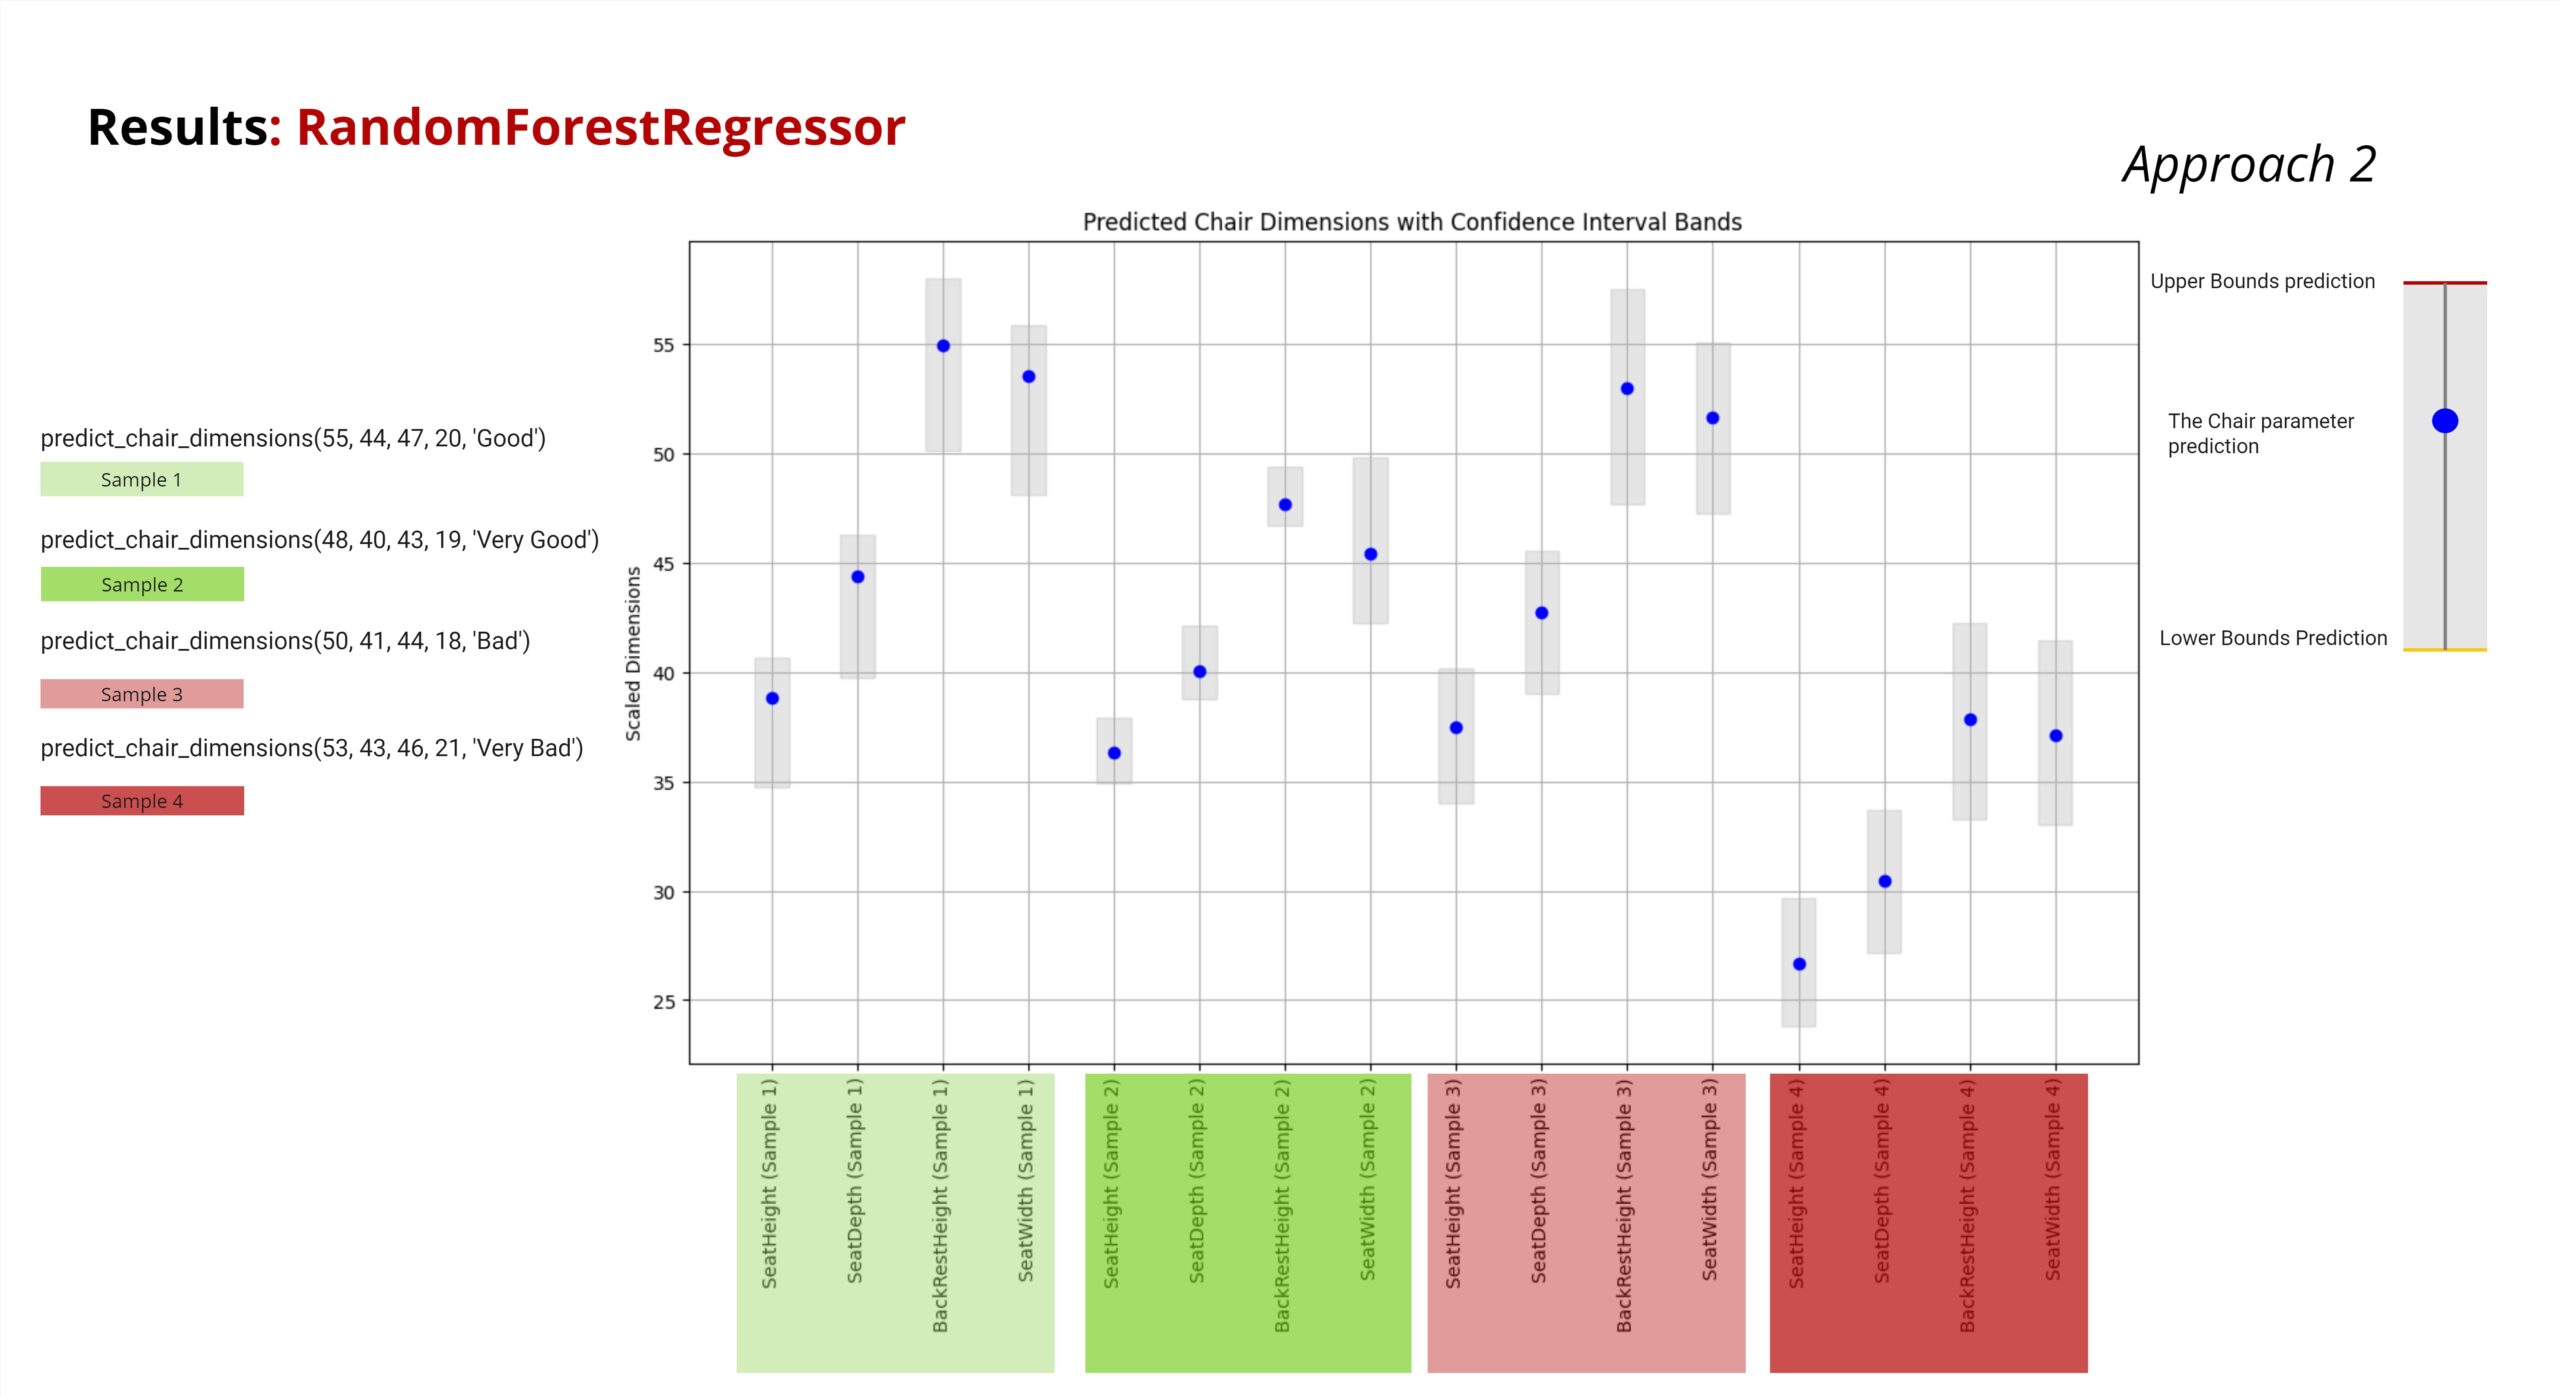
Moving on to the second approach where we are inputting Human anthropometric Measurements and a Desired Ergo Class and Predicting a range of chair geometries falling in that Ergo class.
this approach as shown predicts a chair that is matching to the chair parameters with the specified class
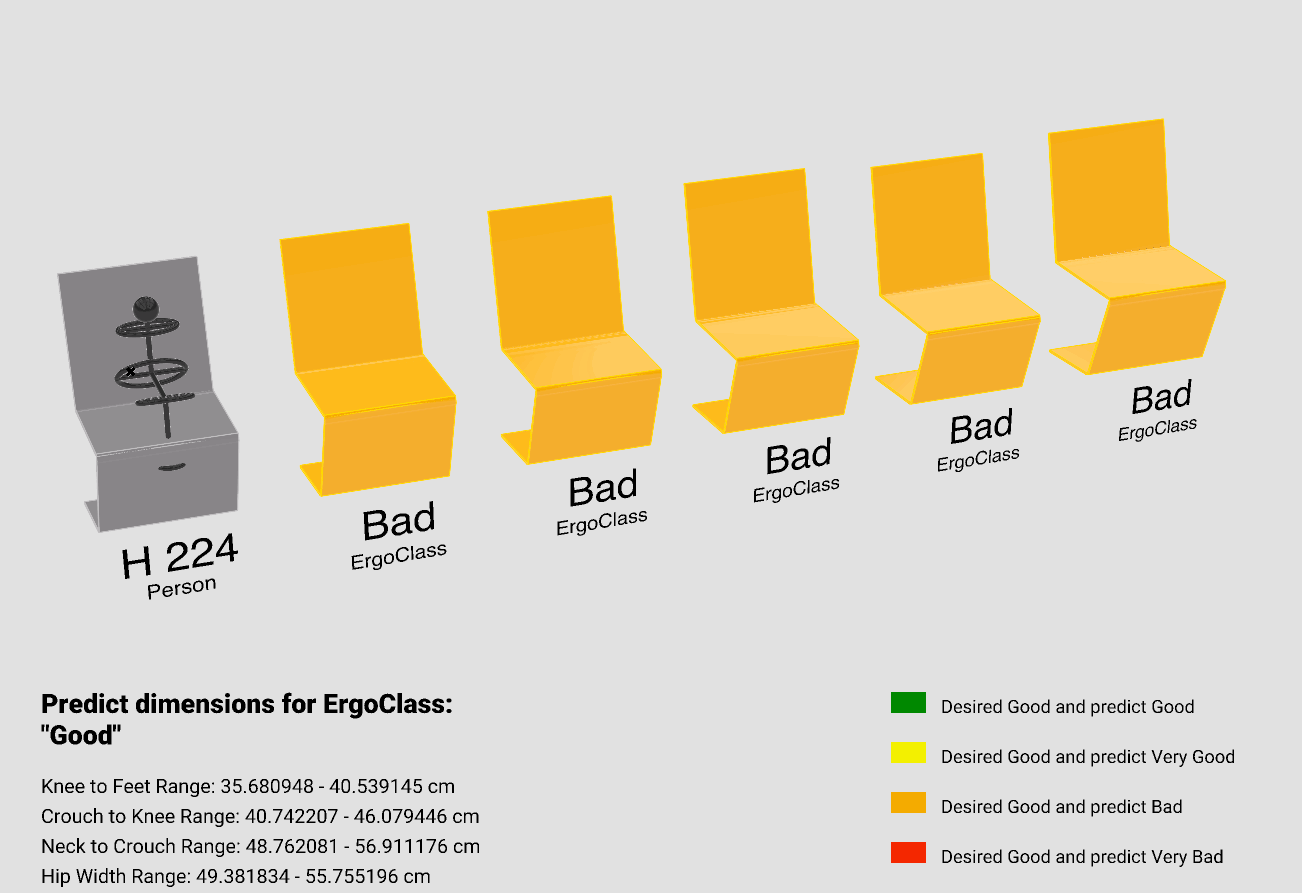
Using Grasshopper, we visualized our model. For this approach, we utilized our model’s predictions to Predict the upper and lower bounds for each Chair parameter. Subsequently, we created five chairs within those ranges.
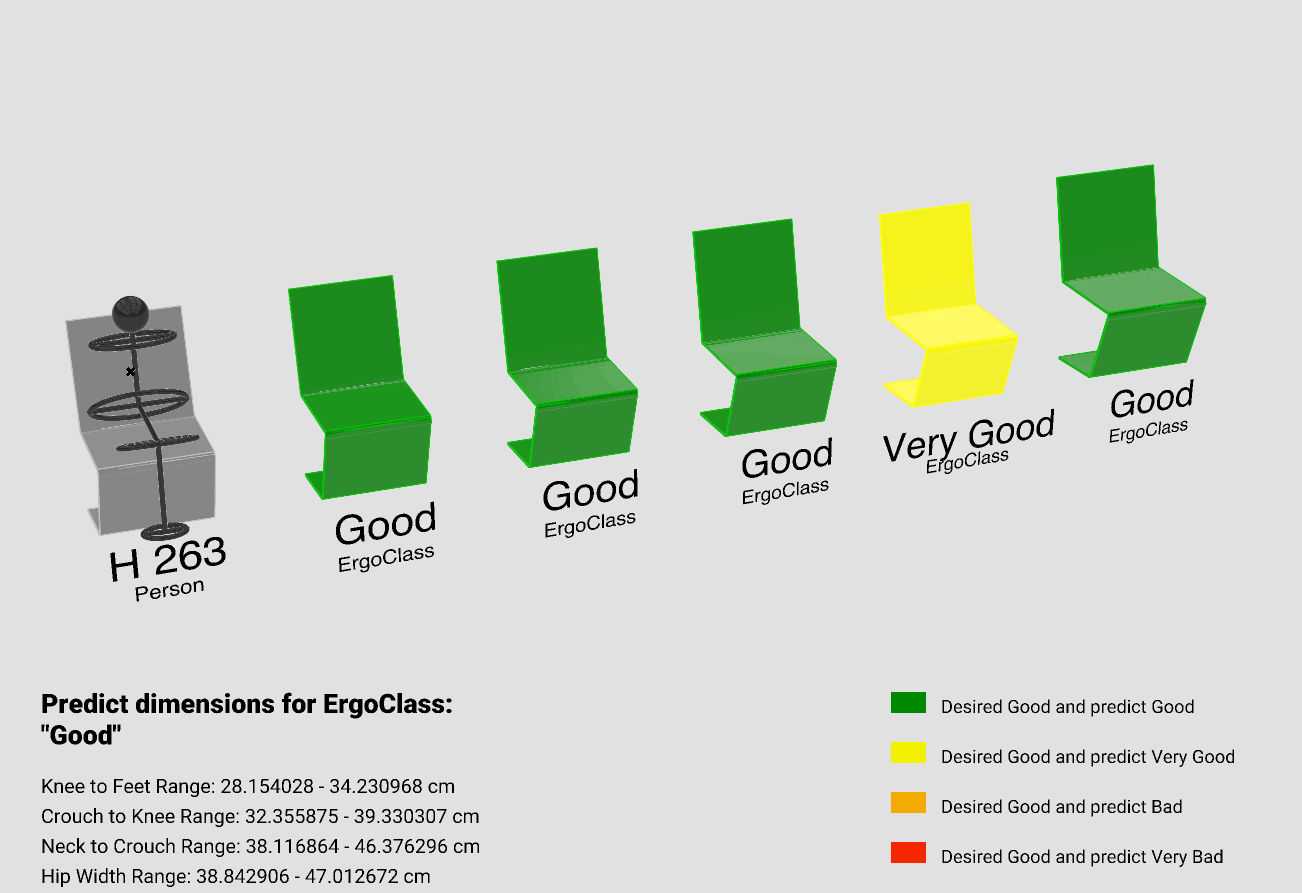
In order to validate how good are the prediction, we recalculated the ErgoClass for each of the five generated chairs and compared these to the desired ErgoClass, which we specified as “Good”.
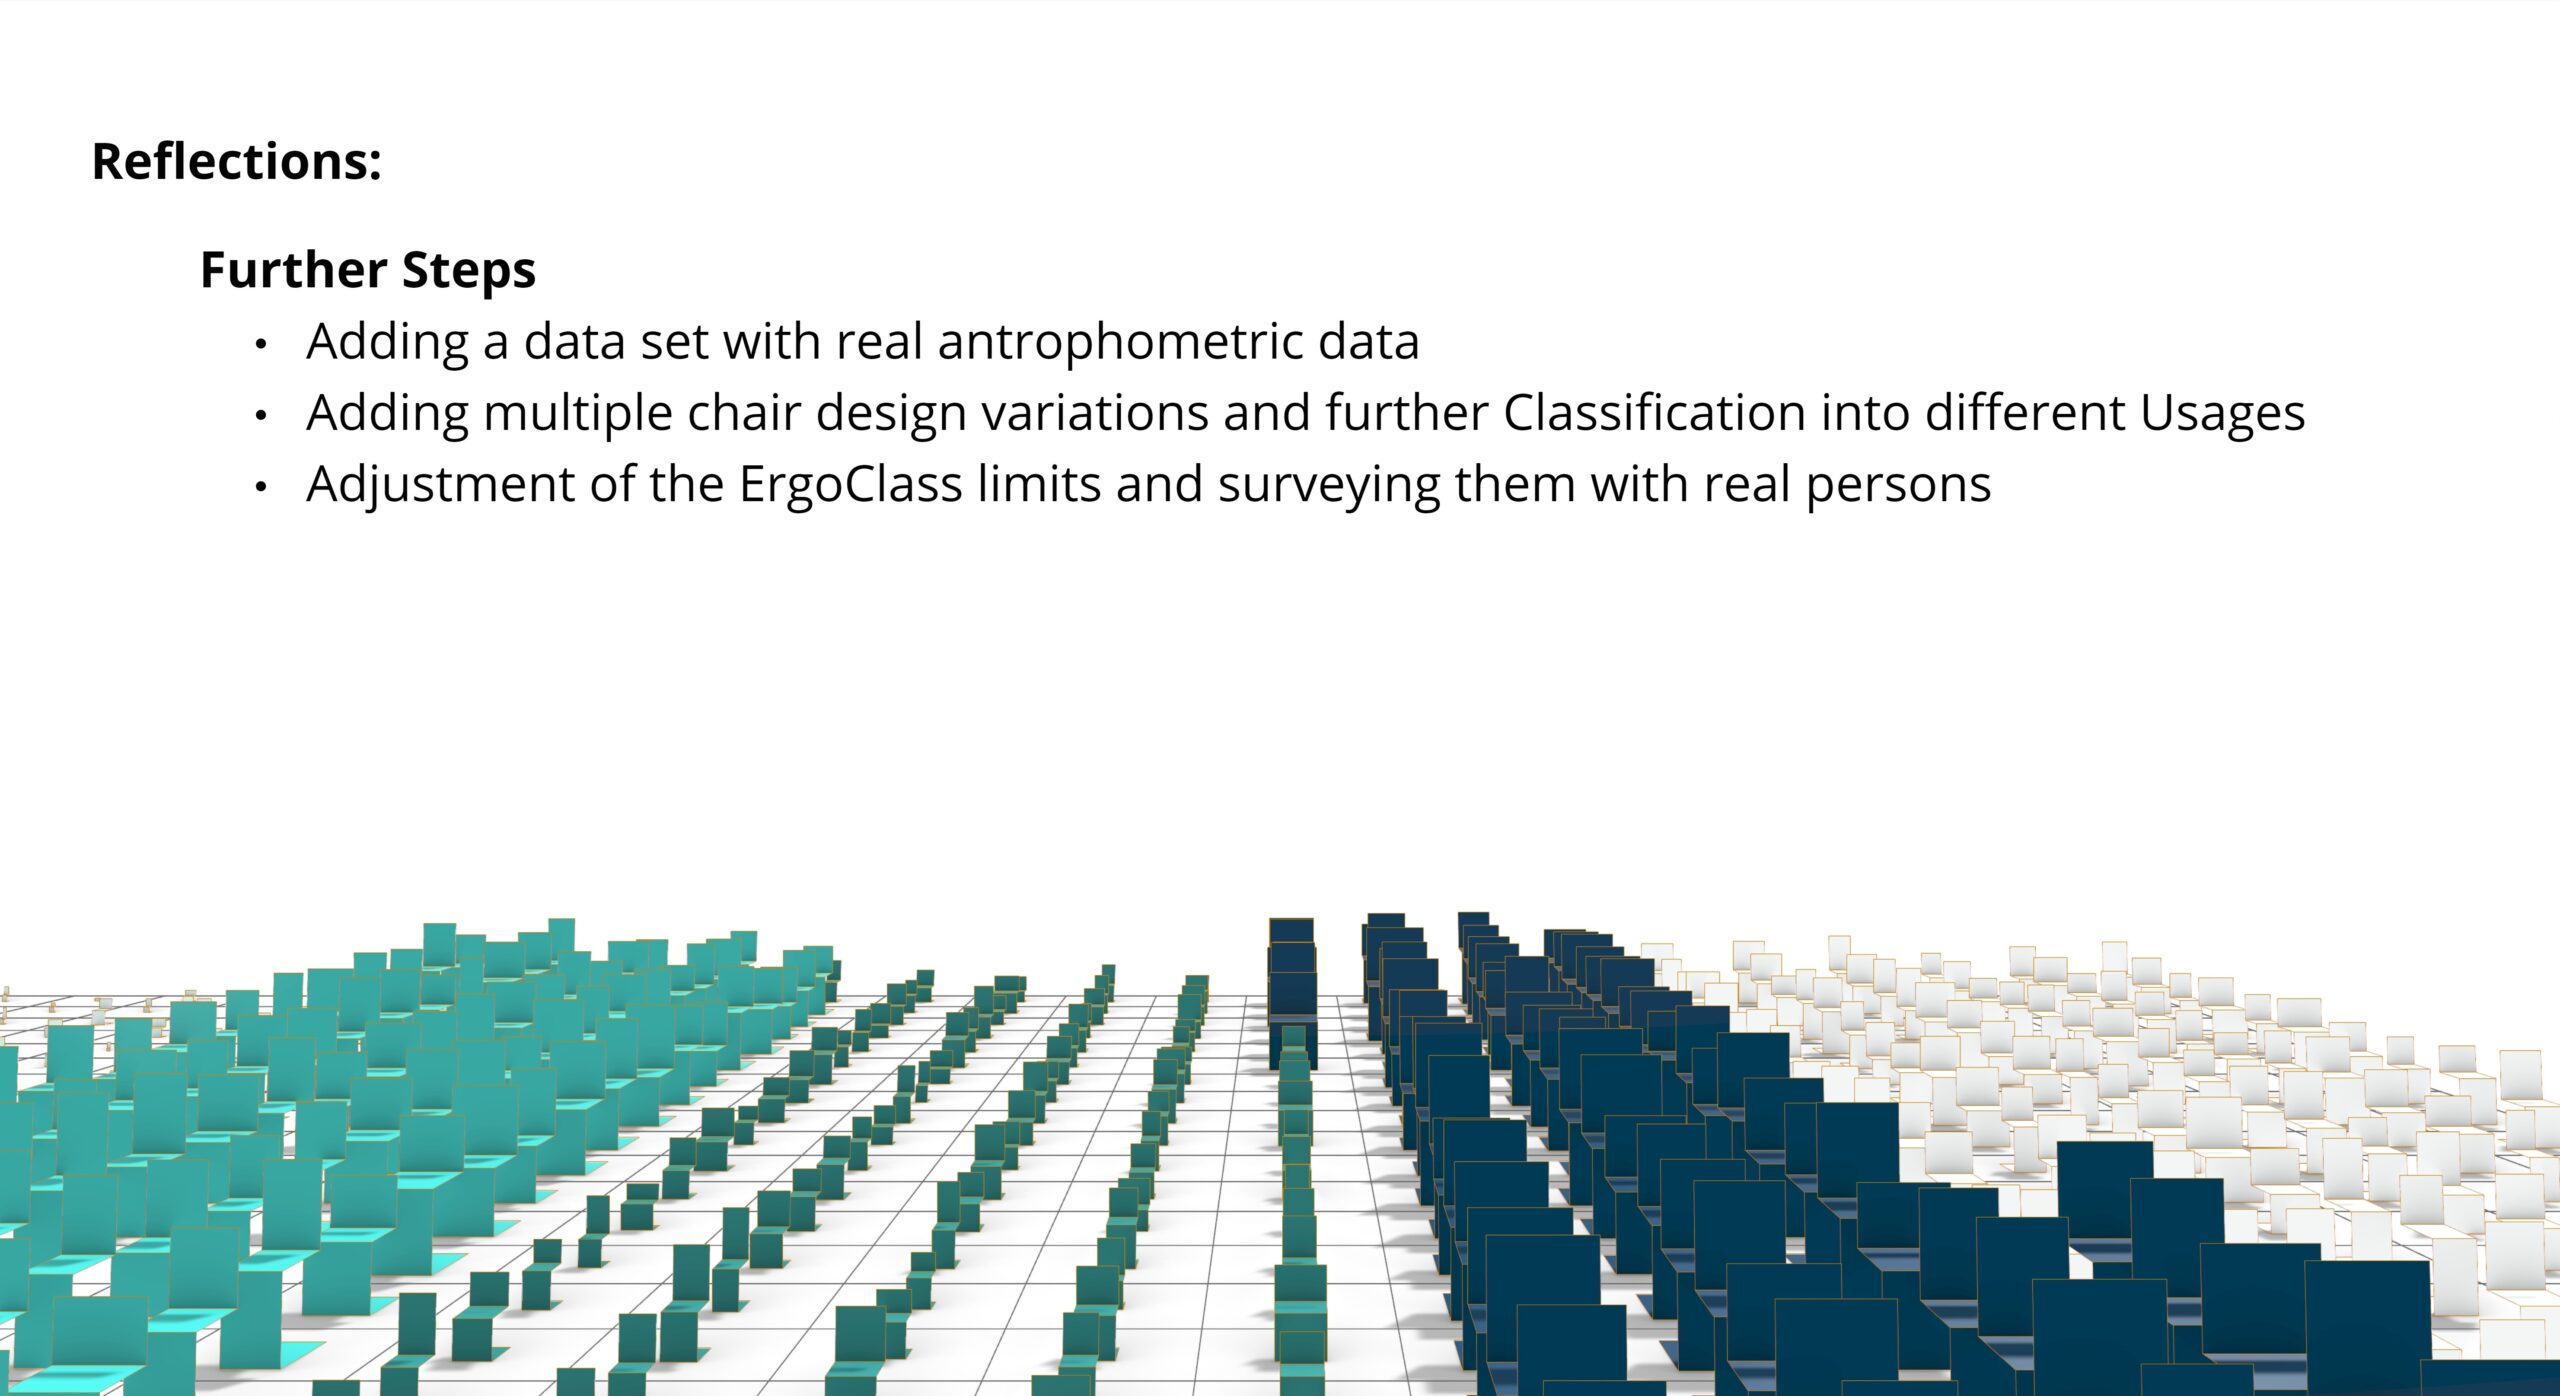
In conclusion, we aim to use a real data set in the future to enable more realistic evaluations. Including various chair geometries and categorizing chairs based on their intended use would also be an intriguing approach. Additionally, verifying our classification with real-world tests would further enhance the validity of our results.
