
In the age of digital urbanism, cities are no longer understood only through streets, buildings, or neighbourhoods—they are interpreted, navigated, and governed through layers of pixels, data points, and algorithmic models. Our visualization project, Cities in Pixels: Mapping, Moving and Meaning in the Digital Era, examines this transformation using Geographic Information Systems (GIS) as its central tool of study, tracing the evolution of mapping from ancient carvings to GeoAI, the project reflects on how maps produce power, memory, and meaning. Through this journey, we ask: How do digital maps shape our cities—and what futures do they enable or exclude
From Stone Walls to Screens: A Brief History of Mapping
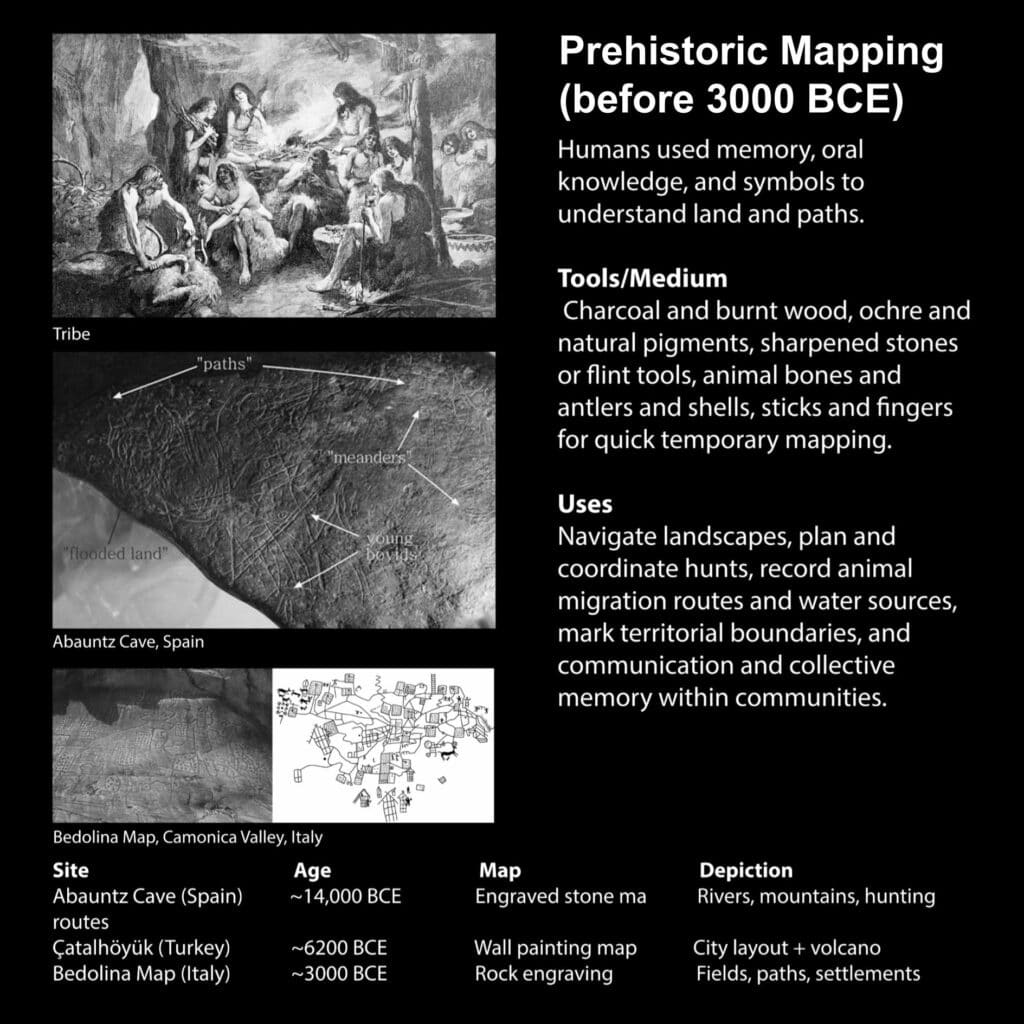
Our visualization begins with the earliest human attempts to represent space.
Cartography has always been a cultural act: maps carved into clay tablets, medieval mappae mundi blending myth with geography, imperial maps encoding power and conquest. These historical layers remind us that maps are never neutral—they are tools that reflect the values, intentions, and worldviews of those who produce them.
Technologies changed, but this fundamental truth did not.
From the compass to the printing press to aerial photography, each innovation reshaped how societies imagined space and controlled territory. As we move through the 20th century, satellites, photogrammetry, and digital scanning deepened our ability to “see” the Earth from above. These milestones prepared the ground for what would become one of the most transformative tools of the urban age: Geographic Information Systems (GIS).

GIS: The City Becomes Data
The core of the visualization maps the rise of GIS as the backbone of contemporary spatial analysis.
GIS does more than store data—it organizes, overlays, and visualizes complex urban dynamics:
- Land-use change
- Transportation patterns
- Environmental risks
- Demographic distributions
- Infrastructure networks
GIS transformed decision-making by turning cities into interoperable layers of pixels, enabling planners, governments, researchers, and corporations to quantify and predict urban behavior. With the arrival of remote sensing, these layers became increasingly granular: every streetlight, tree canopy, heat island, or encroachment could be digitized and categorized.
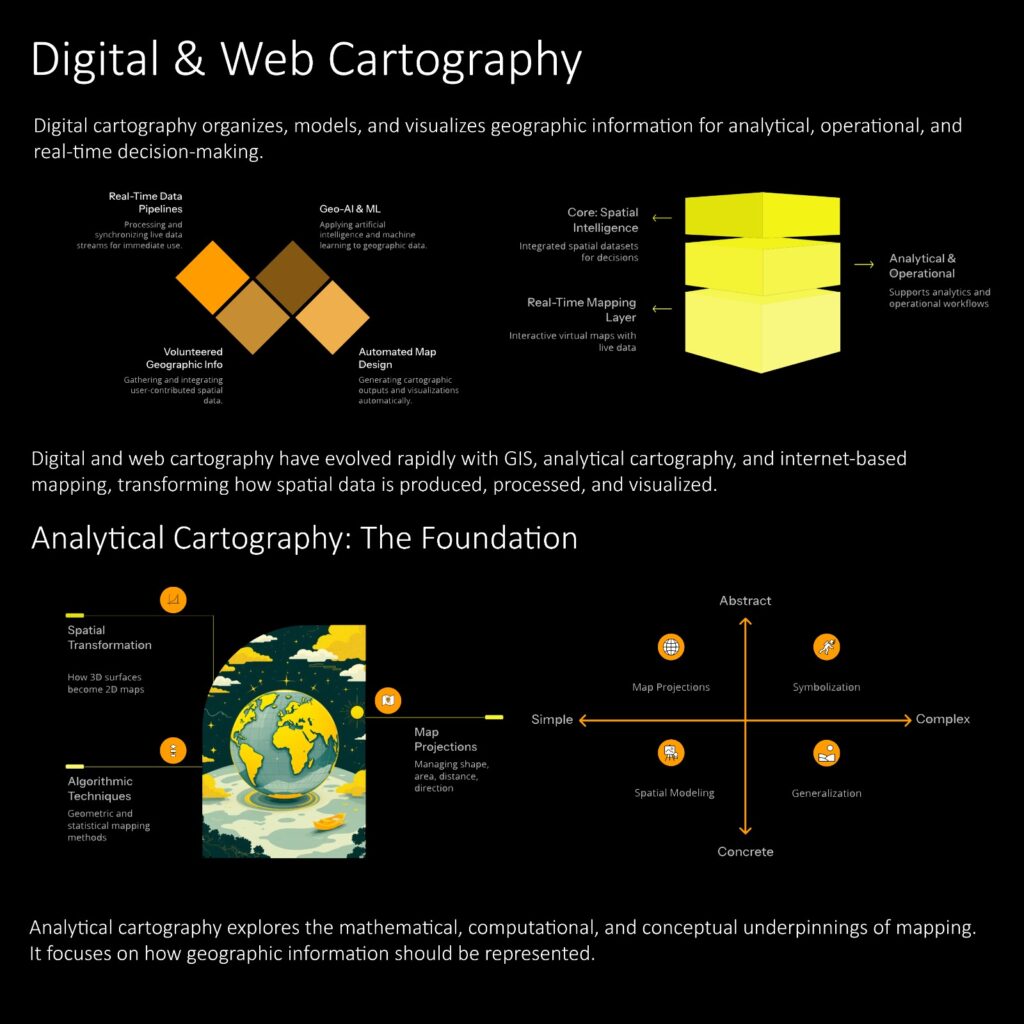
Digital and web cartography expanded this even further, shifting maps from static representations to interactive, dynamic, and real-time visualizations. Online platforms like OpenStreetMap, Google Maps, and Mapbox democratized map-making—yet they also concentrated immense power in the hands of a few data platforms.
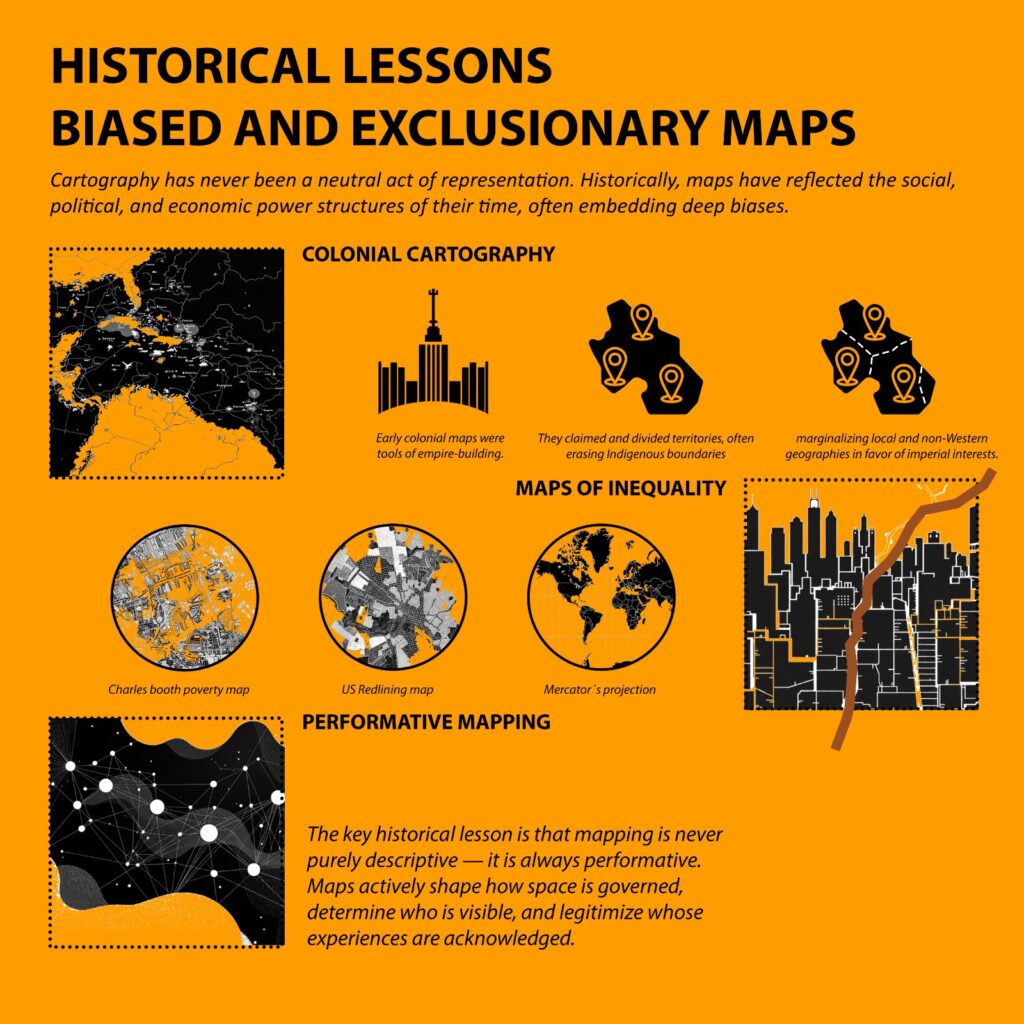
The Shadow of the Past: Historical Lessons from Biased Maps
In the visualization, we confront a critical truth: mapping has always encoded power.
Redlining maps in the United States, colonial administrative maps in India, imperial trade cartographies, and military reconnaissance maps remind us that spatial representation can also be a tool for exclusion. These historical examples echo in the digital era, where biases no longer appear as colored lines on paper but as algorithmic decisions within data pipelines.
Where early cartographers manipulated boundaries to shape political narratives, today’s platforms may:
- Prioritize commercial districts over informal settlements
- Omit marginalized communities from datasets
- Reinforce historical inequalities through predictive models
- Over-represent “profitable” geographies
The past is not gone; it persists as digital residues in contemporary systems.
Platform Cartography and Algorithmic Power
Our visualization then zooms into the contemporary phase—platform cartography.
Mapping in the digital economy is no longer performed by states or surveyors but by global corporations that control the pipelines through which spatial information flows.
This shift introduces new layers of influence:
- Proprietary basemaps shape what is visible and what is invisible.
- Navigation algorithms decide who gets the fastest routes or safest paths.
- Recommendation engines shape mobility patterns through “optimized” options.
- Geo-targeted advertising turns public space into monetized attention.
- Data extraction from everyday navigation feeds corporate predictive intelligence.
We start to see cities not as public environments but as commercial platforms, where movement is mediated by invisible code.
When AI Enters the Map: Risks and New Exclusions
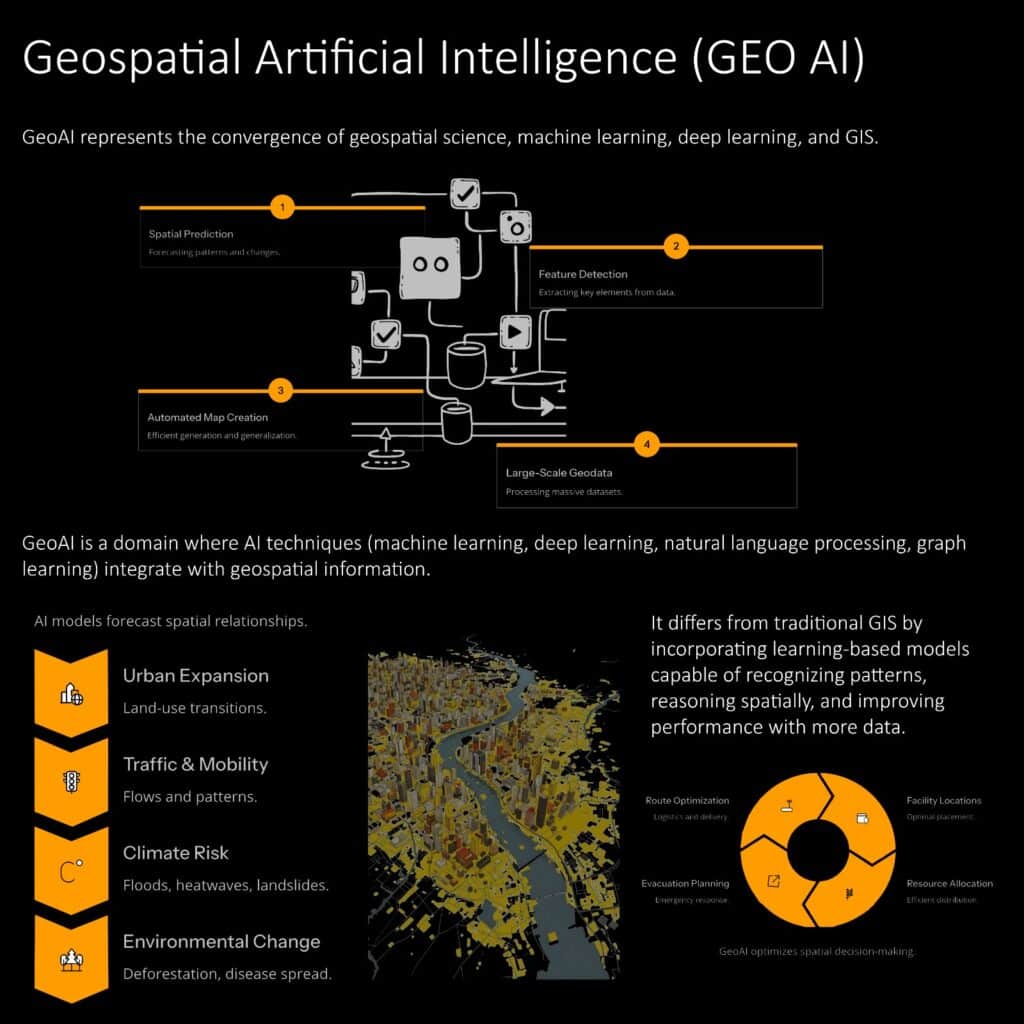
The next layer of our visualization maps the transition from traditional GIS to GeoAI—machine learning applied to geospatial data.
AI allows unprecedented analysis: automated land-use classification, mobility predictions, disaster modeling, crowd detection, and behavioral analytics.
Yet these advantages surface critical risks:
- Opacity of training data: What images were used? Whose geographies dominate?
- Algorithmic blind spots: Informal settlements, rural fringes, and low-income neighbourhoods often lack adequate representation.
- Surveillance potential: Satellite analytics and computer vision risk reinforcing policing and militarized cartography.
- Predictive harm: Crime prediction, risk scoring, and climate vulnerability models may disproportionately affect vulnerable communities.
- Platform dependency: AI tools centralize decision-making in private hands.
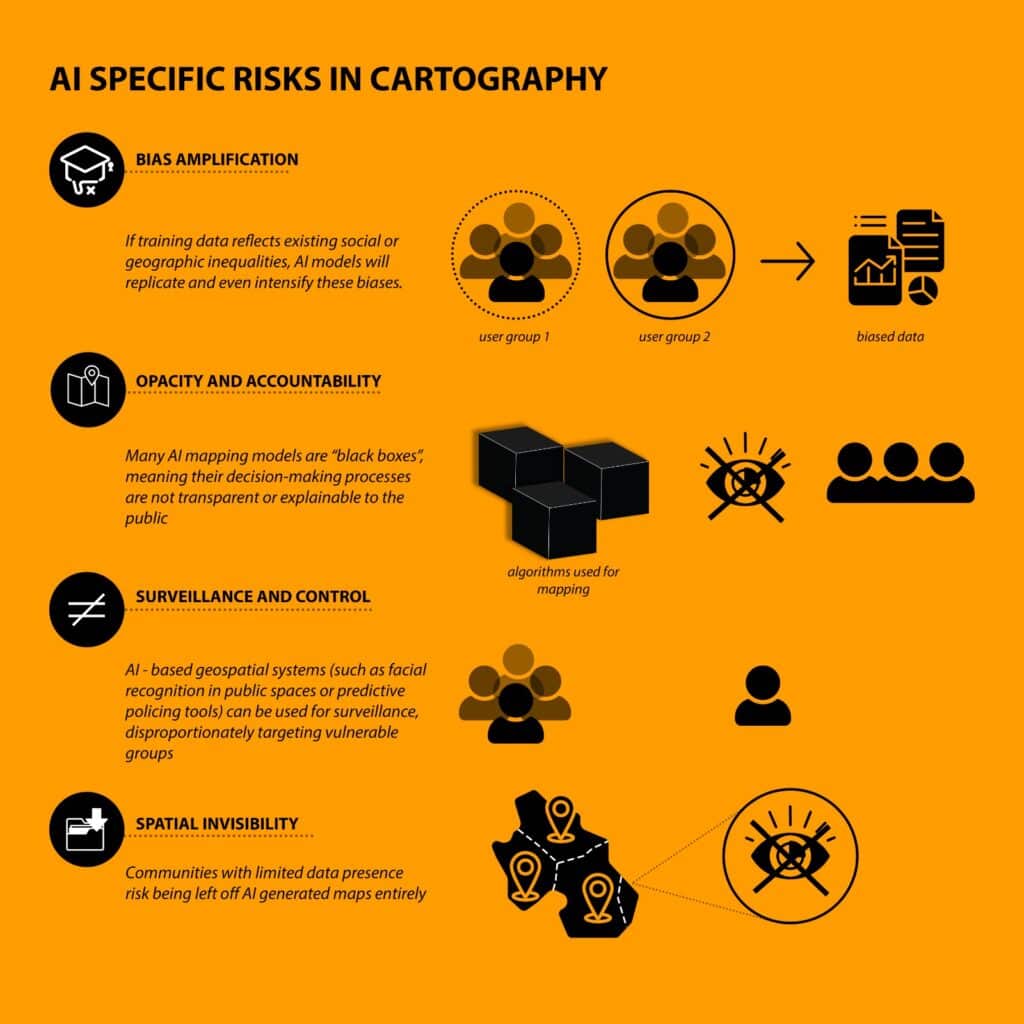
If traditional cartography encoded imperial power, AI cartography risks encoding computational power, where spatial meaning is determined by training datasets and opaque models rather than collective knowledge.
Towards Critical GeoAI Ethics
The final segment of our visualization argues for a shift from mere technological adoption to critical, ethical geospatial practice.
We outline principles essential for the future of digital urbanism:
1. Transparency
Disclosing data sources, training processes, and algorithmic assumptions.
2. Inclusivity
Actively representing marginalized spaces, informal geographies, and non-digitized communities.
3. Participatory Mapping
Engaging local knowledge systems, citizen scientists, and community observatories.
4. Accountability
Developing governance frameworks for AI-driven spatial decisions.
5. Reflexive Design
Seeing maps not as mirrors of reality, but as constructive, political, and ethical artifacts.
Through these principles, we imagine a future where cities in pixels do not simply extract data or optimize for efficiency, but instead nurture equitable, diverse, and contextually informed spatial futures.
Conclusion: Rethinking the Pixel as a Site of Power
Cities in Pixels offers more than a historical timeline or a technical diagram—it is an invitation to rethink how we map, move, and make meaning in an increasingly digitized world. As cities become data-saturated environments, the responsibility of cartography grows. The maps we build today shape not only our understanding of urban space but the lived realities of those who inhabit it.
In the digital era, every pixel is political. And every act of mapping is an act of shaping the future.
PulseMap: A Tool for Smart Stress Detection and Safe-Route Navigation
In the contemporary urban landscape, personal safety and mental well-being are increasingly intertwined. Cities, while hubs of opportunity, can also amplify stress and anxiety due to crowded spaces, unpredictable environments, and heightened exposure to hazards. PulseMap, a wearable smart ring, is as an interface between human physiology and urban navigation, translating biometric signals into actionable insights for safer and more serene urban mobility.
Tool Overview
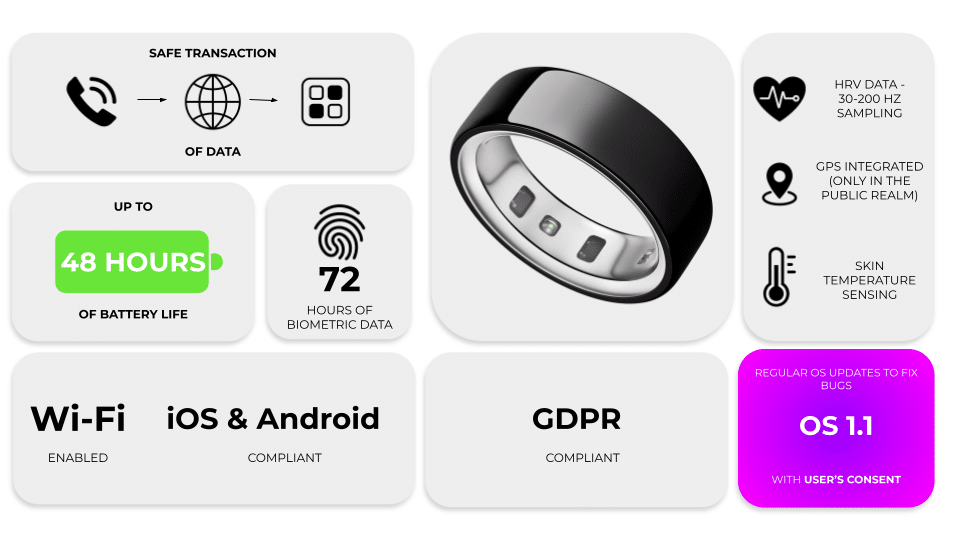
PulseMap leverages Heart Rate Variability (HRV) — the variation in time intervals between consecutive heartbeats — as its core stress-detection metric. By integrating biometric sensors directly into a discreet ring, and pairing this with Global Positioning System (GPS)-enabled route guidance via a companion smartphone application, the device delivers real-time insights into the wearer’s emotional and physiological state. Unlike conventional fitness trackers or urban navigation apps, PulseMap prioritizes privacy-first design, ensuring personal data remains locally processed and anonymized.
PulseMap transforms GIS (Geographic Information System) and GPS from mere mapping tools into instruments of personal safety and urban awareness, turning the city itself into a responsive, human-centered network. By integrating GPS-based location tracking with real-time biometric sensing, PulseMap detects stress levels through HRV and suggests alternate, safer routes across the city. Unlike conventional navigation apps, it prioritizes privacy-first design: all physiological computations occur on the device, no personal identifiers are stored, and location data is anonymized before being shared for collective analysis. This creates a dynamic, human-centered layer of urban data, where the city can be mapped not only by streets and infrastructure but also by the emotional and physiological responses of its inhabitants. PulseMap thus demonstrates how GIS and GPS can be leveraged to merge personal safety, urban mobility, and ethical data practices, transforming individual experiences into actionable insights for both users and urban planners.
Hardware Analysis
The ring’s hardware architecture reflects a balance of precision, durability, and wearability:
- Photoplethysmography (PPG) Optical Sensors: Monitor Heart Rate (HR) and HRV. Optional Electrodermal Activity (EDA) / Galvanic Skin Response (GSR) sensors enhance emotional stress detection by measuring skin conductance.
- 3-Axis Accelerometer (IMU – Inertial Measurement Unit): Detects movement and orientation, minimizing false readings.
- Processor & Memory: A low-power ARM Cortex-M Microcontroller Unit (MCU) with a secure enclave enables on-device HRV computation, storing up to 72 hours of data locally. HRV metrics computed include RMSSD (Root Mean Square of Successive Differences), SDNN (Standard Deviation of NN intervals), pNN50 (percentage of successive NN intervals differing by more than 50 ms), and frequency-domain HF/LF (High-Frequency / Low-Frequency) components reflecting autonomic nervous system activity.
- Materials & Durability: Titanium, ceramic, or stainless steel options provide hypoallergenic, lightweight, and water-resistant builds suitable for continuous urban wear, with an IP68 rating (dust-tight and protected against prolonged water immersion).
Critically, the combination of compact hardware and local processing allows the ring to maintain accuracy while preserving user autonomy and data security, differentiating it from cloud-dependent wearables.
Software and Intelligence
PulseMap is powered by sophisticated algorithms both on-ring and in the companion app:
- On-Ring Algorithms: Compute HRV indices and generate a real-time stress score (0–10) while filtering motion artifacts.
- App Algorithms: Leverage GPS data to suggest alternate, safer routes in real-time and aggregate anonymized urban heatmaps. Machine learning models refine stress classification over time, providing users with predictive insights and personalized recommendations.
This dual-layered intelligence allows the ring to operate autonomously and responsively, translating subtle physiological signals into meaningful urban guidance.
Connectivity and Power
- Bluetooth Low Energy (BLE) 5.3: Ensures encrypted, low-latency communication with the app.
- GPS integration relies on the smartphone for location processing to preserve battery life and privacy.
- Battery: 20–30 mAh Lithium Polymer (Li-Po) battery, Qi-compatible wireless charging, 48–72 hours of continuous operation (optimized via adaptive sensor sampling).
Privacy and Ethical Considerations
PulseMap distinguishes itself through a rigorous privacy-first framework:
- Local Biometric Processing: Stress and HRV computations occur on-device, ensuring no raw biometric data is uploaded to the cloud.
- Indoor Privacy Mode: Automatically suspends location tracking indoors or in user-selected zones.
- Anonymized Data Sharing: Only aggregated stress hotspots (0–5 scale) are optionally shared, fully compliant with GDPR and employing Advanced Encryption Standard (AES) for end-to-end data protection.
By foregrounding privacy, PulseMap addresses the ethical implications of pervasive biometric tracking, building trust in a context where surveillance concerns are paramount.
Design and User Experience
PulseMap is intentionally subtle, prioritizing minimal disruption to daily life. Its haptic alerts provide discreet stress notifications and route suggestions without requiring visual attention, fostering safety in environments where focus must remain on the surroundings. The companion app complements this experience, offering trend analytics, community heatmaps, and opt-in privacy controls, creating a holistic interface between physiological awareness and urban interaction.
Critical Reflection
While PulseMap excels in merging biometric sensing with urban navigation, its effectiveness depends on context-sensitive urban datasets and user engagement. Cities with irregular mapping or poor GPS coverage may limit real-time guidance, highlighting a need for adaptive algorithmic models. Additionally, stress is multi-faceted and culturally variable; PulseMap represents one layer of understanding, and should ideally integrate with broader urban safety and mental well-being strategies.
Conclusion
PulseMap exemplifies a next-generation urban wellness tool, where technology mediates between human physiology and city infrastructure. It demonstrates how wearable devices can transcend fitness tracking, becoming instruments of real-time personal safety, stress awareness, and privacy-conscious urban navigation. By critically exploring both hardware and software, PulseMap highlights the potential for smart wearables to support confident, informed, and autonomous urban mobility—without compromising personal data or agency.
