Problem statement and project objectives

How can we create a routing system that orients onto its users environment, utilizing open source data?
How do we collect and process data?
Our objective is to utilize the existing data and generate any missing data required for each aspect of our analysis.
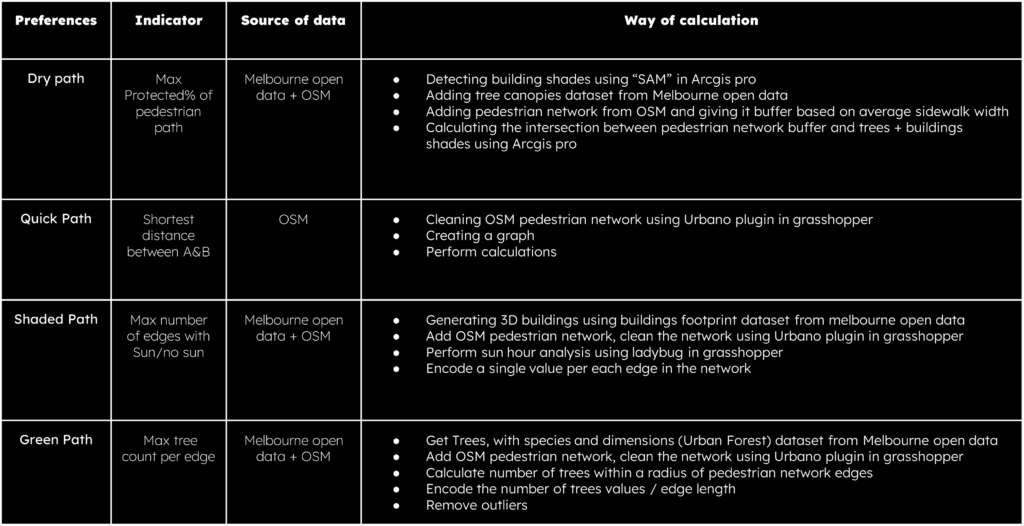
We combine data from different sources and conduct various analyses to represent each preference as a single score per edge.
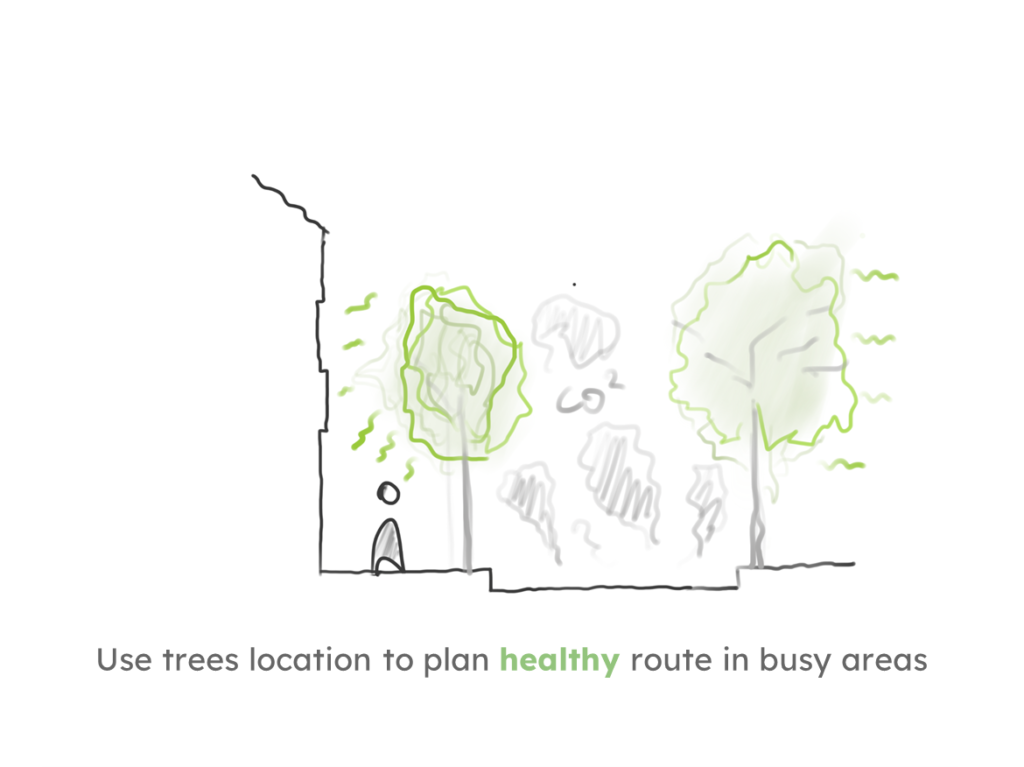
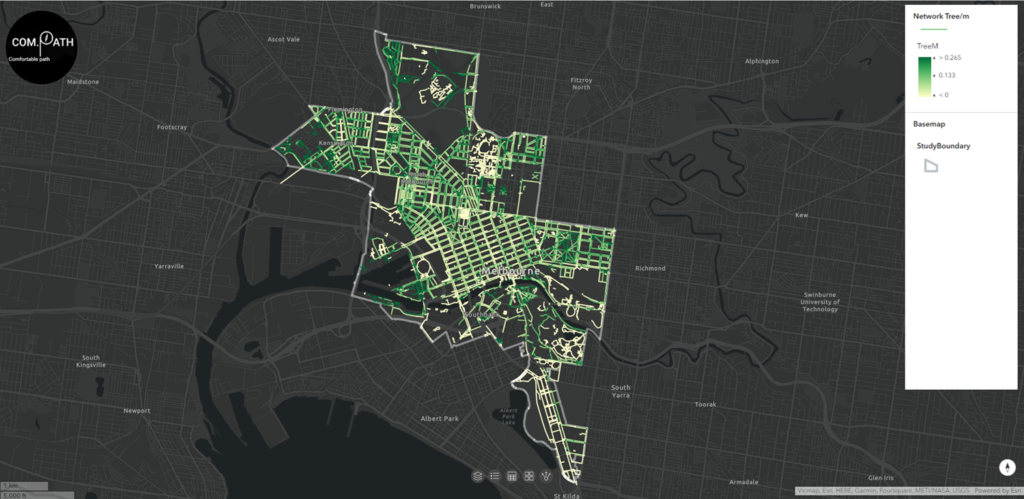
For example, to encode the “green path” preference, we incorporate the trees dataset from Melbourne open data along with the open street maps pedestrian network. We analyze the data to determine the number of trees within each edge range of the network, allowing us to calculate a tree/meter score for each edge.
Project Methodology
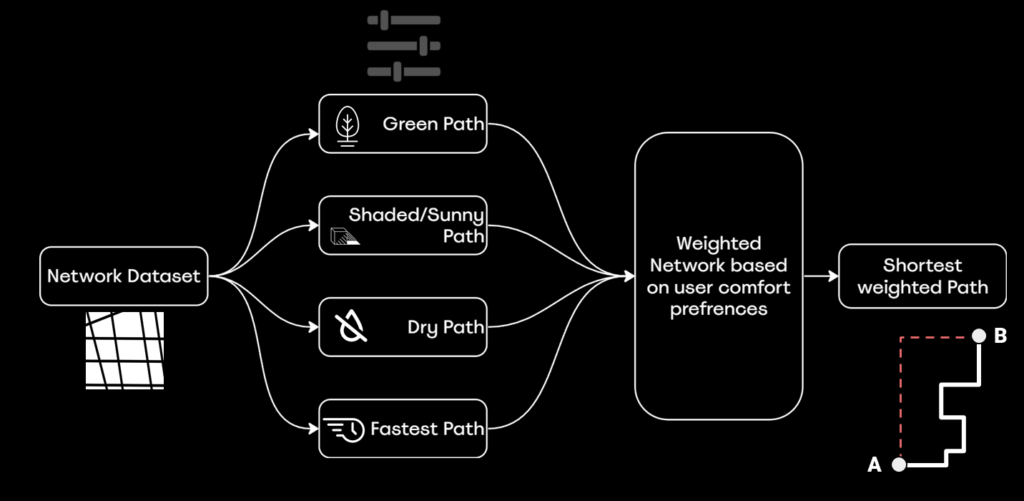
Ultimately, our goal is to obtain a comprehensive score, known as the “Cost,” for each edge. This score reflects the desirability of the edge, with higher costs indicating poorer quality. By considering user preferences and employing mathematical equations, we can combine the individual scores into a single Cost value for each edge.
Data Processing
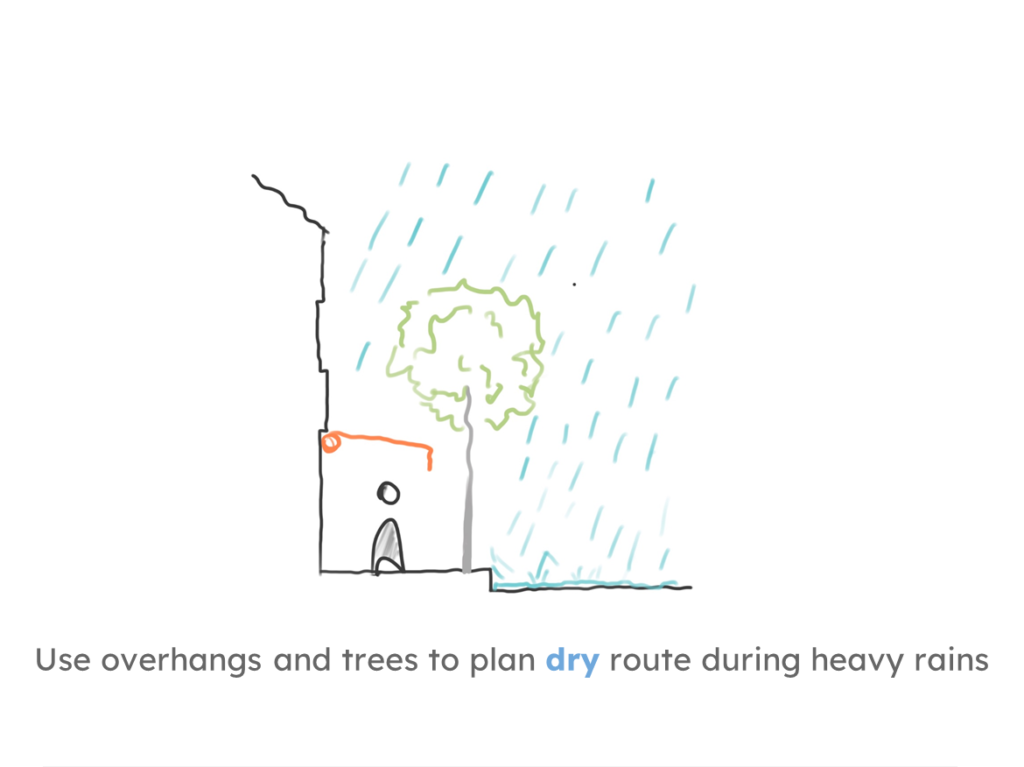
Dry path
we used true ortho satellite images from Melbourne open data, and adding to it buildings footprint as a mask we manage to detect buildings shades using segment anything model inside arcgis pro, then we add the tree canopies data from Melbourne dataset, next we imported the ped network from OSM adding a buffer to it using average sidewalk width then finally calculating the covered percentage per each edge using trees + shades.
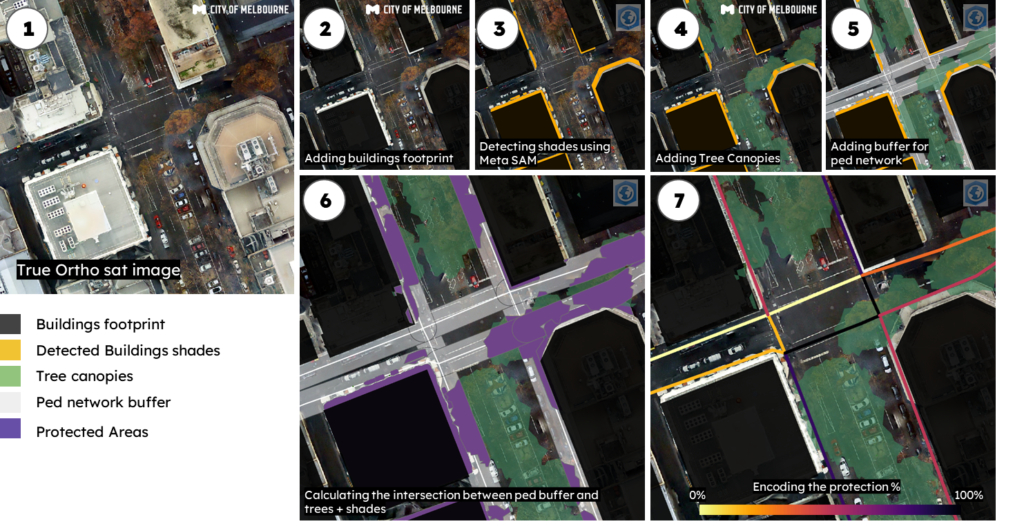
As you can see the protected segments are more concentrated in CBD and in parks.
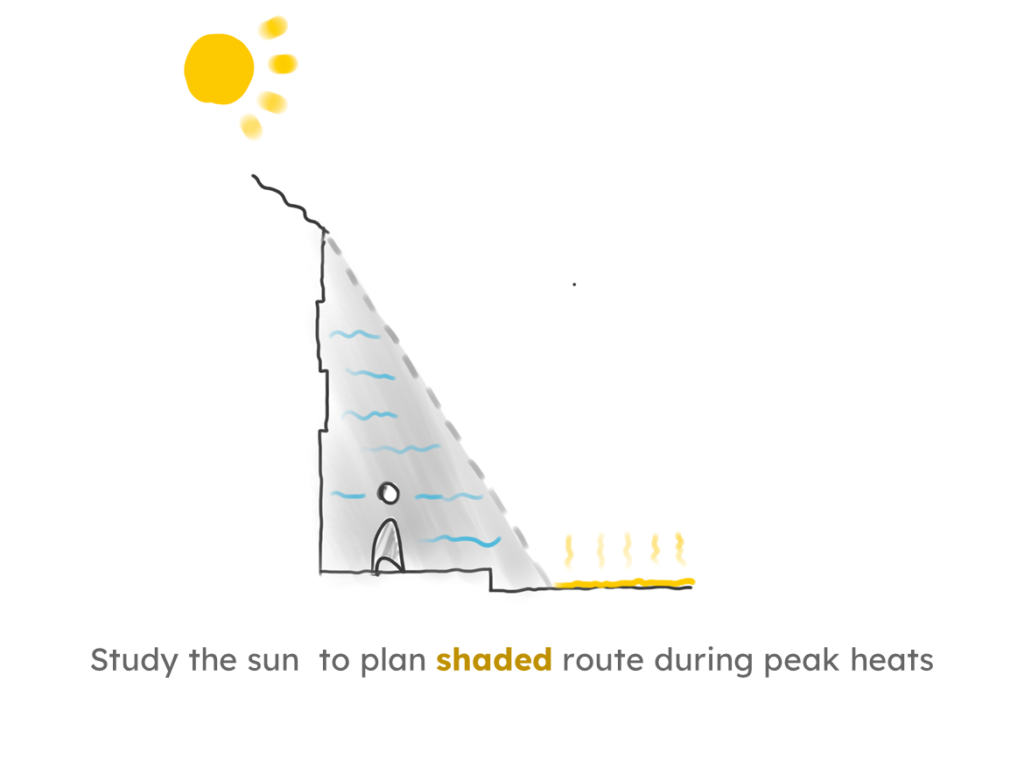
Shaded path
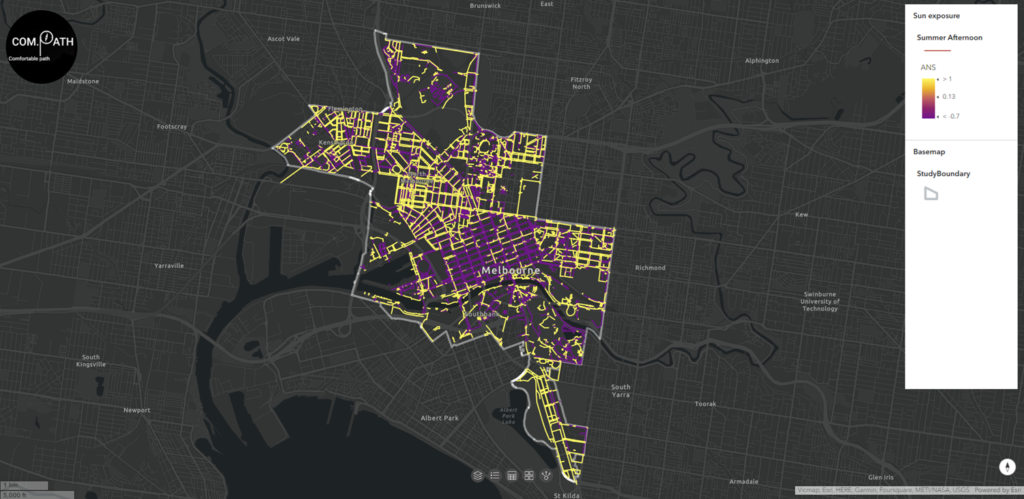
We performed sun hour analysis using lady bug in grasshopper, with the cities 3D buildings as context + trees and shades then we encoded a single value per each edge in different times, based on the season and daytime.
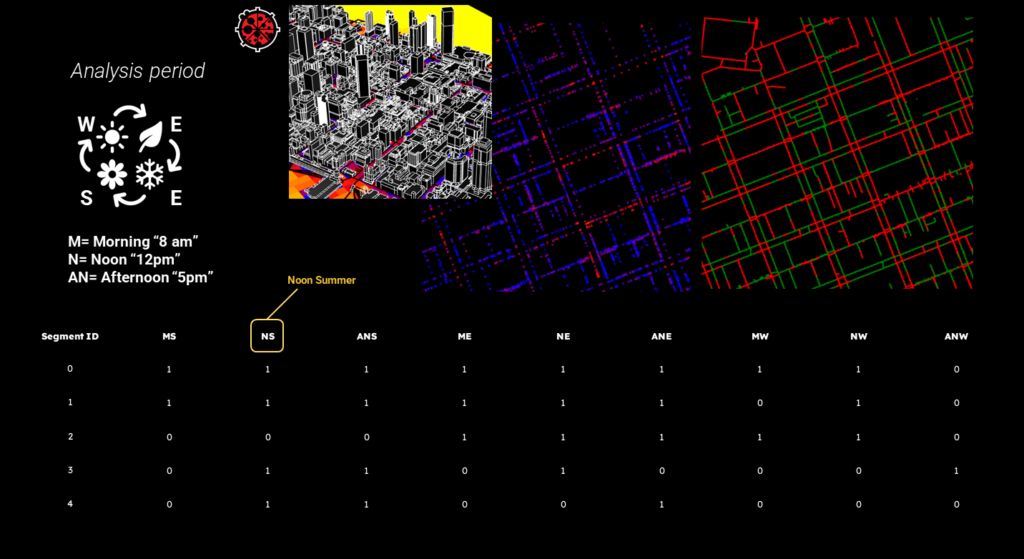
Due to high rise buildings in CBD you can see more shadow there.
Green path
more trees/meter the better the edge.
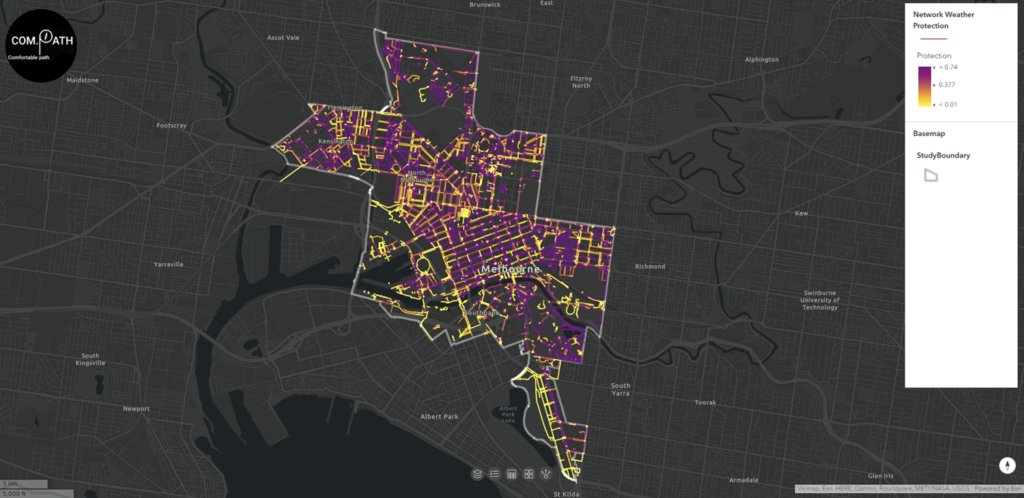
Interactive app showing edge score visualization within the network
This app was build using ArcGIS experience builder and it can be used to get some insights about streets quality for the previously mentioned mesures.
Project Demo
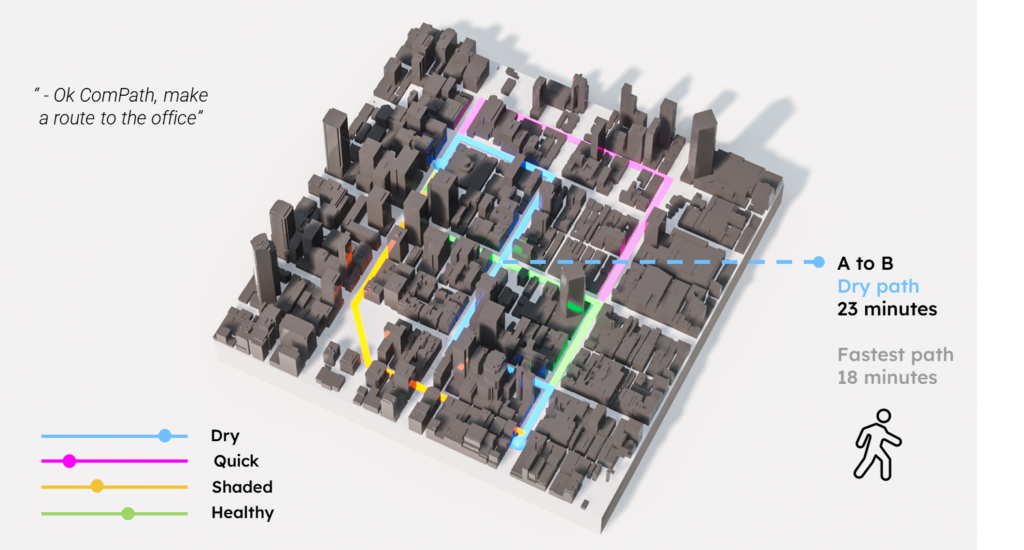
The workflow allows users to set their preferences for season, time of day, start and ending locations, and preferences for shade, green, protection, and length. Based on these preferences, a map is generated, and images along the weighted path are obtained using the Google Street View API.
Each image is analyzed to determine the dominant color in a grid, and these colors are mapped to a custom palette, determined by the categories. Overall percentages of color categories are calculated, providing insights into the distribution of colors along the path.
In these examples we can see the inputs of different seasons, times of the day and the weights for the categories. The selected path and the overall percentages obtained after image segmentation are not accurate because of the difference in angles, orientation, position of the street view images. Moreover, in some iterations we can see how the street view giffs clearly show protected paths.
Isochrones are valuable tools for urban planners and analysts seeking insights into street quality and accessibility based on specific preferences. By using cost isochrones, planners can determine the areas that can be reached within a designated time or distance from a central point. These isochrones are represented by contour lines on a map, connecting locations that can be accessed within the defined parameters. By visualizing these isochrones, planners can gain a better understanding of travel times or distances between different areas and identify potential barriers or areas of improvement in terms of streets quality. Such information can be crucial for making informed decisions about transportation infrastructure, optimizing urban design, and enhancing accessibility for residents and commuters. Whether it’s evaluating the impact of new developments, assessing transportation options, or identifying areas for improvement, isochrones offer valuable insights into the spatial distribution of accessibility and help planners shape more efficient and inclusive urban environments.
Conclusions