
By Jose, Giorgia, Paul, Francesco, and Mohammed
Rethinking Urban Design Through Acoustic Intelligence
Cities today must manage noise for public health, productivity, and urban well-being. Streets, parks, towers, and public spaces all face constant noise challenges. Yet, traditional urban design often treats acoustics as an afterthought. Most teams evaluate sound issues only after making key planning decisions. As a result, projects often struggle to achieve true acoustic comfort.
Ecoform changes this approach. It brings advanced acoustic analysis to the very start of urban design. With Ecoform, professionals can spot and solve noise problems before they build. Planners and designers can address these issues at the level of districts, blocks, or entire developments.
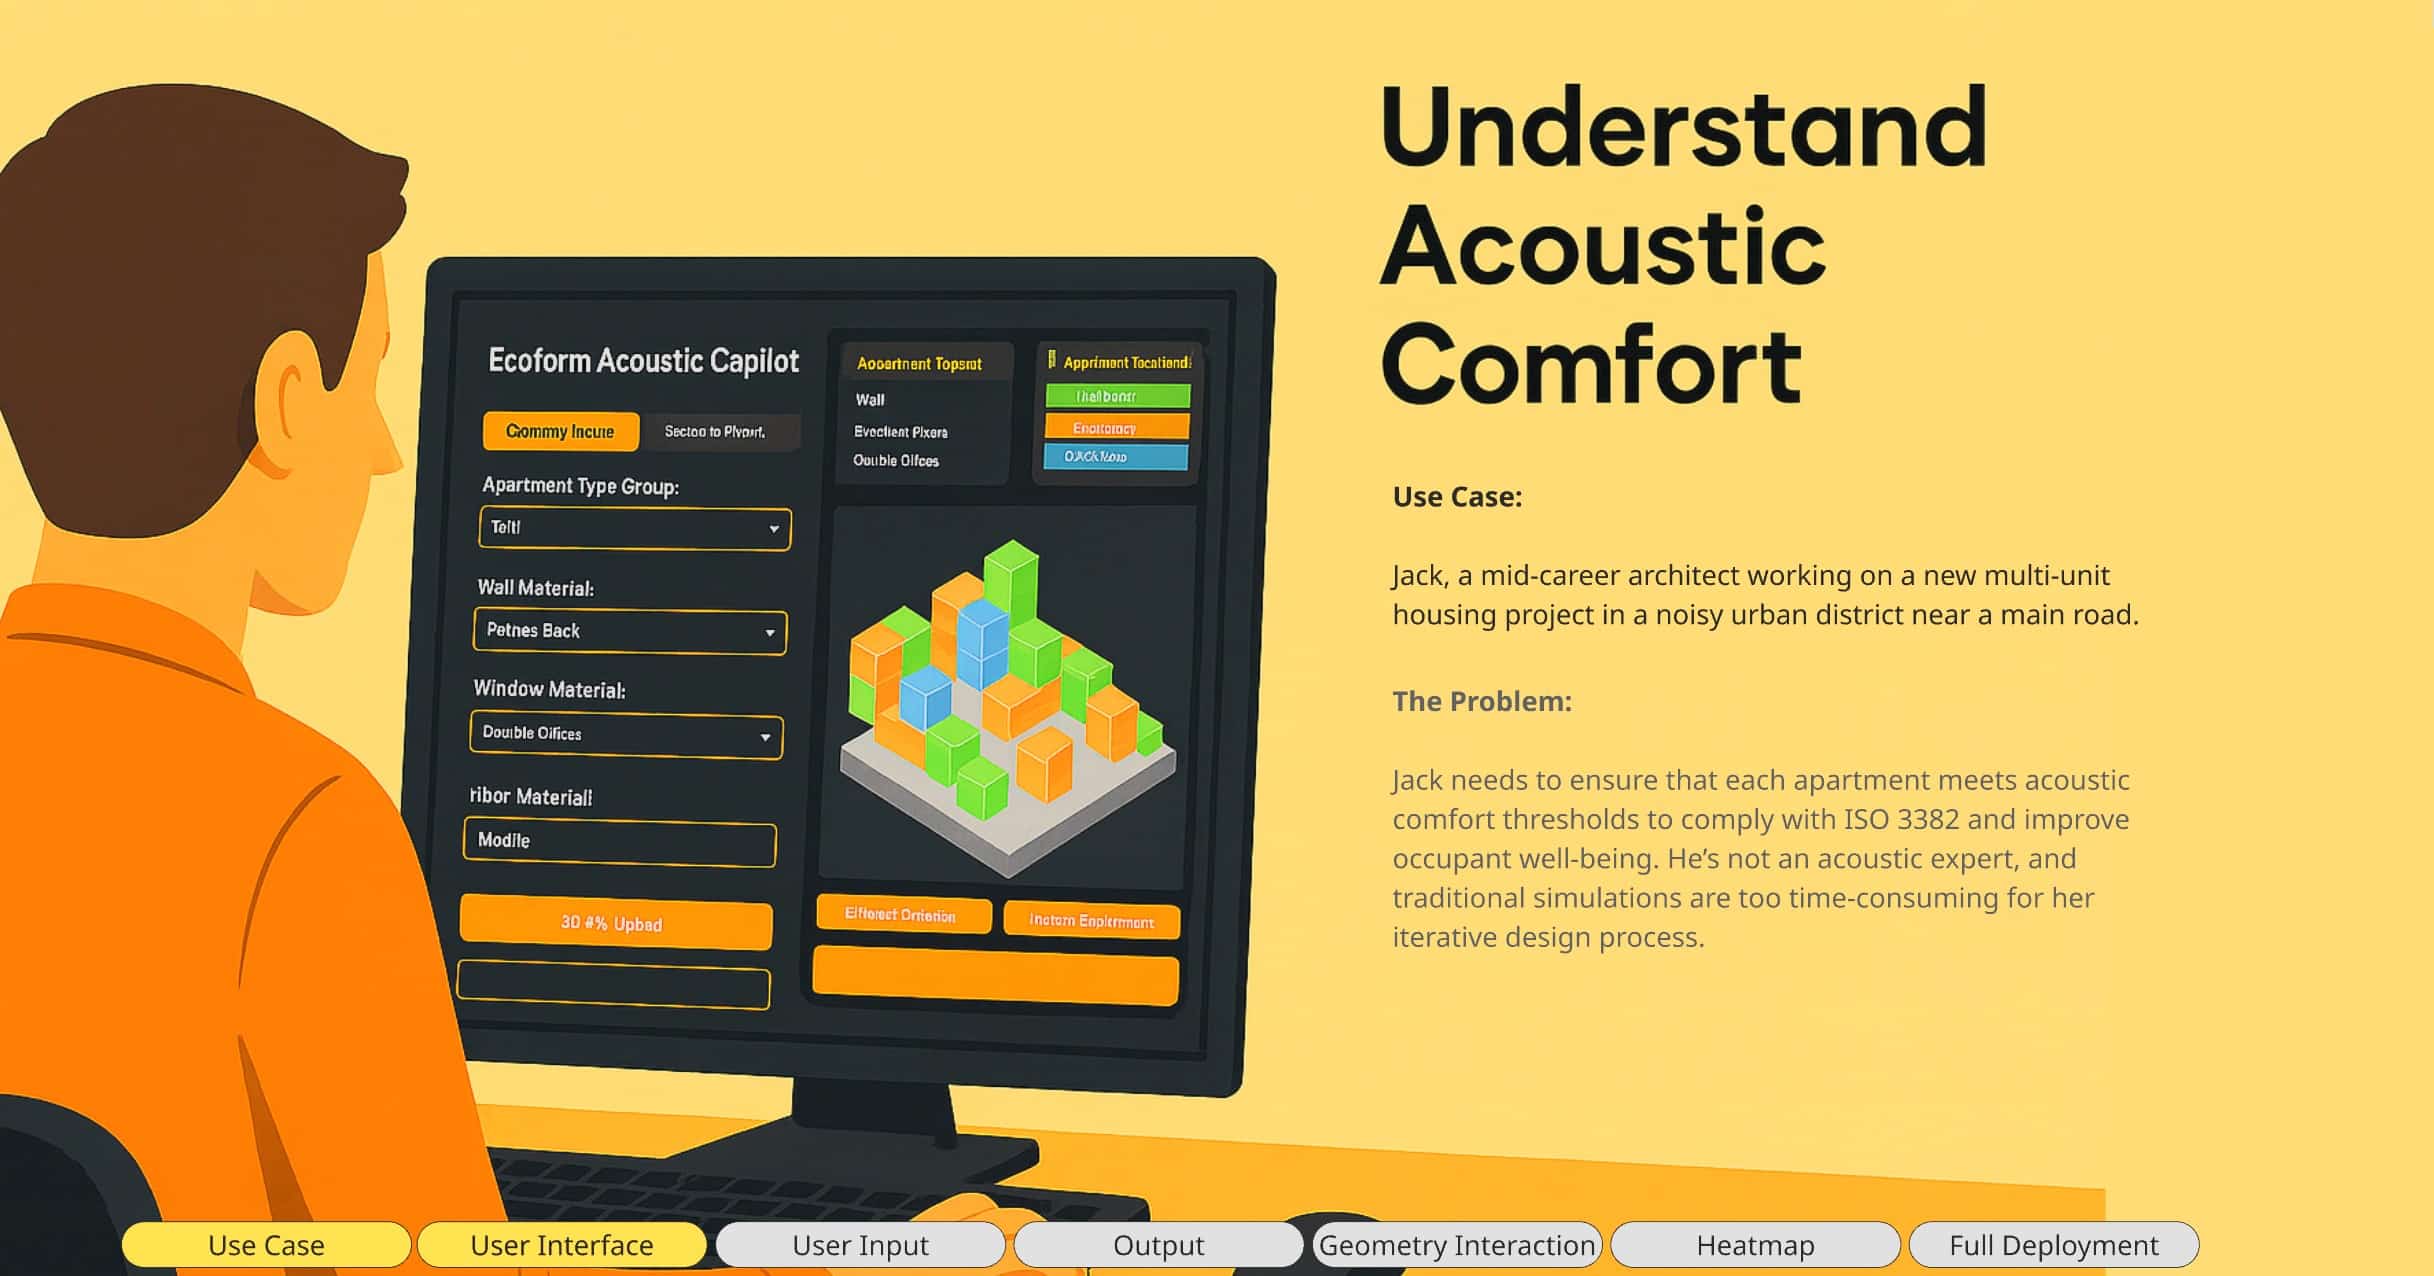
Ecoform acts as an AI-powered copilot for urban designers, landscape architects, and planners. Users start by uploading or selecting an IFC model. They can then quickly see and evaluate acoustic performance for every unit and zone. This includes all types of spaces, whether residential, commercial, or public. The system lets users select scenario inputs, like material choices or street orientation. With each change, Ecoform delivers instant feedback on acoustic outcomes. This process supports smarter, healthier urban design from the very beginning.
The Problem: Why Urban Acoustic Comfort Matters
Urban environments must deal with many sources of noise. Traffic, construction, public events, transit, and crowds all add to the problem. Excessive noise and long reverberation times can harm well-being. These issues lower productivity and reduce the quality of urban life.
However, many urban spaces still struggle with poor acoustics. High noise, long reverberation, and unclear speech remain common. These conditions hurt well-being and make communication difficult. Over time, they lower quality of life for city residents.
Noise from traffic and construction brings special challenges. Nearby activities also disrupt privacy and sleep. This can increase stress and lower productivity. Good acoustic design, in contrast, helps cities become more peaceful, healthy, and livable for everyone.
Ecoform tackles these issues by following ISO and WHO standards for acoustic comfort and environmental health. The tool visually highlights areas of acoustic weakness directly on the project map or model. This makes it easy for designers to spot and address problem zones early. By using Ecoform, every analysis and design decision aligns with global standards. As a result, urban comfort means more than just lowering decibel levels—it also ensures clear speech, privacy, and stress reduction in every space

At Urban Scale
In urban areas, external noise from traffic, construction, and nightlife significantly reduces residential quality of life.
A major European study found that high road traffic noise (> 55 dB Lden)
correlates with:
- 22–40% higher risk of sleep disturbances
- Increased annoyance and stress levels
- Reduced self-reported well-being among residents

Sound behavior depends on:
- Envelope features (walls, windows, façade openings)
- Room layouts (shapes, furniture placement)
- Material properties (absorption, reflection, diffusion)
- Occupancy patterns (talking, movement, activities)
Simulation challenges:
- Accurate modeling requires complex, time-intensive calculations (e.g., ray tracing, wave modeling)
- Traditionally relies on specialized consultants and technical software


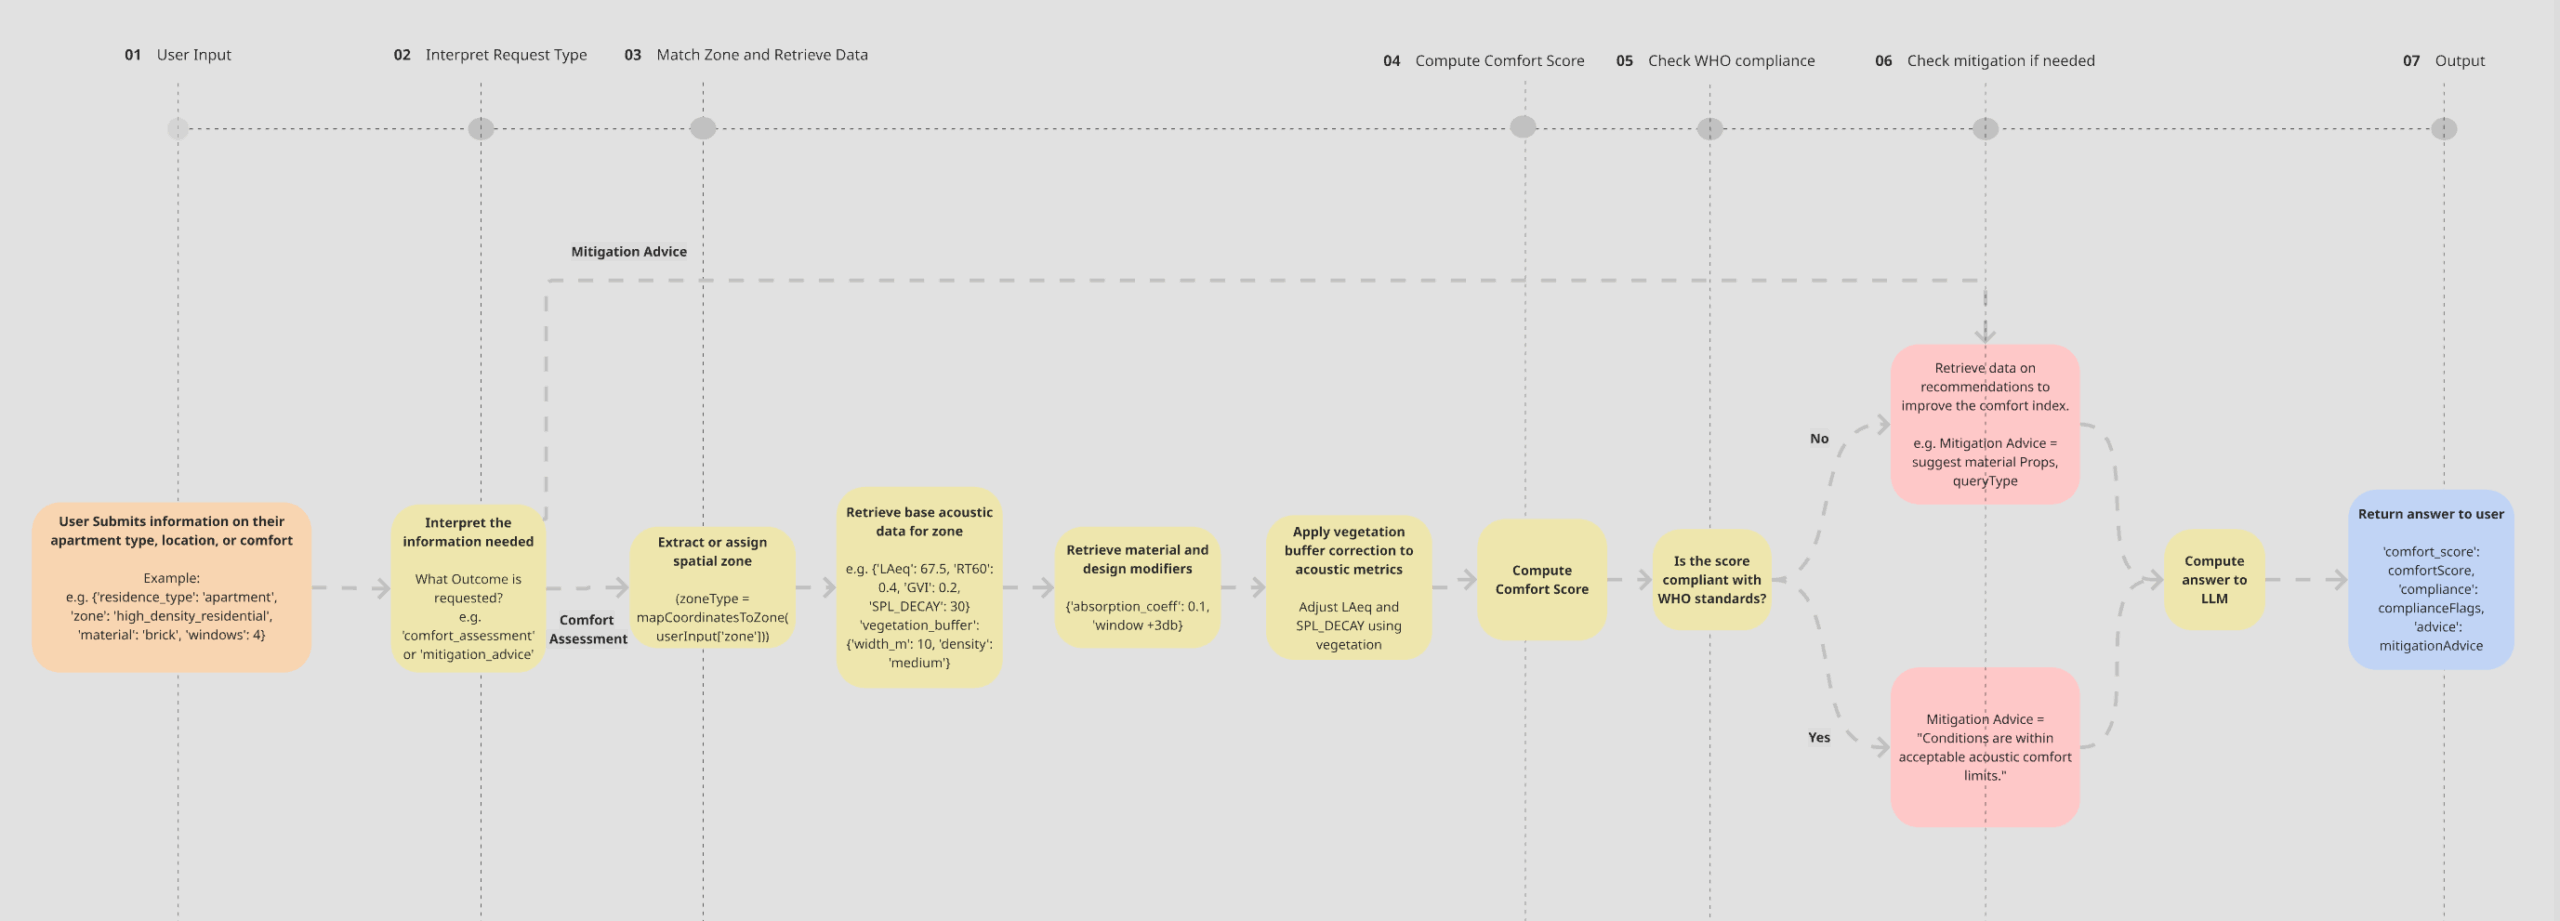
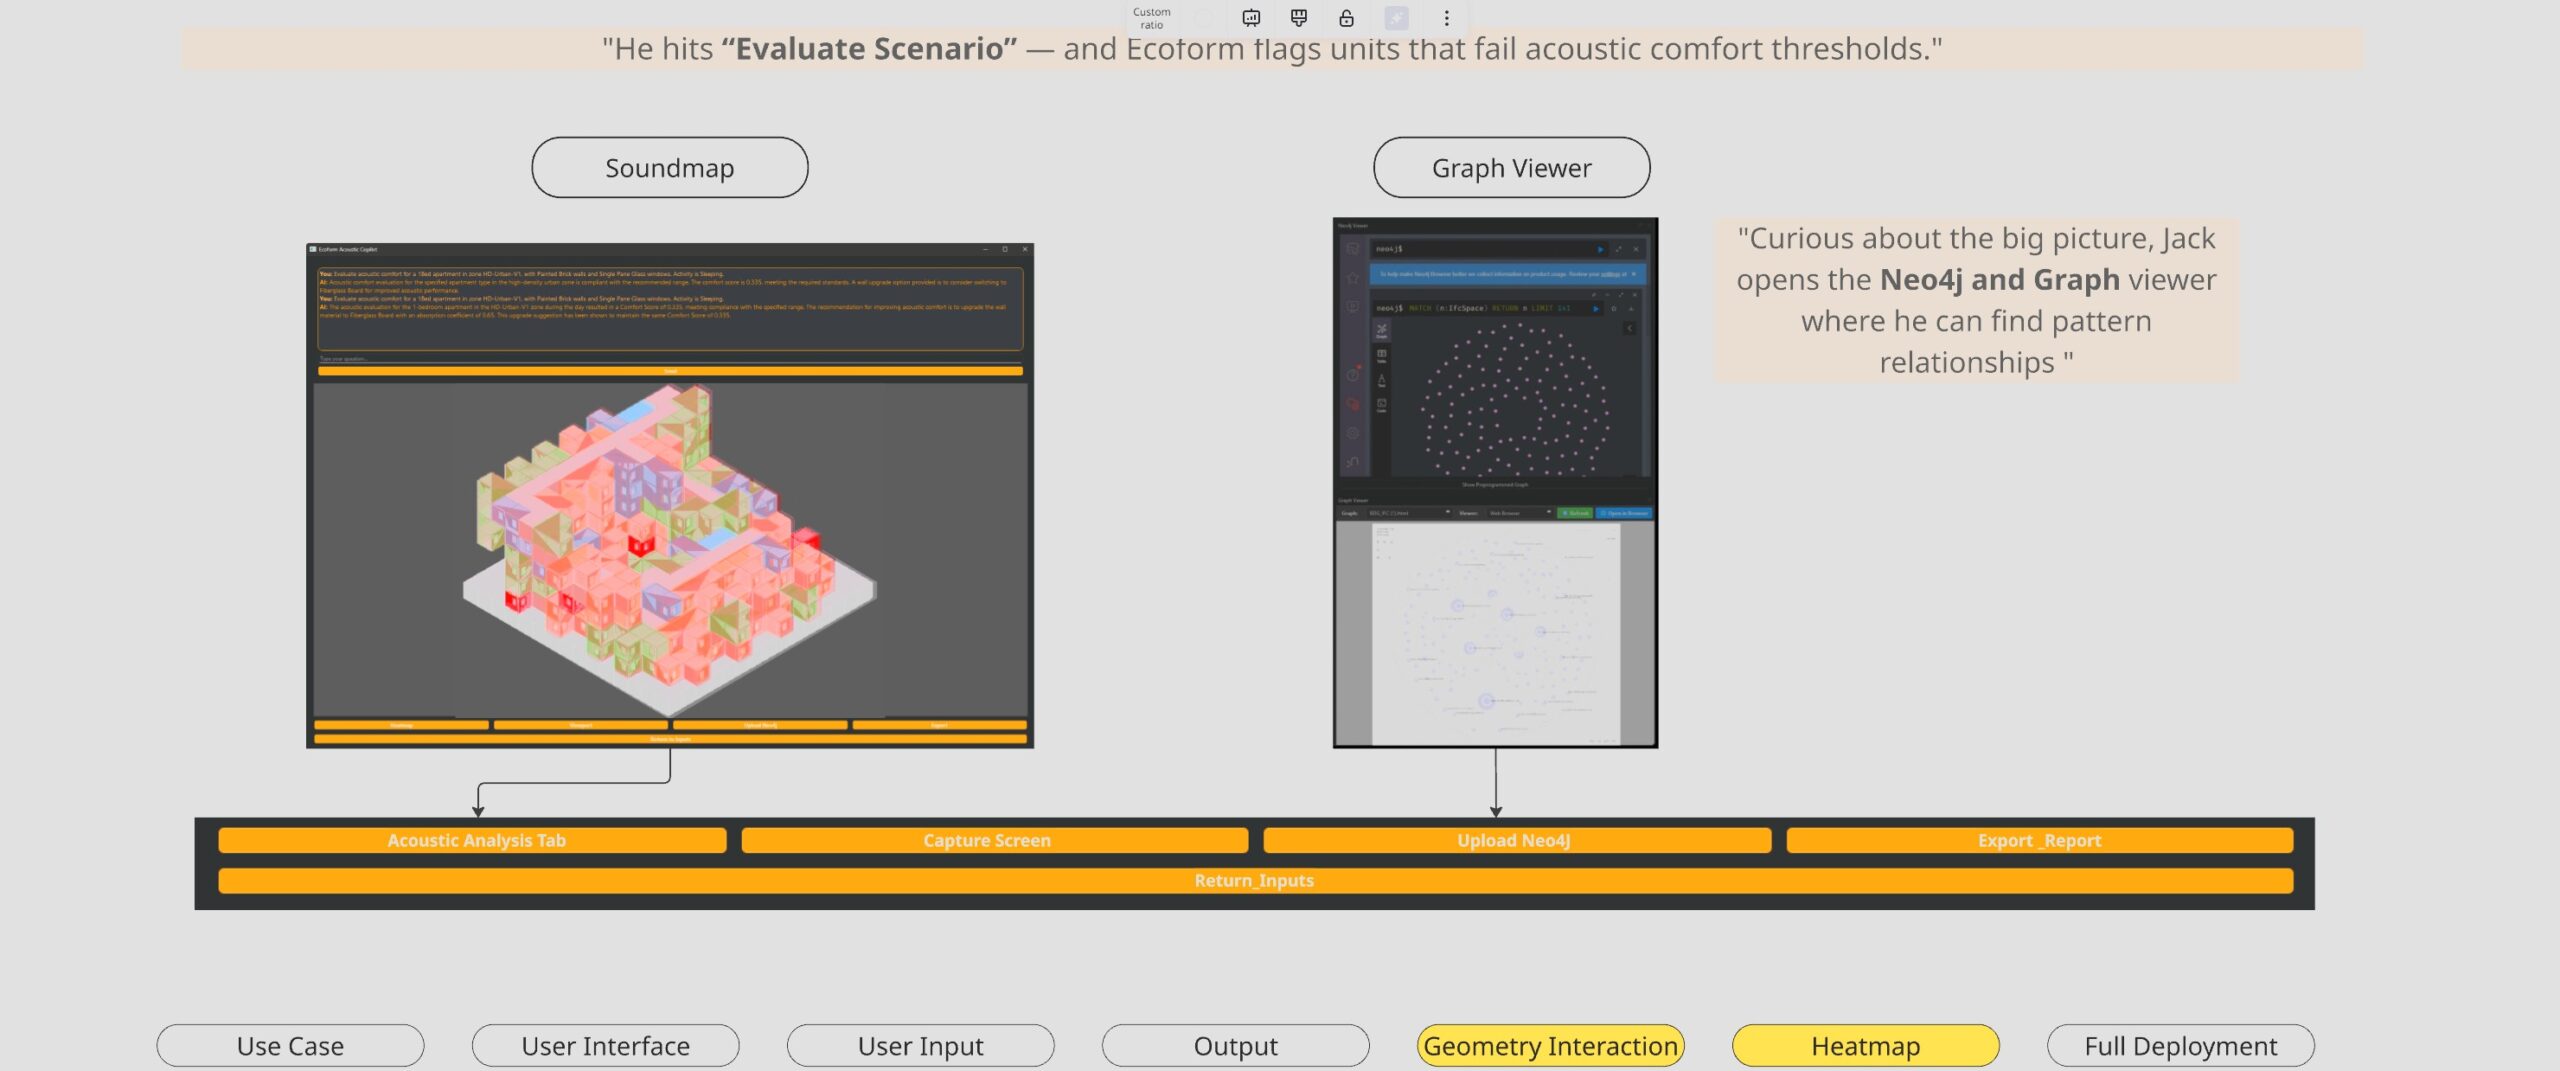
The diagram below shows Ecoform Acoustic Copilot’s user interface workflow. Users first enter details such as apartment type, location, and material preferences. The system interprets this input and assigns it to the correct spatial zone. Next, Ecoform retrieves base acoustic data and adds modifiers, including material absorption or window performance. As users continue, the interface quickly calculates an acoustic comfort score. It then checks this score against ISO and WHO standards. If the score falls short, Ecoform suggests practical mitigation steps. These might include selecting different materials or changing the design. Throughout, the interface provides clear and prompt feedback. At the end, users get a complete report with their comfort score, compliance status, and tailored recommendations. This streamlined workflow helps users make better decisions and keeps all steps in one digital environment.

The diagram below outlines the full machine learning pipeline developed for predicting acoustic comfort scores in apartment and urban design projects. The process begins with a clear problem definition: build a model that predicts acoustic comfort based on apartment design parameters.
1. Data Collection and Dataset Creation
Two key types of input data are gathered:
- Building Data: This includes information from 3,504 apartment samples, capturing details such as materials, spatial configuration, and measured acoustic metrics (like RT60 and SPL).
- Contextual Data: Over 17,500 noise coordinate samples are collected, providing environmental context (e.g., background noise levels in dBA L(a)eq across locations).
All this data is compiled using custom Grasshopper (GH) and Python (PY) scripts, producing a comprehensive initial dataset (dataset-V01) that contains all relevant features.
2. Feature Engineering
The next stage involves preparing the dataset for machine learning:
- Noise Source Level: L(a)eq (dB) is used to quantify environmental noise.
- Noise Mitigation Features: Variables like barrier height and type.
- Architectural Factors: Parameters such as reverberation time (RT60), absorption, floor height, and area.
- Environmental/Contextual Factors: Zoning, time of day, and number/distance of sound sources.
- Categorical Features: Apartment and material types.
Appropriate scaling and encoding methods are applied to each feature type to ensure model readiness (e.g., robust/standard scalers, one-hot encoding, categorical treatment).
3. Model Training
My Profile
With the engineered features (dataset-V02), multiple machine learning models are trained to predict the comfort index:
- Neural Network Model (deep learning)
- XGBoost Model (gradient boosting)
- Linear Regression Model
The models learn to map input features to the target variable—Comfort Index—which quantifies predicted acoustic comfort.
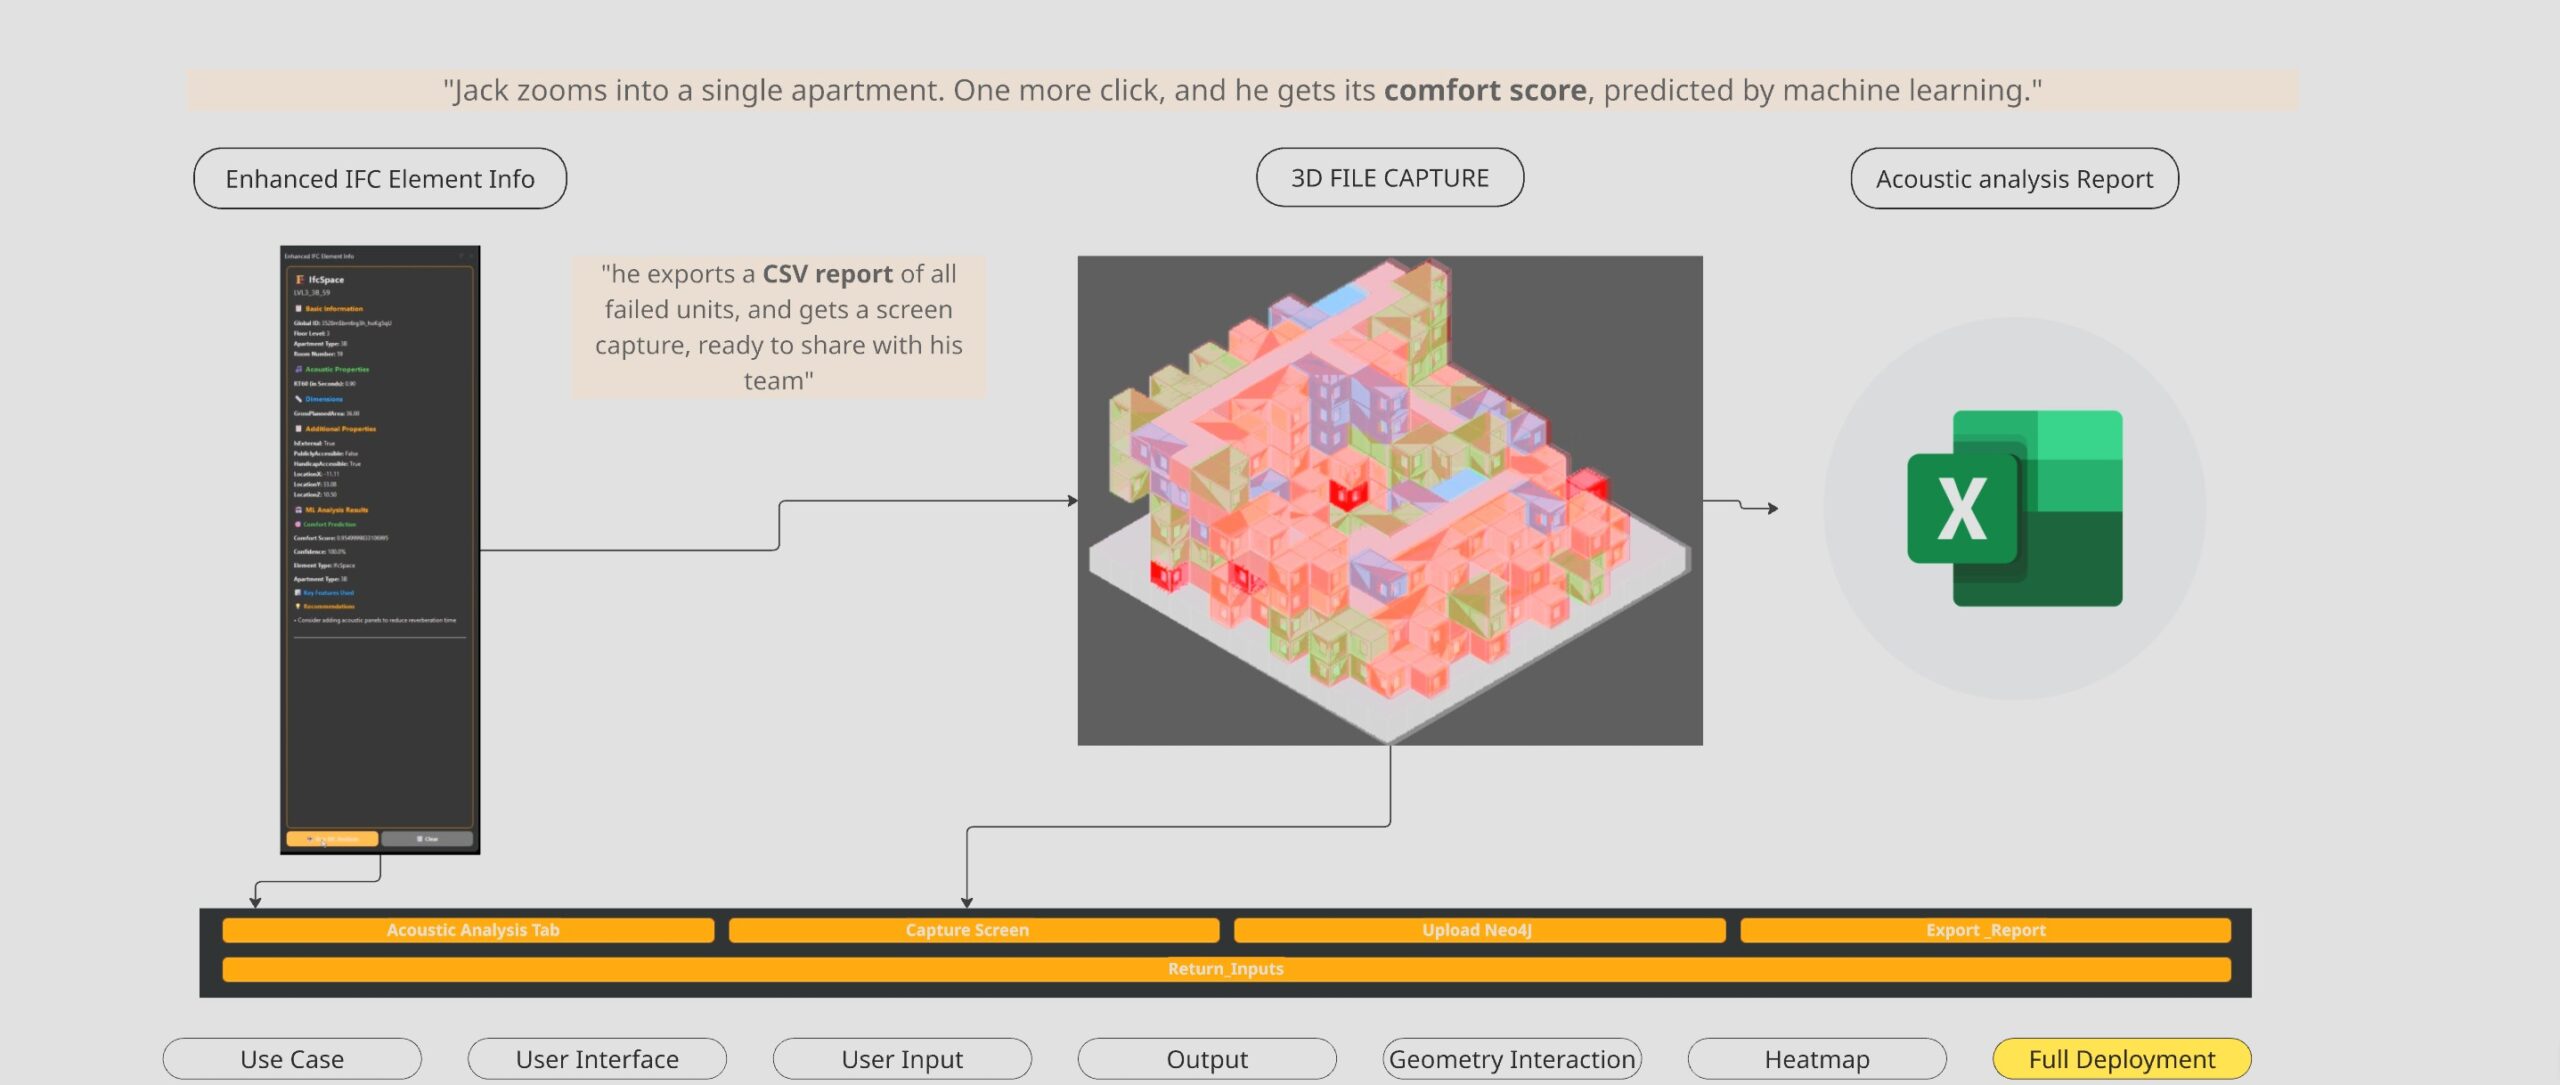
4. Prediction Deployment
The trained models run directly within the Grasshopper environment. This setup allows designers to predict comfort indexes quickly for any new or updated apartment or urban scenario. As a result, Ecoform generates a visual comfort map for all spaces. Designers can use this map to get real-time feedback during the design process.
This workflow starts with raw data collection and continues through careful feature engineering and model deployment. At each step, Ecoform helps urban designers and architects predict, visualize, and improve acoustic comfort. Every decision is based on data, powered by machine learning, and aligned with international standards. This ensures better results at every stage of the project.


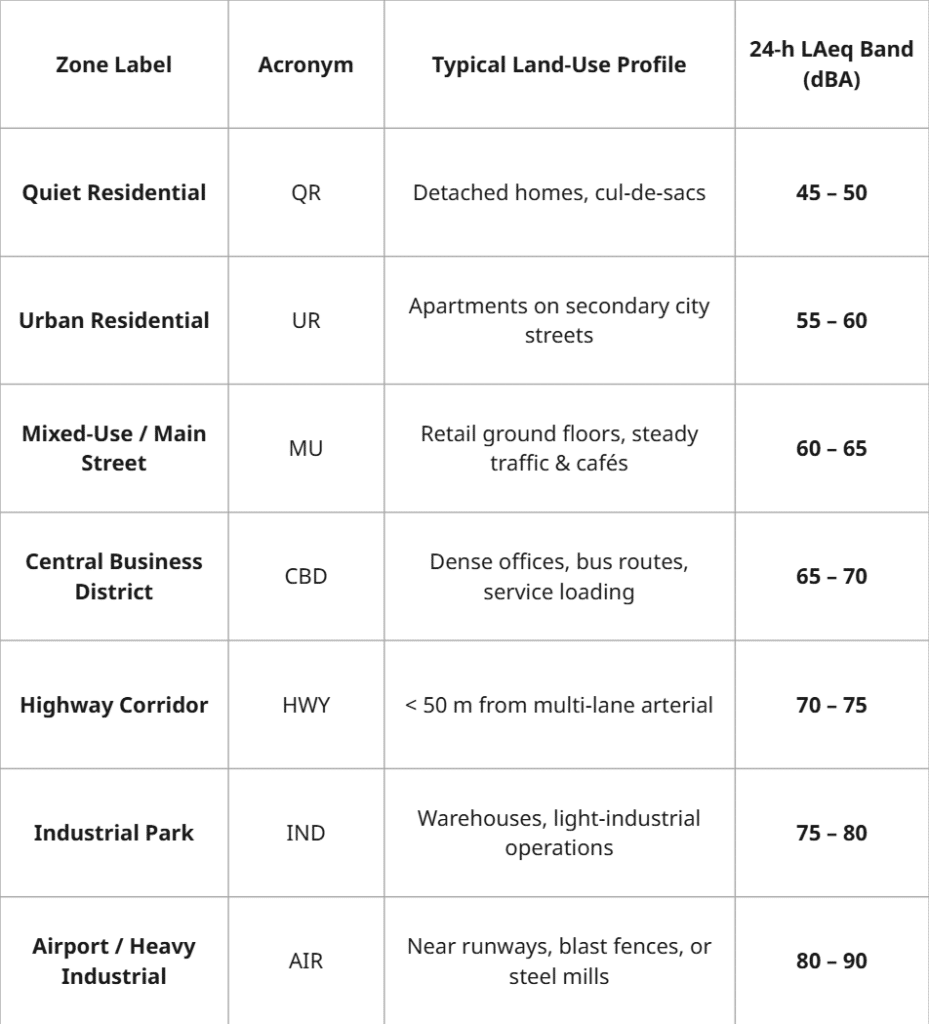
The Ecoform model uses zone-based 24-hour L(A)eq (dBA) bands to predict acoustic comfort across the city. Each point on the city map falls into a noise zone based on its long-term average sound level. This approach reflects real-world exposure to urban noise.
The model assigns each building or unit a zone L(A)eq category based on location. This ensures every acoustic comfort analysis is sensitive to the site’s unique sound environment. By following this zonal approach, Ecoform gives realistic, location-specific recommendations. These outputs align with ISO and WHO standards for urban noise and health. See the example below.
The breakdown table links each zone to its land-use profile and noise intensity. See below.
dBa extraction by coordinates,
Data source - https://www.bts.gov/geospatial/national-transportation-noise-map

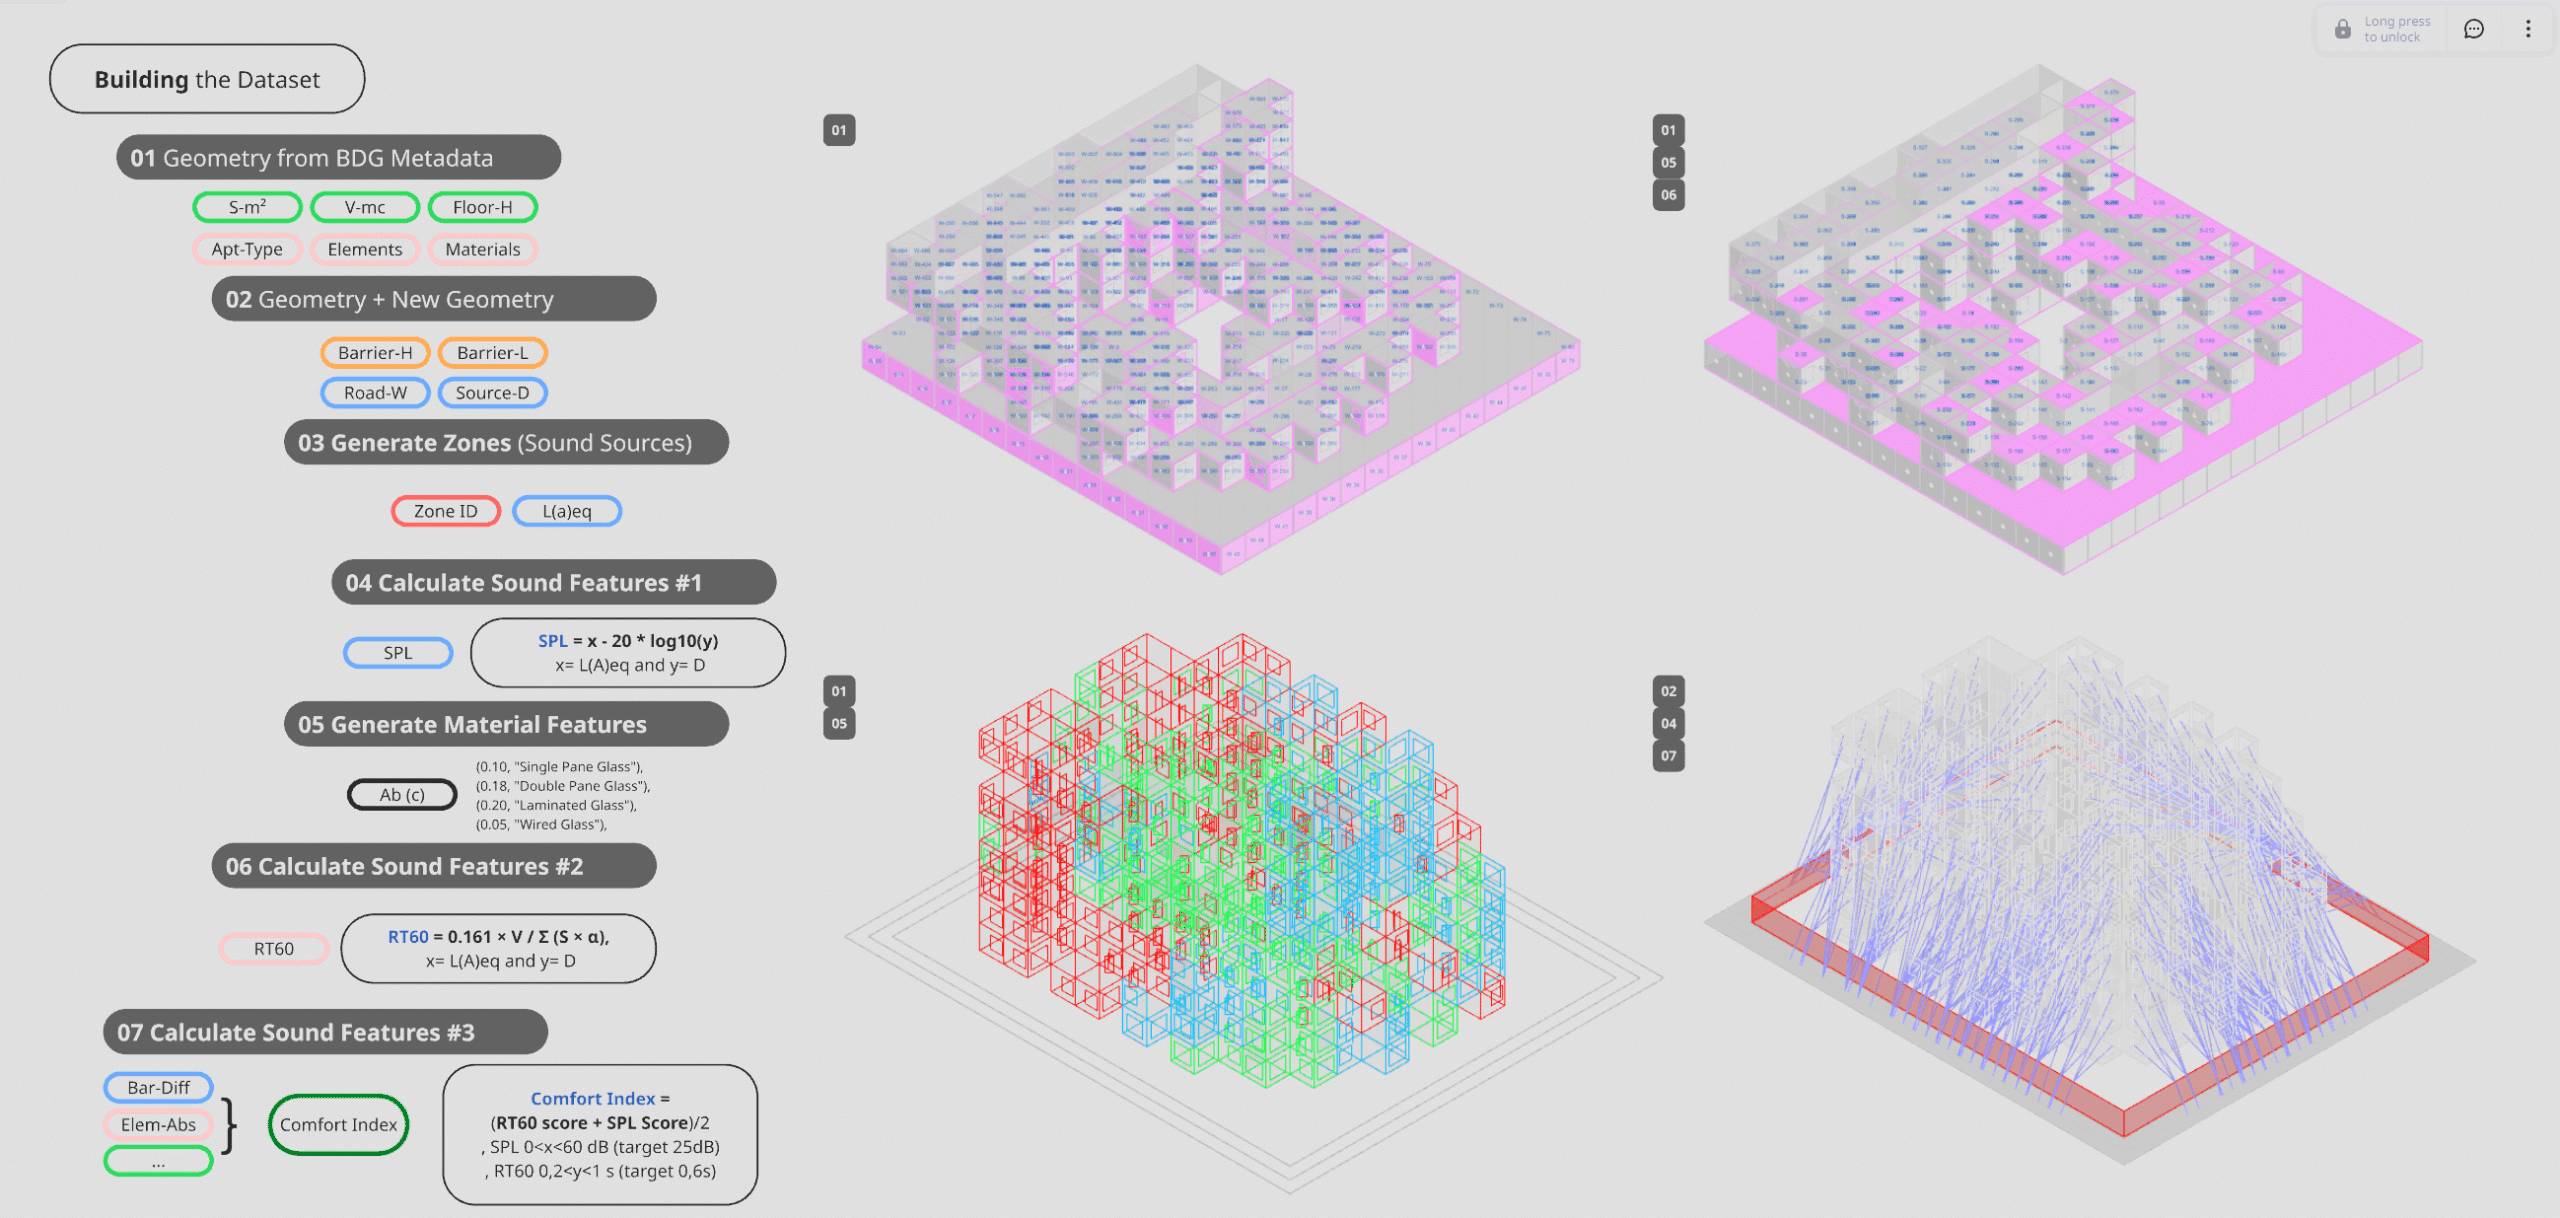
The diagram below shows Ecoform’s systematic dataset workflow. The process starts by extracting geometric and metadata attributes from the Building Generator. Key details include floor height, apartment type, and material properties. Next, the workflow adds more geometry and context. It considers barriers, roads, and the distance to sound sources. Then, the city or building is divided into zones based on sound source locations. Each zone gets a unique identifier and its own L(A)eq noise level.
After that, the workflow calculates sound features. It starts with sound pressure level (SPL), using a logarithmic formula based on source level and distance. Next, the system determines material features, such as glazing types and their absorption coefficients. Advanced calculations then produce acoustic metrics like RT60 (reverberation time), using recognized physical formulas. Finally, the workflow integrates these results to create a comfort index for every zone or apartment. It blends RT60 and SPL scores to compare each space against project targets. The visualizations beside the workflow show how data flows from raw geometry to detailed comfort assessments, supporting accurate, location-specific predictions for any design.

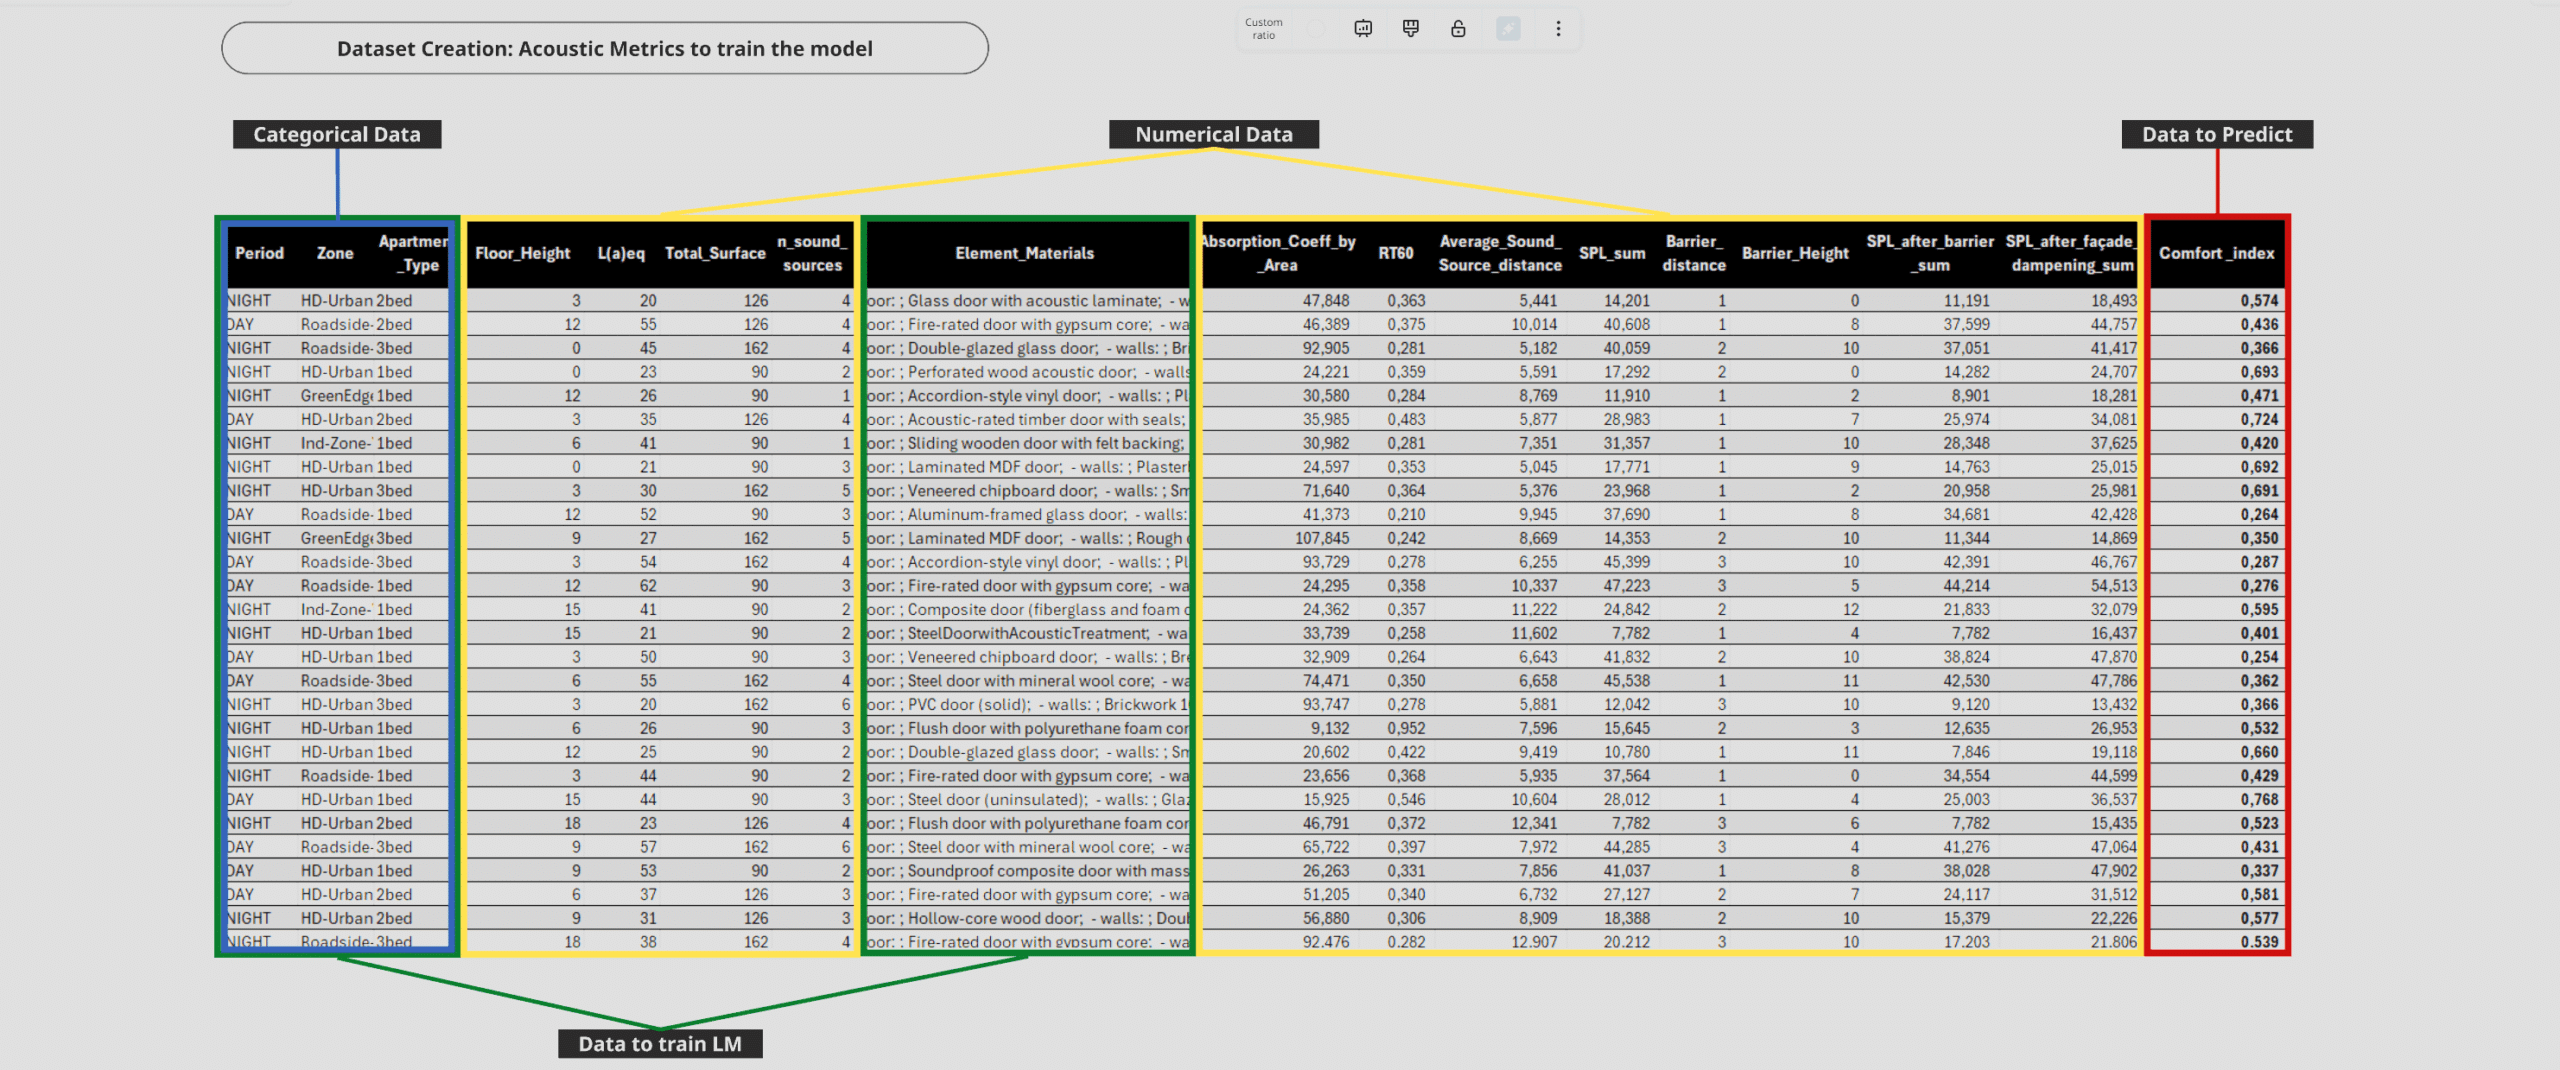
The Ecoform dataset sample organizes information into three main sections. On the left, categorical data describes each sample. This includes variables such as period (day or night), zone type, and apartment type. These details help set the context for each acoustic scenario.
In the center, numerical data records precise values for every space. The columns cover metrics like floor height, total surface area, and the number of sound sources. They also track RT60 (reverberation time), average distance to sound sources, summed SPL, and material absorption coefficients. The data also includes barrier and façade effects, as well as specific material types for doors and walls. Intermediate calculations, such as SPL after barrier or façade dampening, add a nuanced view of each space’s acoustic behavior.
On the right, the “Comfort_index” column contains the value to predict. This target variable blends all features into a single acoustic comfort score for each entry.
By structuring the data this way, Ecoform supports effective training and testing of its machine learning model. The result is accurate, scenario-based comfort predictions for urban design.

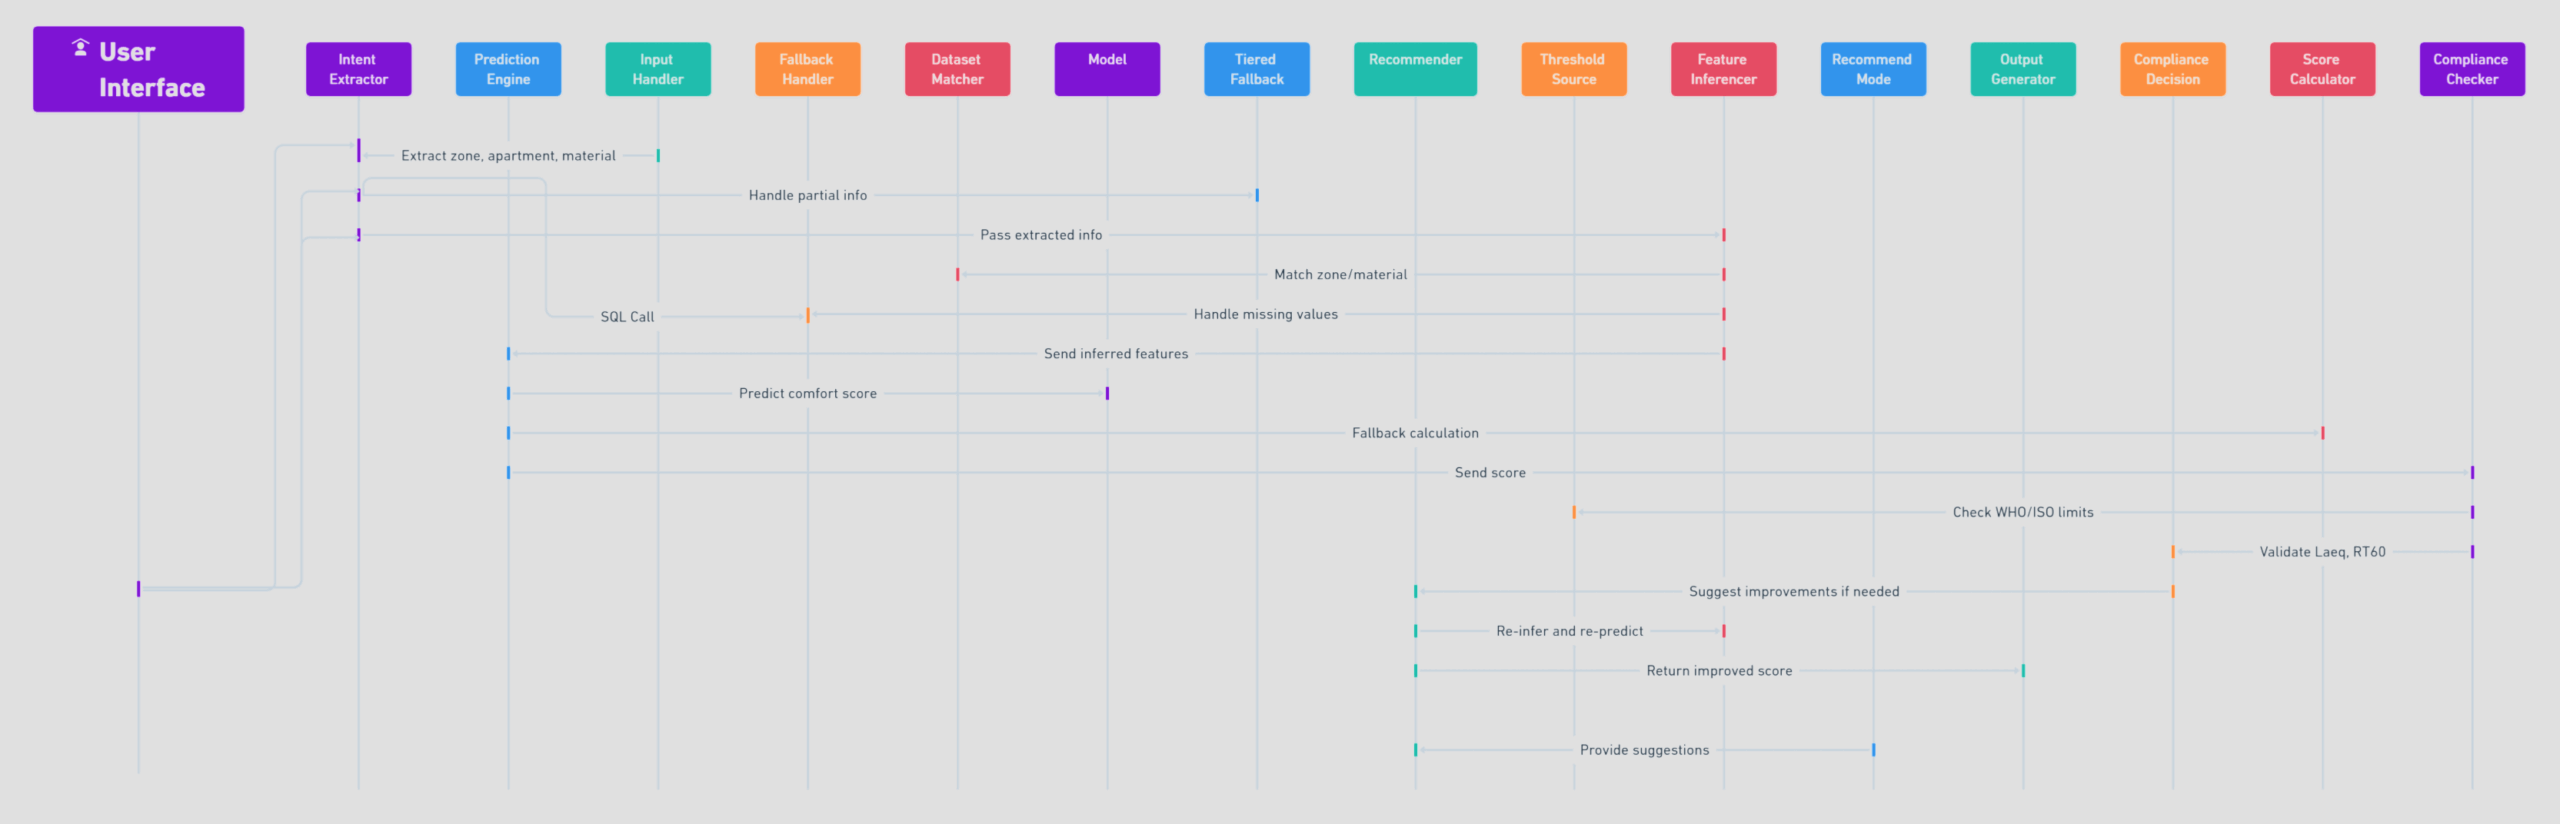
The diagram below maps Ecoform’s backend machine learning workflow. It shows a robust, modular sequence that starts with user input extraction. The workflow then moves to prediction, compliance checking, and result recommendation. Each block—such as intent extraction, prediction engine, dataset matcher, and compliance checker—adds to an iterative and standards-aligned comfort assessment.
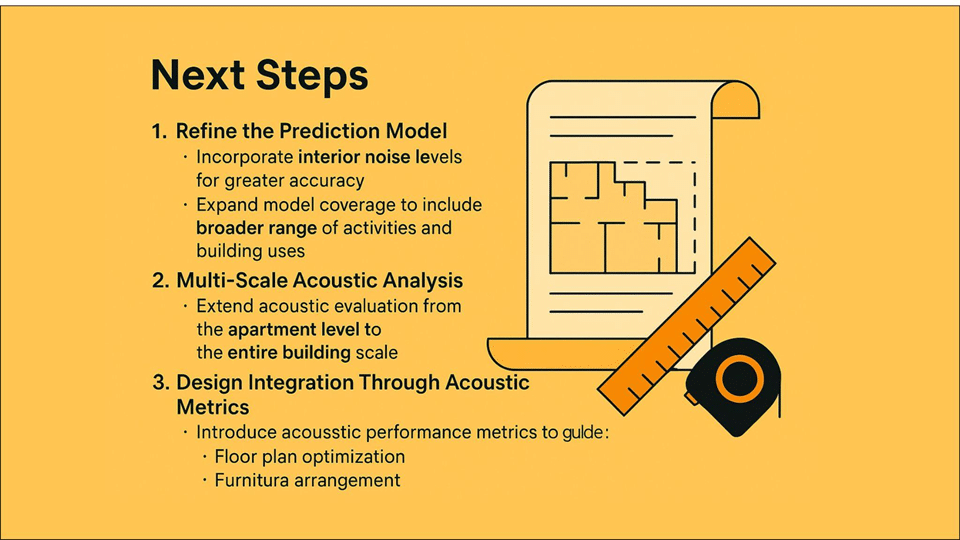
To make the workflow even stronger, you can add explicit steps for data validation and model explainability. Capturing user feedback and connecting with external tools would further improve the process. These additions help make Ecoform more reliable, transparent, and adaptable for real-world urban design projects.

Github/Repo: https://github.com/DrArc/AI25_Studio
Credits
This repository utilizes and extends functionality from João Silva’s LLM-SQL-Retrieval repository. https://github.com/jomiguelcarv/LLM-SQL-Retrieval.git The original repository demonstrated a direct pipeline for SQL retrieval augmented with database schema injection and a self-debugging mechanism for failed queries. For more innovative approaches, check the BIRD Benchmark leaderboard. https://bird-bench.github.io/
Special Thanks to Joao, Erida, and Bao for their technical advice during the development of the UI.
Building Generator (BGD)
This course utilized the BGD Building Generator, provided by Michael T Walsh and Reinhardt Swart, to generate and modify spatial datasets. In our project, these datasets formed the basis for machine learning training to predict acoustic comfort in architectural environments
