Introduction: Transforming Urban Junctions for a Sustainable Future
Urbanization has drastically increased impervious surfaces in cities, leading to environmental challenges such as urban heat islands, stormwater runoff, and reduced access to green spaces. Junctions and intersections, often overlooked, are some of the most impervious and environmentally stressed areas in urban landscapes.
This project aims to tackle these issues by leveraging AI and geospatial technologies to identify and prioritize urban junctions for green interventions. By combining satellite imagery (NDVI, surface temperature), walkability metrics, and ground-level street view analysis, the research provides a multi-faceted approach to understanding and addressing the environmental, social, and spatial challenges associated with urban impervious surfaces.
The result? Interactive tools and datasets that empower urban planners to transform neglected junctions into thriving green spaces, reducing heat, improving stormwater management, and enhancing urban livability. This project bridges the gap between cutting-edge technology and sustainable urban planning, ensuring that cities become more resilient and inclusive for future generations.
Problems of impervious surfaces
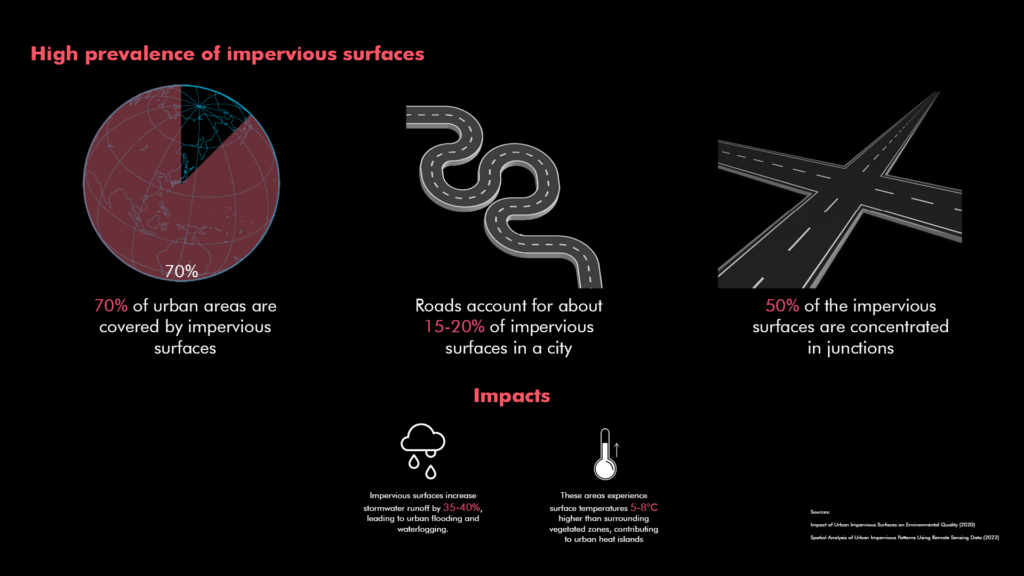
Urban areas across the globe are increasingly dominated by impervious surfaces, covering up to 70% of cities. Roads alone contribute to 15-20% of these surfaces, while intersections and junctions make up nearly 50%, creating critical hotspots for environmental stress.
Impervious surfaces prevent water infiltration, increasing stormwater runoff by 35-40%, which leads to urban flooding and waterlogging during heavy rains. Additionally, these areas absorb and retain heat, resulting in surface temperatures that are 5-8°C higher than vegetated zones, contributing to the urban heat island effect. This slide sets the foundation for why addressing impervious surfaces, particularly at high-impact junctions, is vital for sustainable urban planning.
Transforming Stress Points into Opportunities
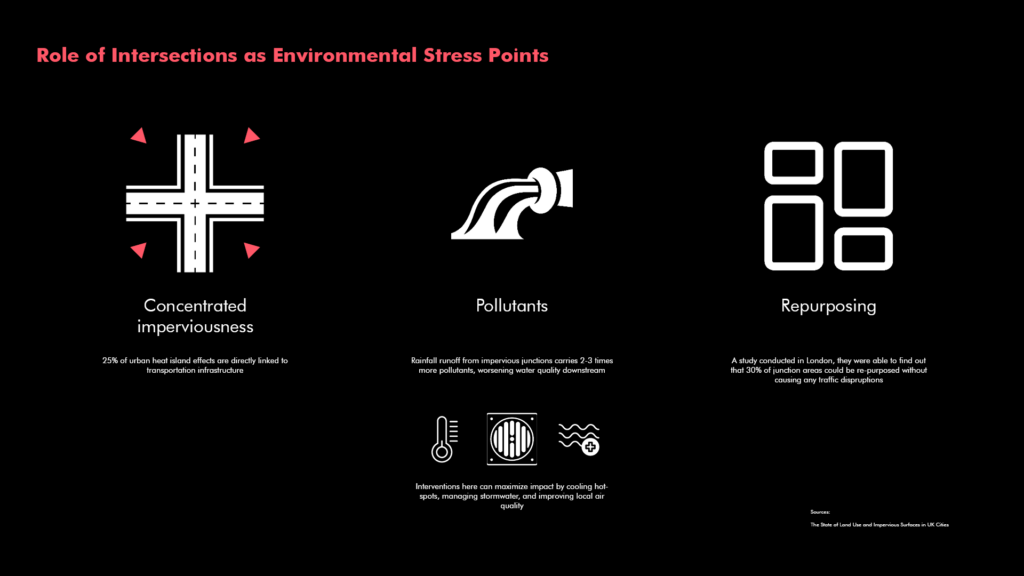
Urban intersections are hotspots of environmental challenges due to their high concentration of impervious surfaces. These areas significantly contribute to urban heat islands, with studies showing that 25% of urban heat effects are directly linked to transportation infrastructure.
Rainfall runoff from these impervious junctions carries 2-3 times more pollutants, degrading water quality downstream and worsening urban pollution. This highlights the dual environmental burden of these areas.
Interestingly, research conducted in London found that 30% of junction areas could be repurposed for green interventions without disrupting traffic. Targeting these spaces offers opportunities to cool urban hotspots, manage stormwater runoff, and enhance air quality.
Urban Prairies: Turning Underutilized Spaces into Natural Habitats
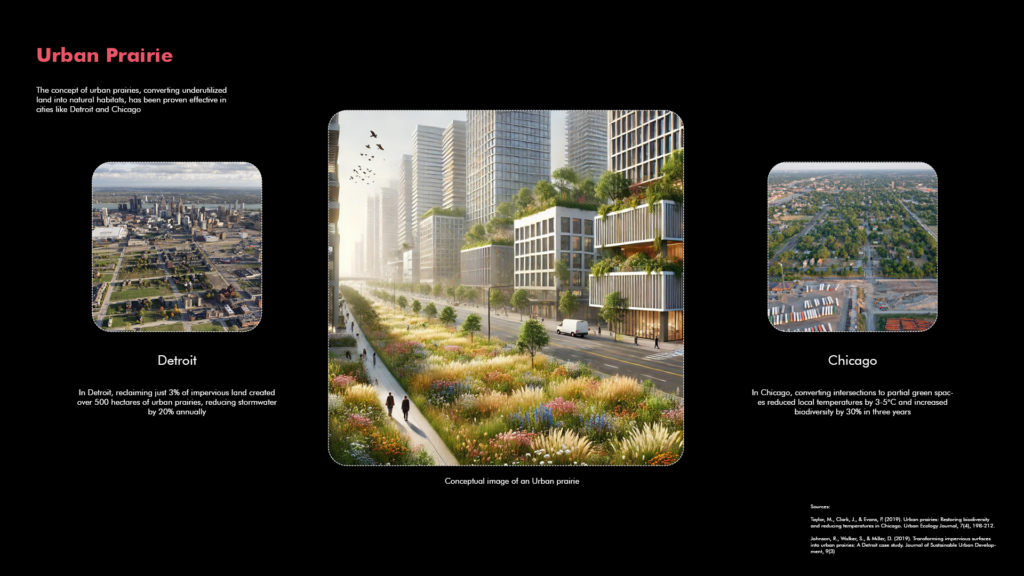
Urban prairies offer a transformative approach to repurposing impervious surfaces, turning them into thriving natural ecosystems.
In Detroit, reclaiming just 3% of impervious land has resulted in the creation of over 500 hectares of urban prairies, which have significantly reduced stormwater runoff by 20% annually.
In Chicago, partial green space interventions at intersections have reduced local temperatures by 3-5°C and increased biodiversity by 30% in just three years.
These examples highlight the potential of urban prairies in tackling environmental challenges while enhancing urban livability and resilience.
Research Question: Addressing Urban Sustainability
“How can AI-driven analysis of impervious surfaces be used to systematically identify and prioritize urban junctions for green interventions?“
“Key Insights: Bridging Gaps in Urban Planning with AI
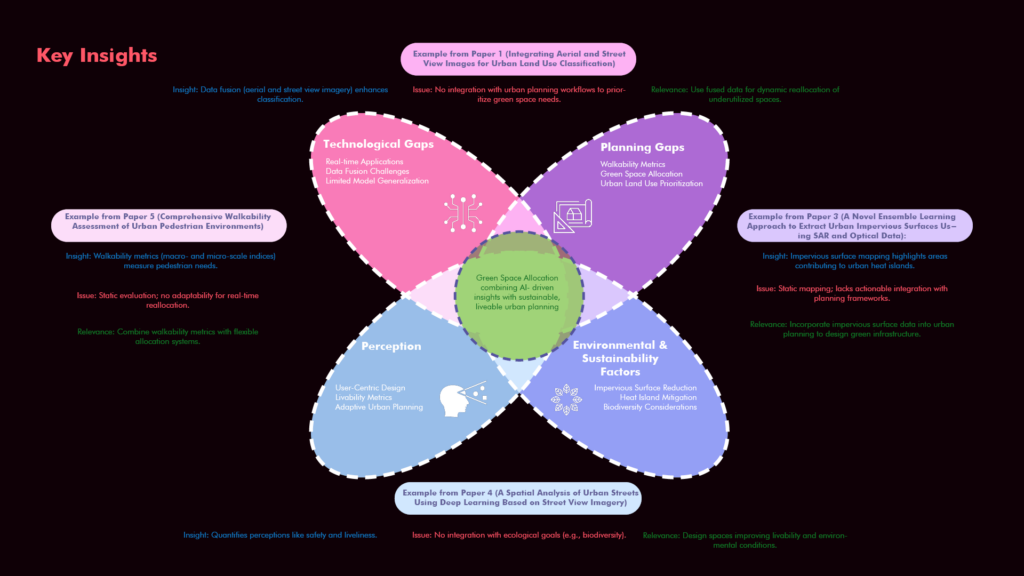
This diagram highlights the intersections of technological gaps, planning gaps, perception, and environmental sustainability factors, forming the foundation of the research.
- Technological Gaps: Current tools lack real-time applications and fail to integrate data fusion techniques effectively.
- Planning Gaps: There is limited prioritization for green space allocation and walkability metrics in urban environments.
- Perception: Urban planning often overlooks user-centric metrics like safety, livability, and adaptive designs.
- Environmental and Sustainability Factors: Existing methods inadequately address impervious surface reduction, heat island mitigation, and biodiversity enhancement.
The core of this research is integrating AI-driven insights to address these gaps, enabling sustainable and livable urban interventions. Each section also draws from state-of-the-art studies, showcasing examples like impervious surface mapping and deep learning applied to urban streets.
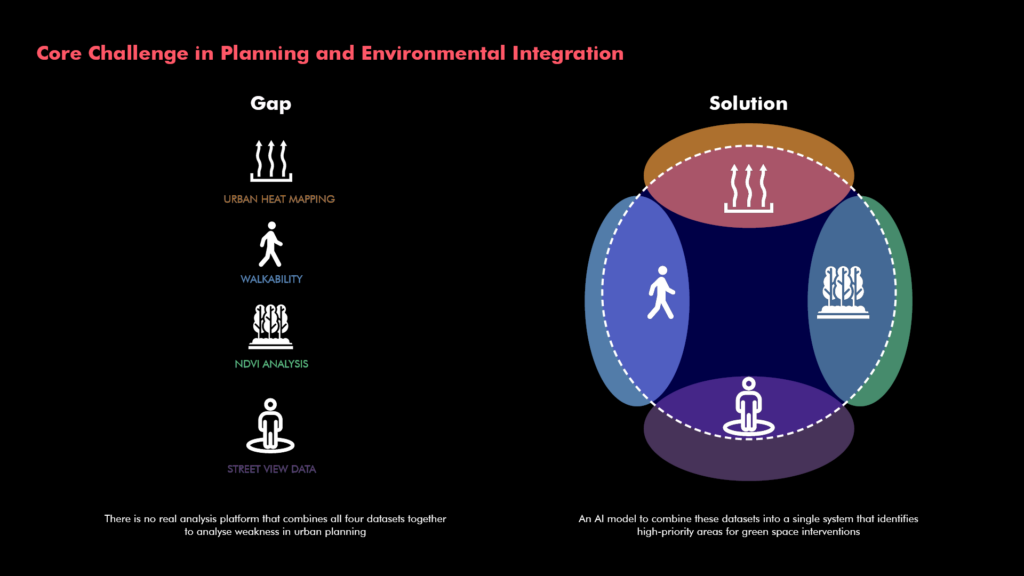
Urban planning faces a critical challenge: the absence of a unified platform that integrates key datasets such as urban heat mapping, walkability, NDVI analysis, and Street View data. These individual metrics are vital for understanding urban weaknesses but are currently analyzed in isolation.
This research proposes an AI-driven solution that seamlessly combines these datasets into a single, coherent system. By integrating spatial and environmental data, the model identifies high-priority areas for green space interventions, ensuring that environmental, social, and urban planning criteria are addressed simultaneously.
This innovative approach bridges the gap between fragmented datasets and holistic urban planning, creating opportunities for more effective and sustainable interventions.
A Systematic Approach to Identifying Urban Green Interventions
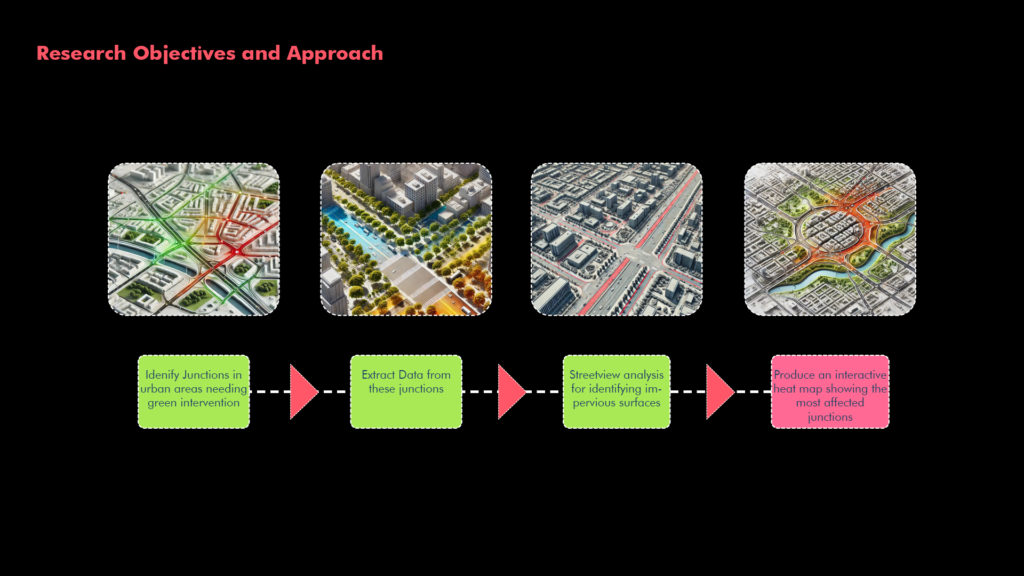
This research outlines a clear and systematic approach to identifying urban junctions for potential green space interventions:
- Identify Junctions: The process begins by pinpointing urban junctions with the greatest need for green interventions, based on factors such as NDVI, heat island effects, and accessibility metrics.
- Extract Data: Environmental and spatial data from these junctions are gathered for deeper analysis, using satellite imagery and open-source platforms.
- Street View Analysis: Ground-level data from street view imagery is analyzed to identify impervious surfaces and vegetation cover, adding resolution and accuracy to the study.
- Interactive Heat Map: The findings culminate in a user-friendly, interactive heat map that visualizes the most affected junctions, helping planners prioritize high-impact interventions.
This structured pipeline demonstrates how AI and data integration can guide effective urban planning strategies.
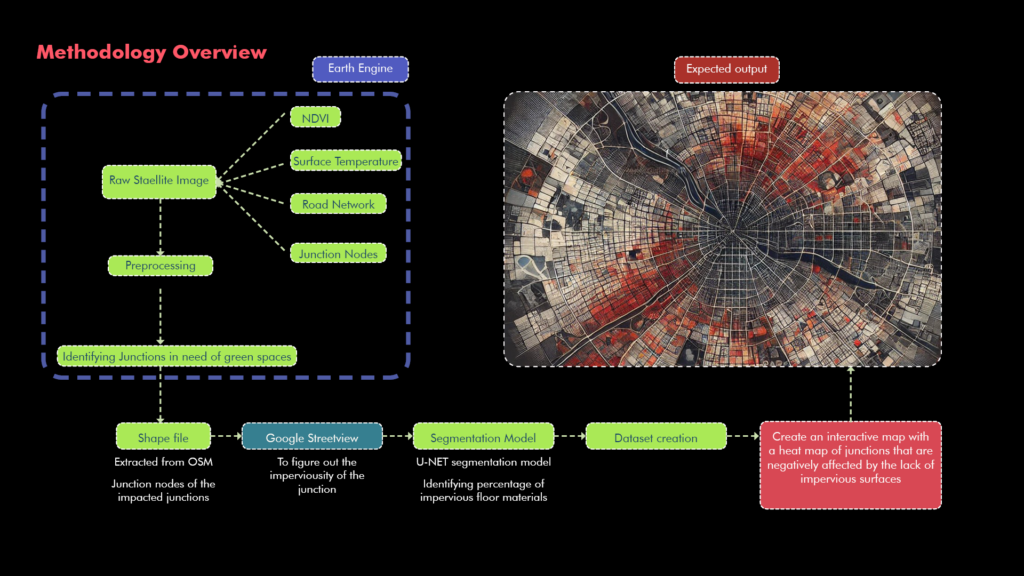
Data Collection via Earth Engine:
- Sources include NDVI, surface temperature, road networks, and junction nodes.
Preprocessing:
- Raw satellite imagery is processed to align spatial data for further analysis.
Identification of Junctions:
- Junction nodes extracted from OpenStreetMap (OSM) serve as the foundation for analysis.
Google Street View Analysis:
- Street view imagery is analyzed using a U-NET segmentation model to calculate impervious surface percentages at each junction.
Dataset Creation and Visualization:
- The processed data is aggregated into a comprehensive dataset, leading to the creation of an interactive heat map. This map highlights the junctions most affected by impervious surfaces, prioritizing areas for intervention.
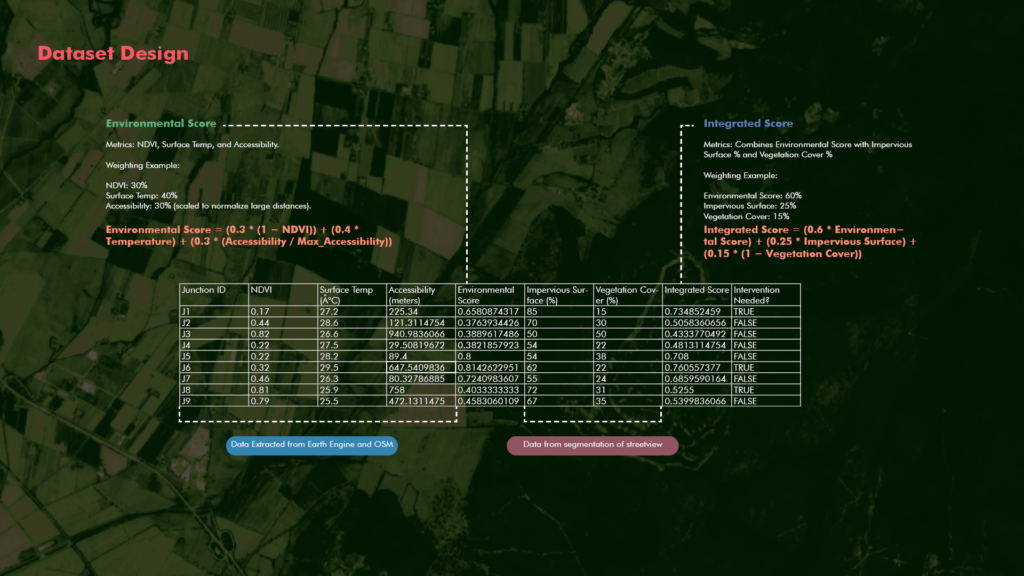
The dataset for this research is designed to integrate multiple environmental and spatial metrics to identify urban junctions requiring green interventions:
- Environmental Score:
- Combines NDVI, surface temperature, and accessibility to nearby parks.
- Weighting:
- NDVI: 30%
- Surface Temp: 40%
- Accessibility: 30%
- Integrated Score:
- Builds on the Environmental Score by incorporating impervious surface percentages and vegetation cover extracted from street view segmentation.
- Weighting:
- Environmental Score: 60%
- Impervious Surface: 25%
- Vegetation Cover: 15%
- Data Sources:
- Earth Engine: NDVI, surface temperature, and accessibility data.
- Street View Segmentation: Impervious surface and vegetation cover analysis.
The resulting table helps prioritize junctions for intervention based on quantitative thresholds, offering a robust framework for urban planners.
Expected Outcomes: Visualizing High-Impact Junctions
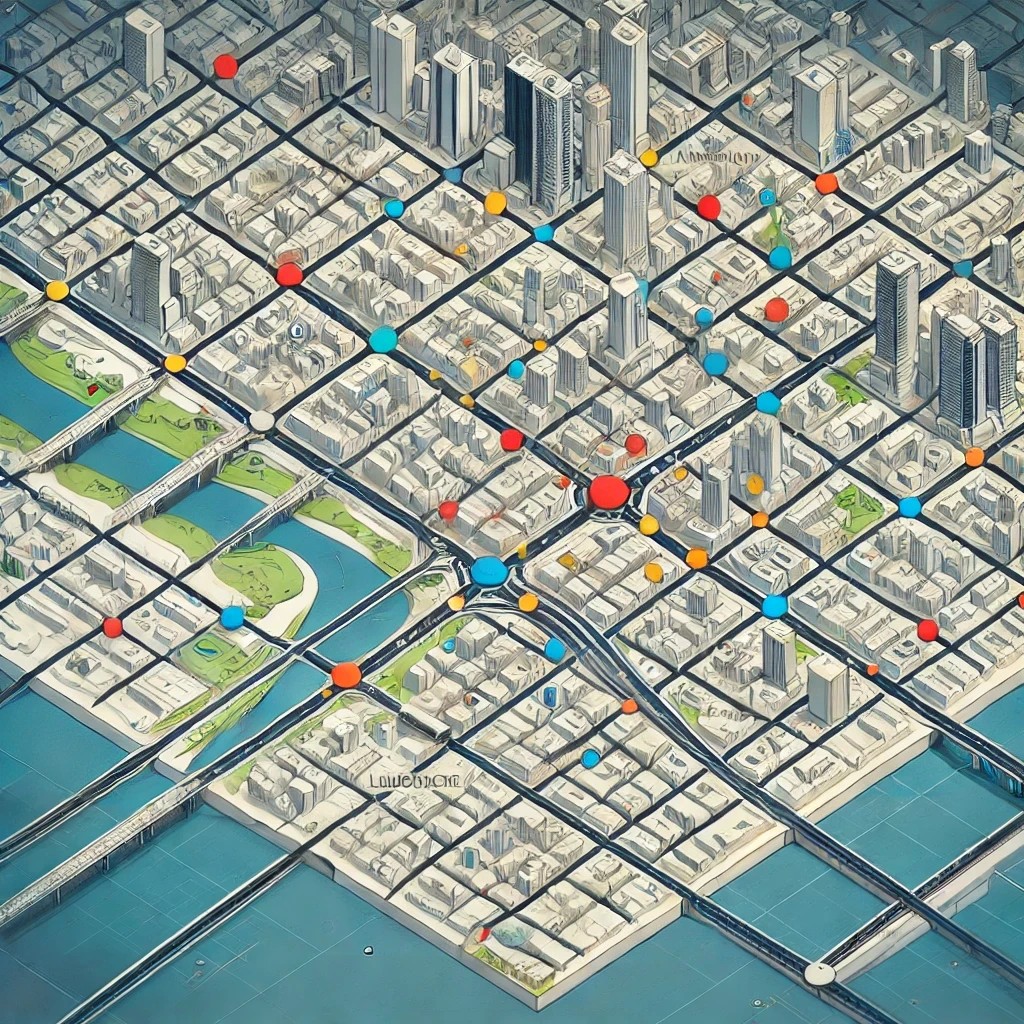
Interactive 2D Map:
- Displays impacted junctions, color-coded based on their need for intervention.
- Provides a heatmap-like visualization for quick identification of problem areas.

