
Introduction
As my final submission, I decided to create an environmental school in response to the urban environment. A project that harnesses the mass of the building in a way to enhance spaces for a variety of purposes is the idea behind the design.
As a starting point for architectural massing, very basic elements are used. The complexity of the building could then be managed and controlled. My design uses simple boxes, which can be multiplied and stacked to create a unique geometry. It can also be iterated to come up with a variety of designs that meet the project’s requirements.
Goals
- Reduce the total amount of solar radiation on the site and facade.
There is no doubt that the most significant part of this project is not the actual mass of the building, but rather the methodology that was created in order to analyze different projects at various scales and types based on that methodology. This can be achieved by creating a system loop that can be used to analyze and inform the performance of the project in various ways (Mass, Openings, Comfort, etc.)
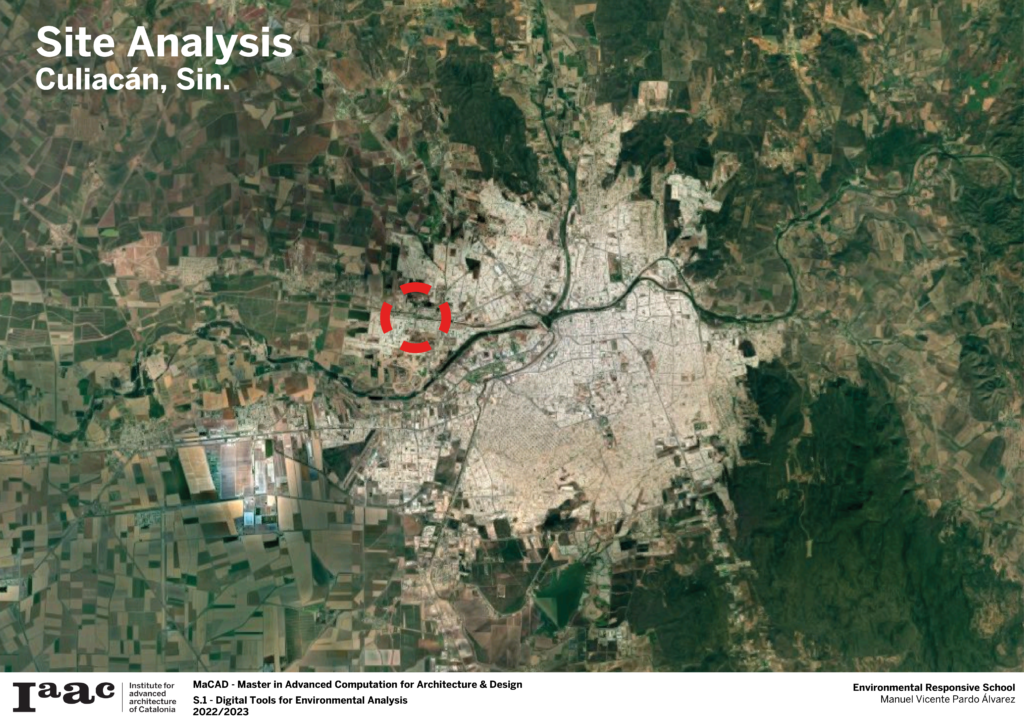
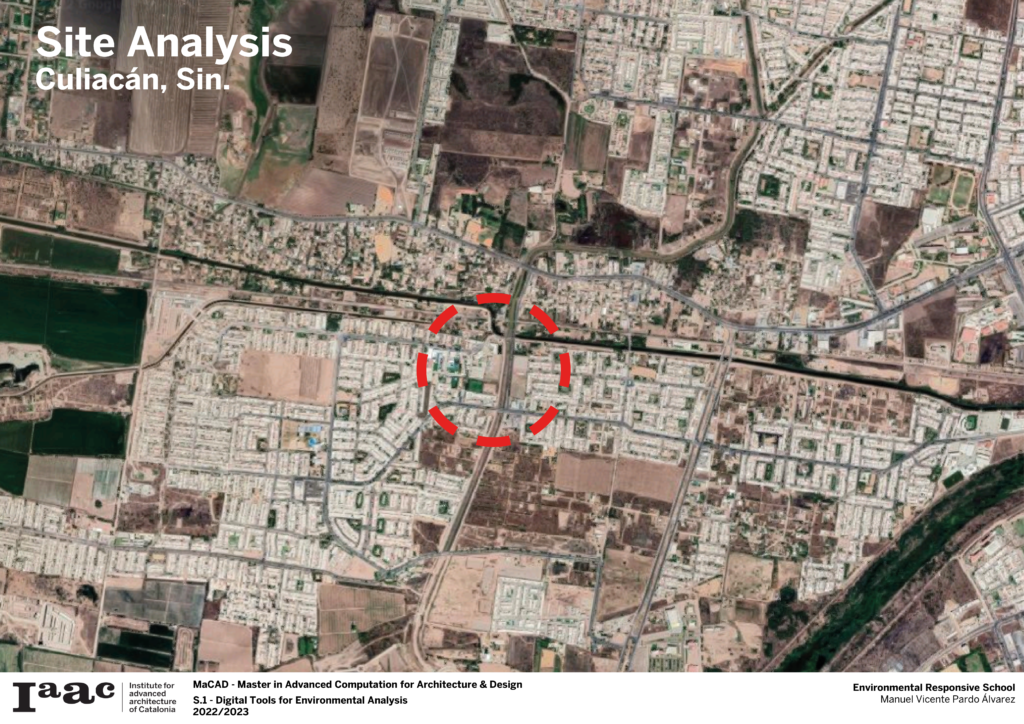
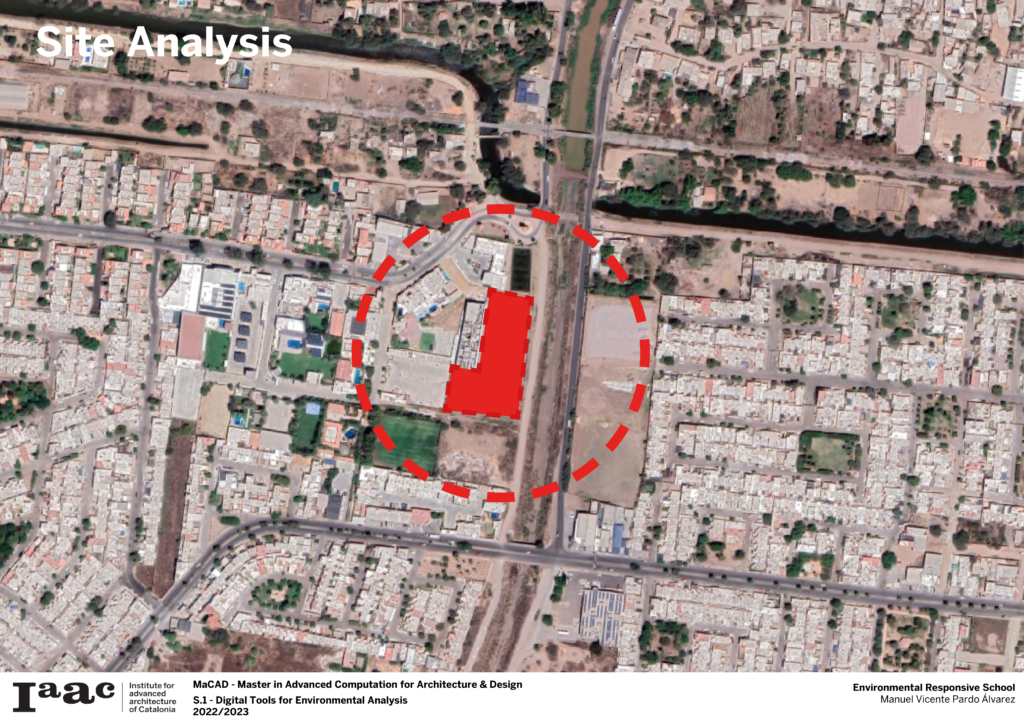
Site analysis
México climate
There are seven major types of climate that can be found on the national territory. With larger surfaces, the climates stand out to a greater extent: Warm Subhumid, Dry and Semi-dry, Very Dry or Dry Desert; with smaller surfaces, the climates are Warm Humid, Temperate sub-humid, Temperate Humid and Cold.


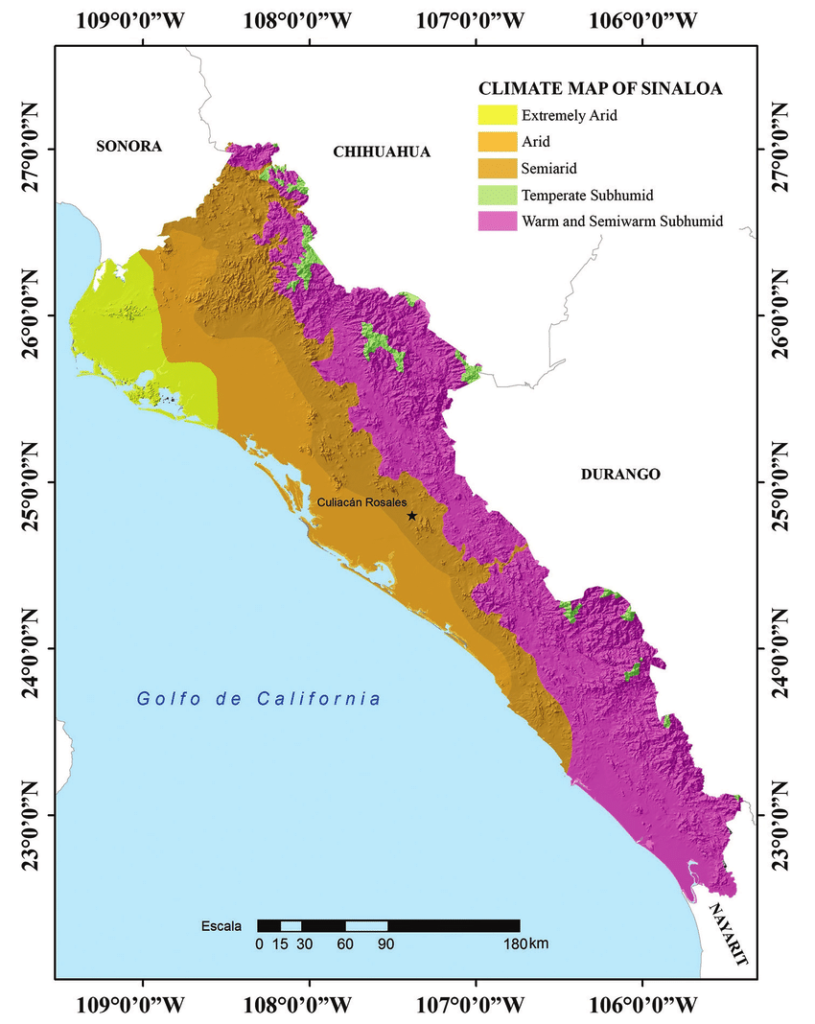
Sinaloa Climate
The warm sub-humid climate of 48 percent of the state can be found in a strip from Choix to the border with Nayarit. In a strip running from El Fuerte to Mazatlán, 40% of the climate is dry and semi-dry. A 10% dry climate can be found near Los Mochis, while a 2% subhumid temperate climate can be observed at the higher altitudes of the Sierra Madre Occidental. The average annual temperature of the state is around 25°C. The average minimum temperatures are around 10.5°C in the month of January and the average maximum temperatures can be higher than 36°C during the months of May to July.
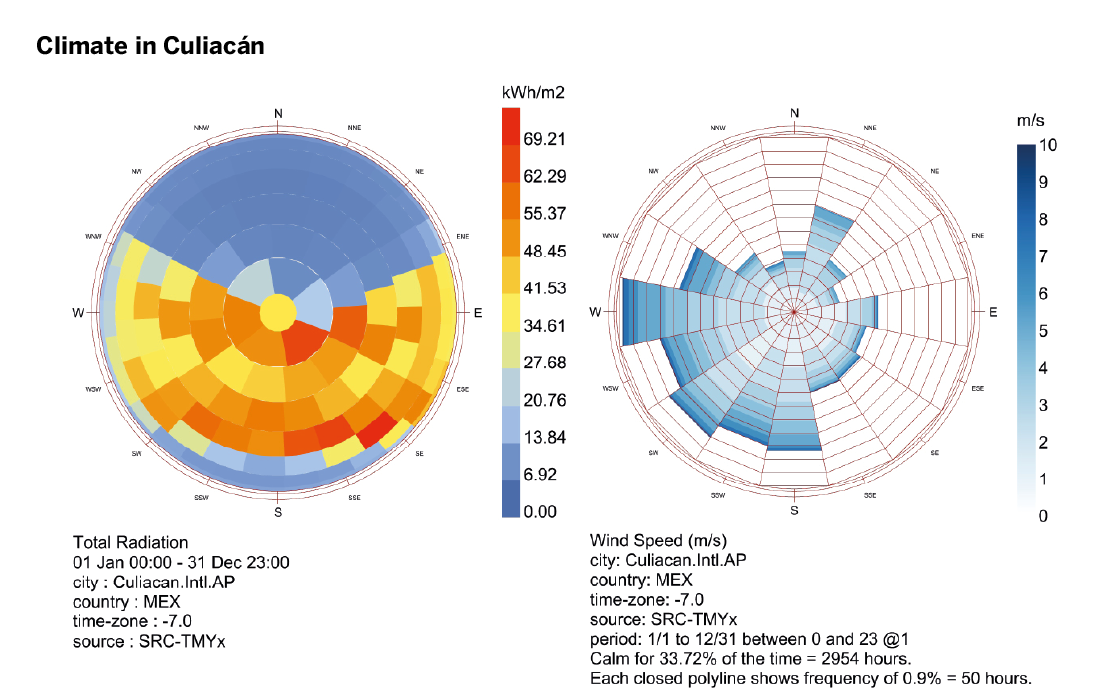
Culiacán Climate
The site is situated northwest of the city of Culiacán Sinaloa. In the city the hot season lasts for 5.5 months, from May 3 to October 21, with an average daily high temperature above 32.22°C. The hottest month of the year in Culiacán is July, with an average high of 35.56°C and a low of 25.56°C.
The cool season lasts for 2.5 months, from December 6 to February 19, with an average daily high temperature below 29.44°C. The coldest month of the year in Culiacán is January, with an average low of 12.22°C and high of 27.78°C.

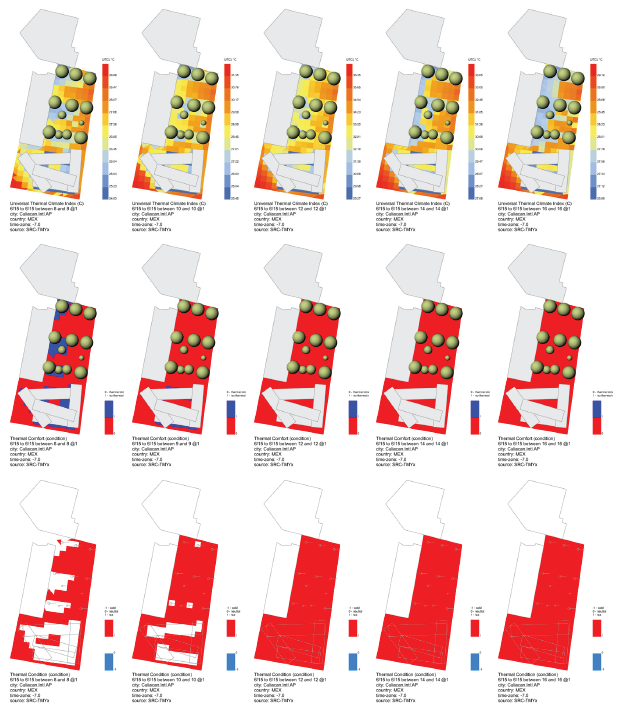
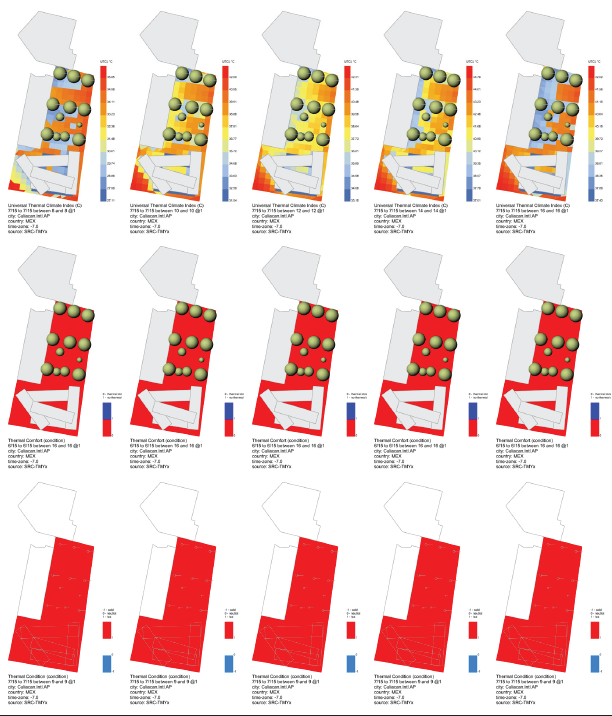
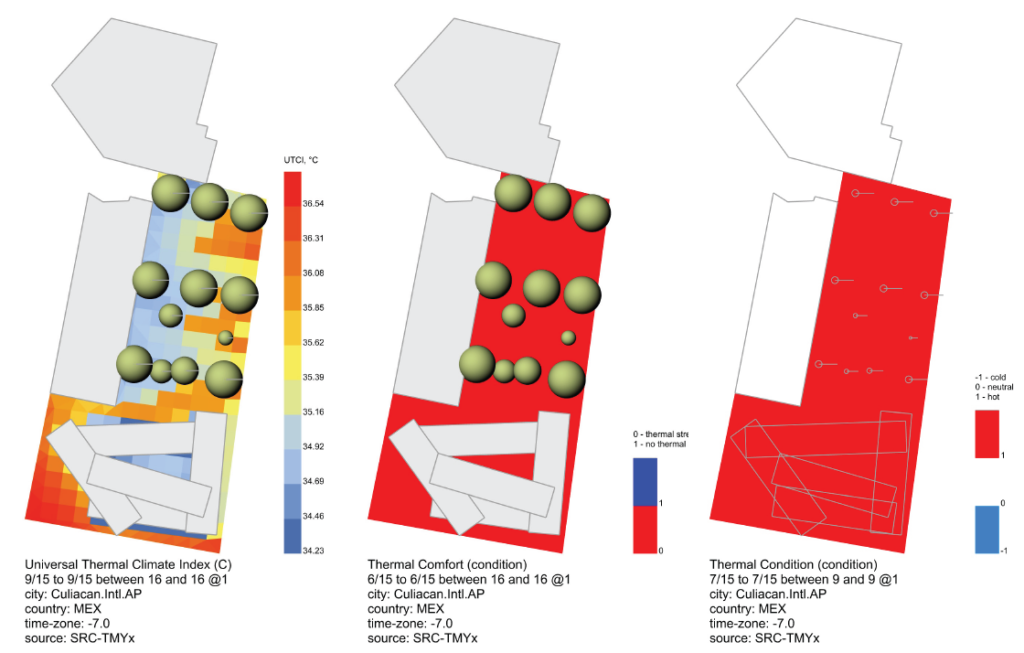
Thermal Comfort
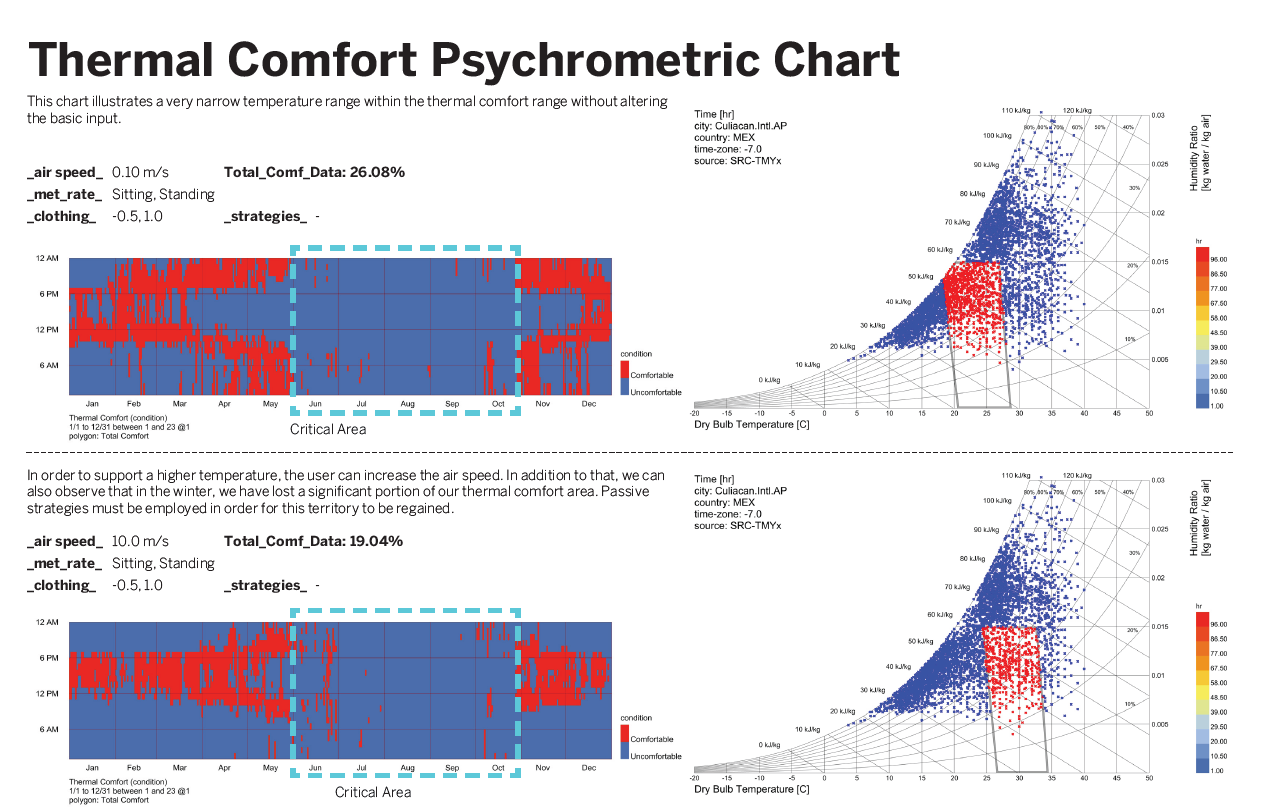
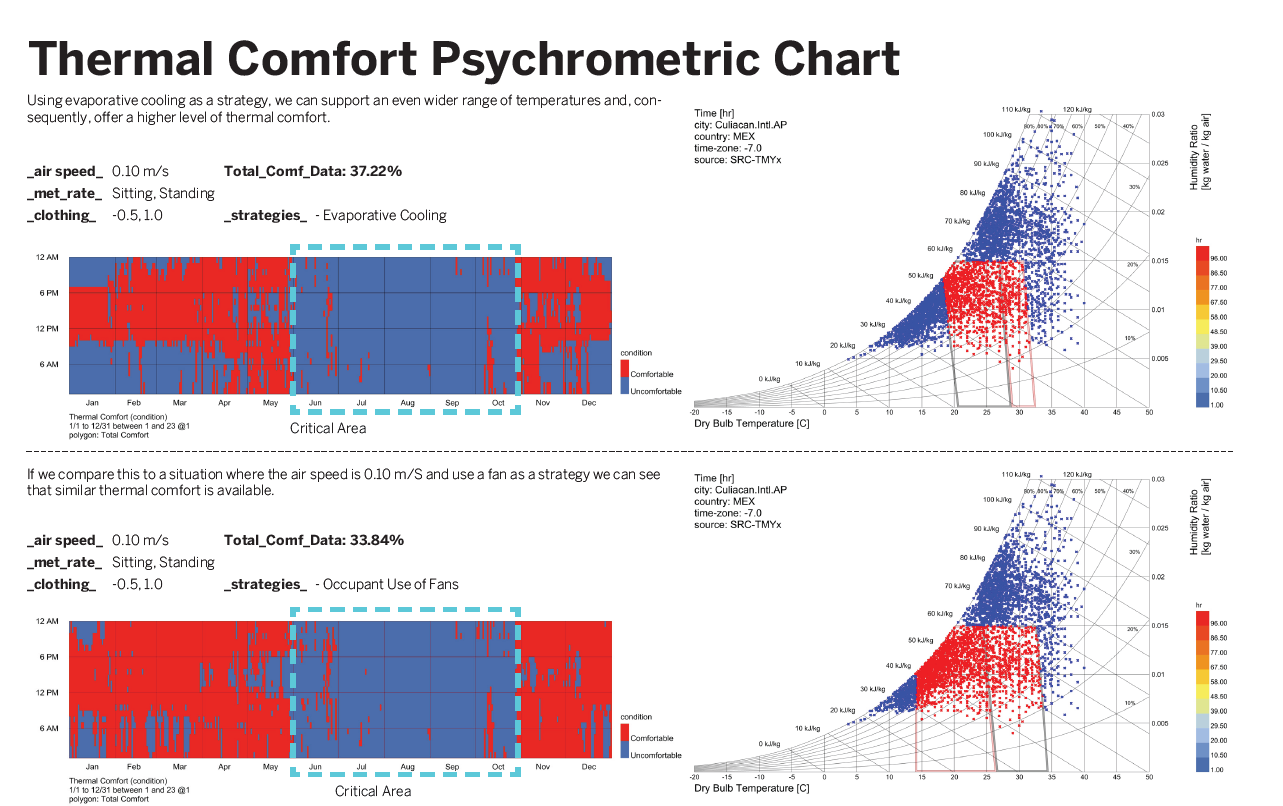
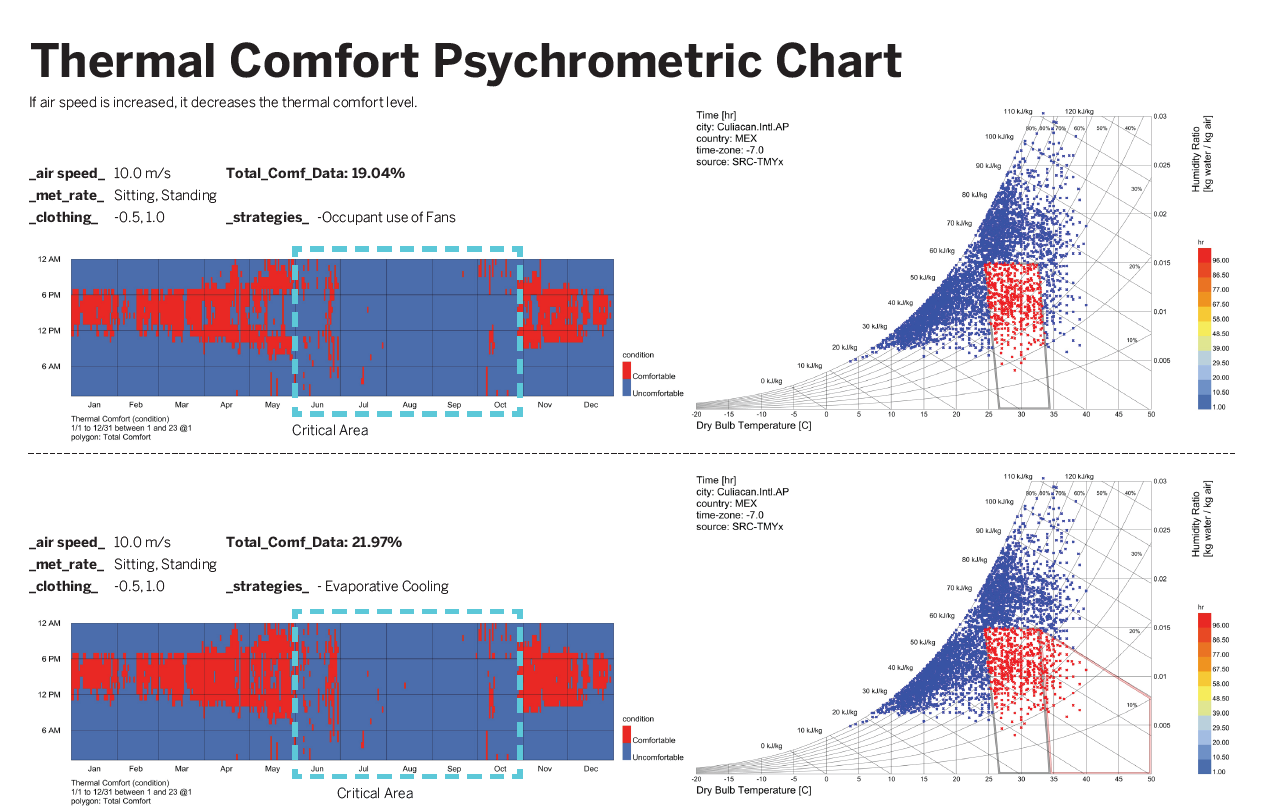
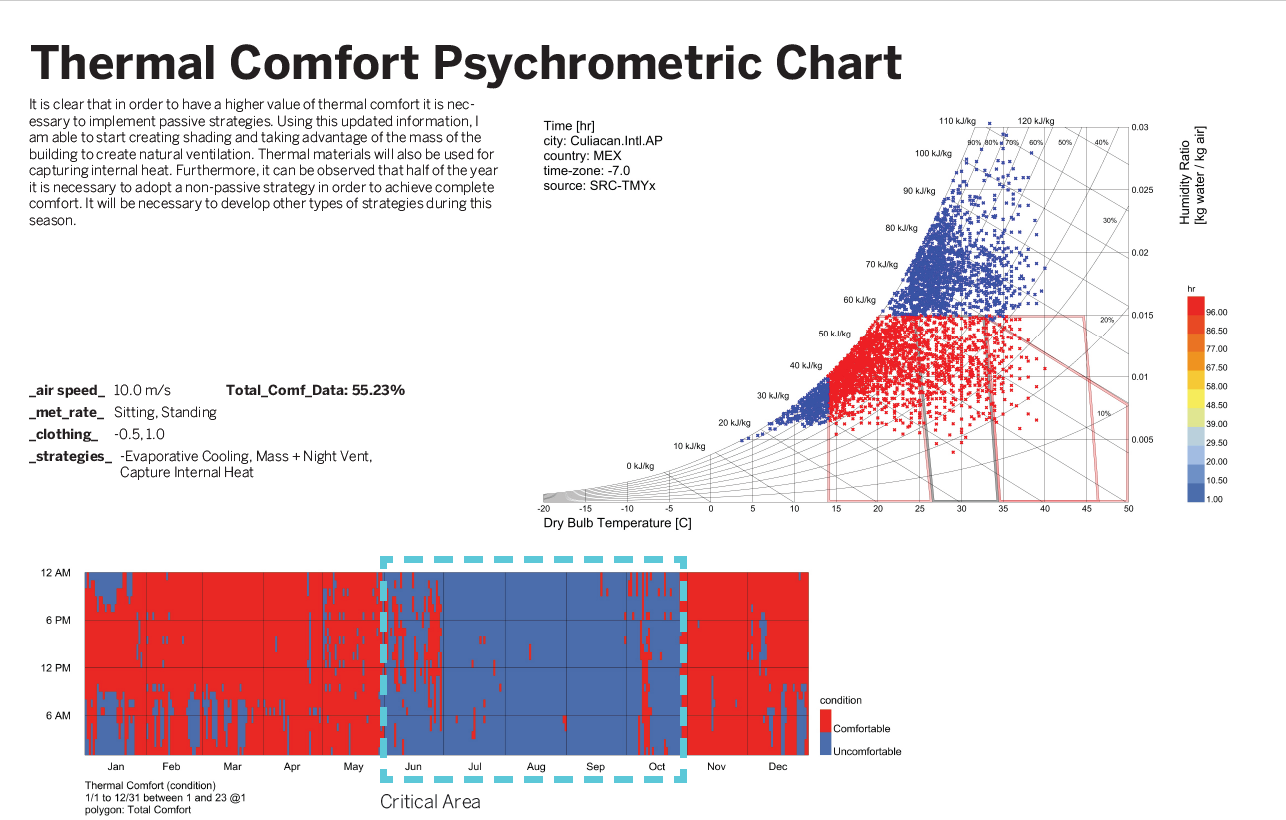

By using this type of visual data, I was able to better understand the climate of this city. From there, create strategies for the building’s performance and test models to make quantitative decisions.
Design workflow
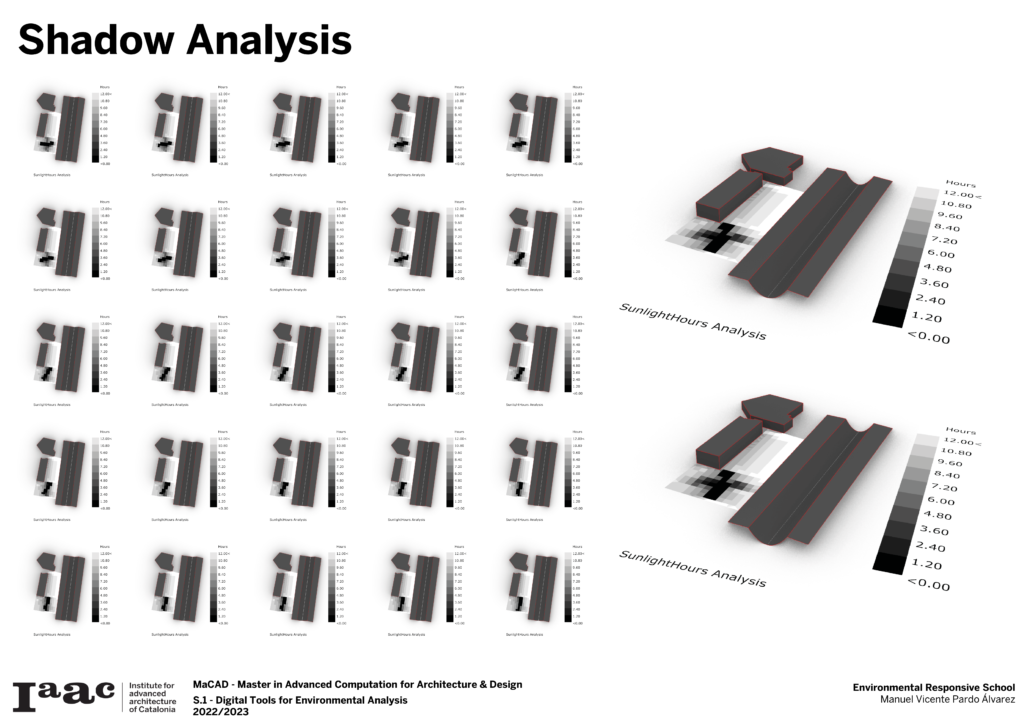
Identifying the best case scenario for the whole building was the first step. In order to support my decisions, I analyzed the shadows of different iterations of buildings.
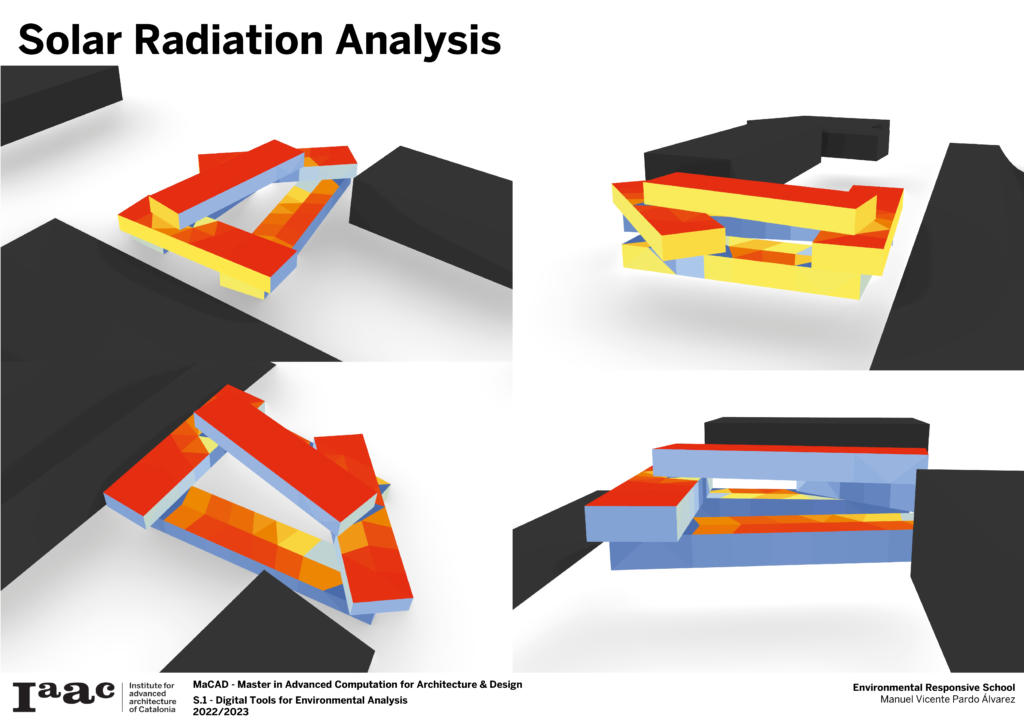
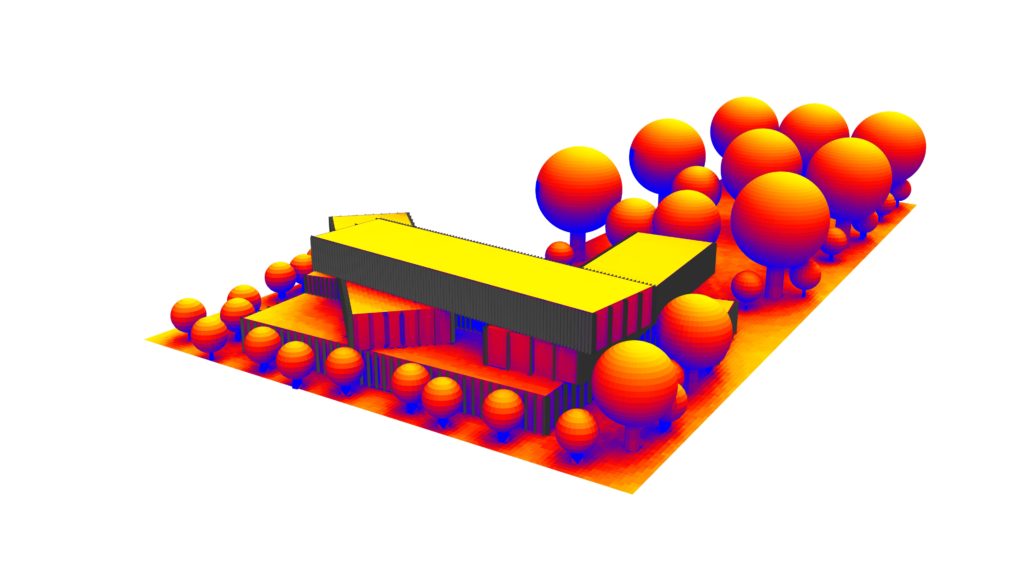
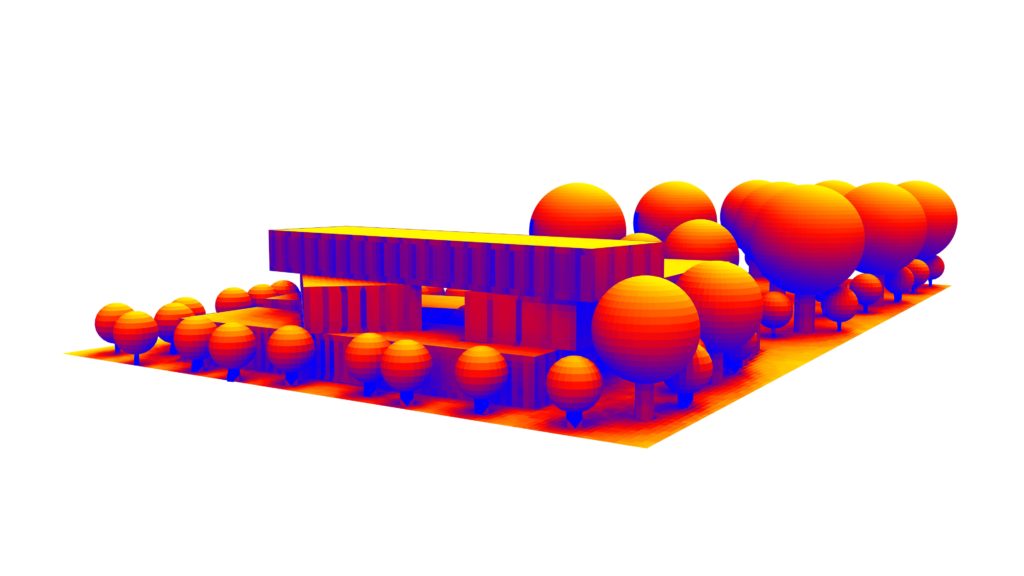
Solar Radiation & Day Light
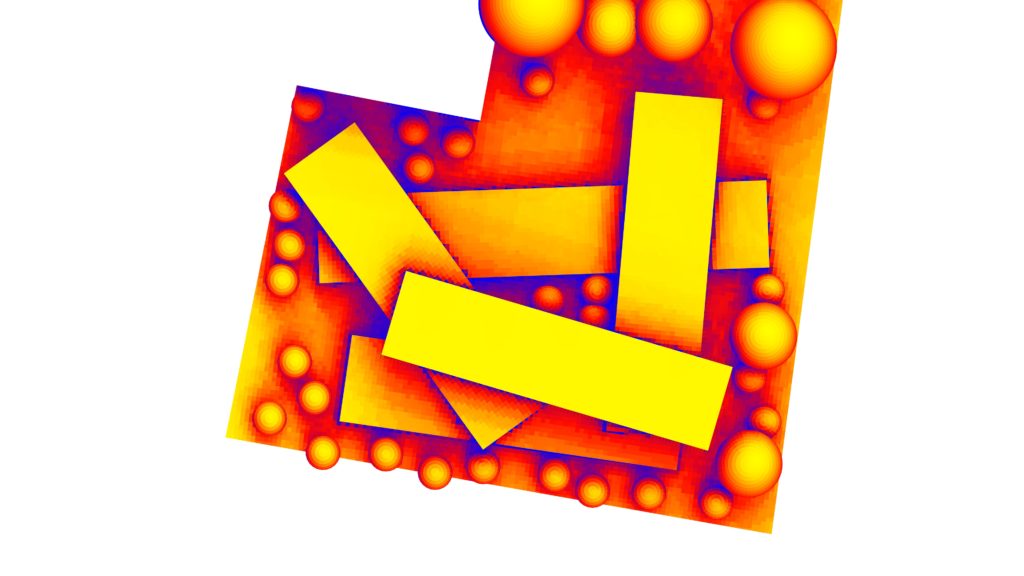
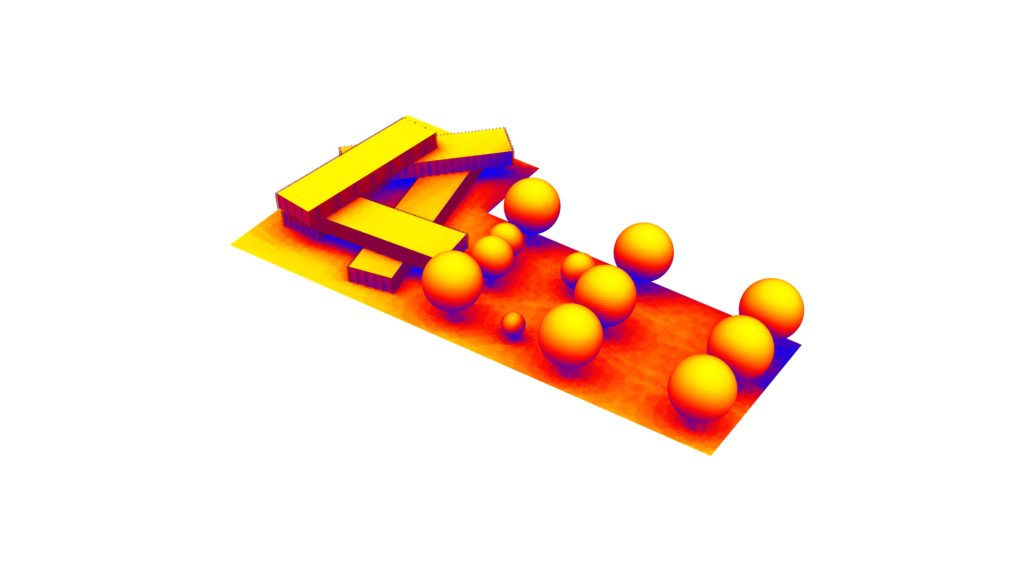
A solar radiation analysis will be used in this session. The performance of the project was visualized using a simulation without any changes being made to the project. Based on this first analysis, we can conclude that trees are needed to reduce solar radiation on the site so that a portion of the site can be utilized.
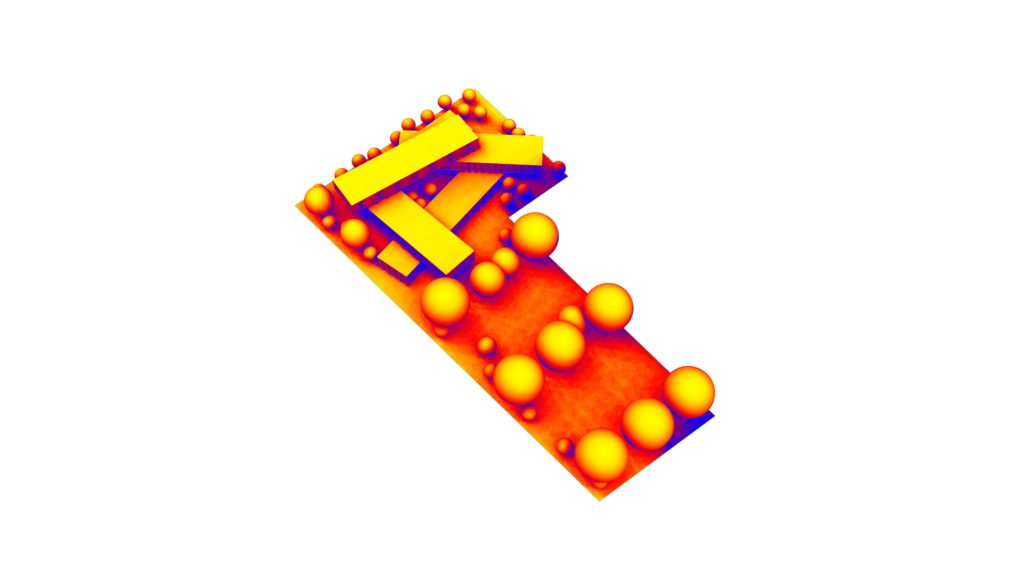
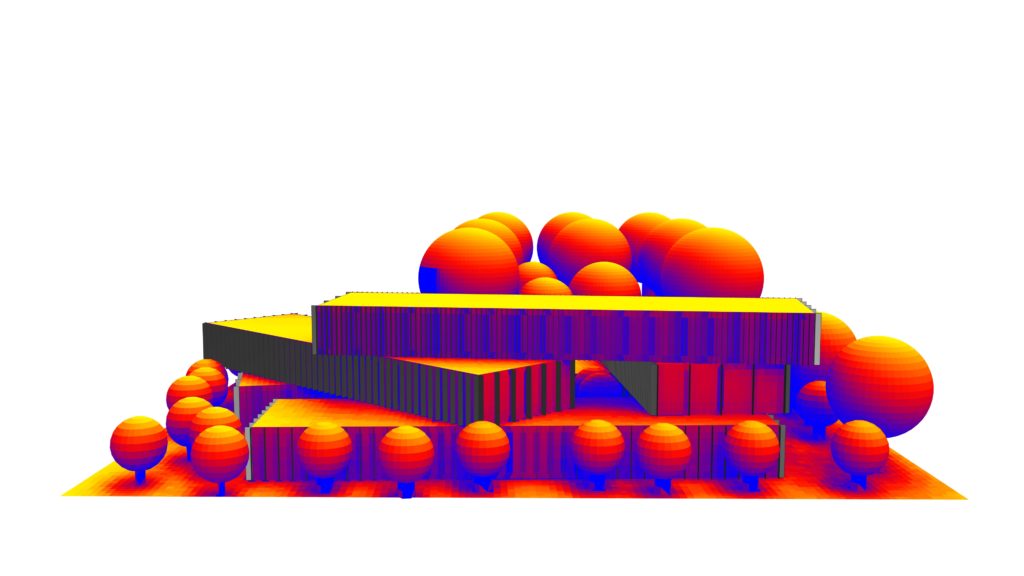
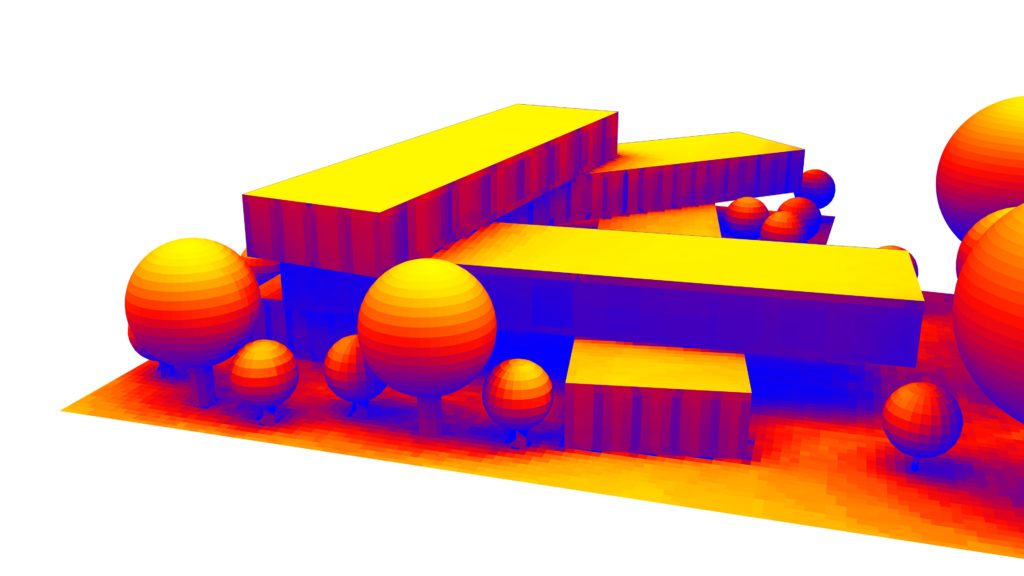
As a result of this first input, the building mass has been moved in every direction using the Galapagos evolutionary solver. This helped to find the optimal performance position for the building.

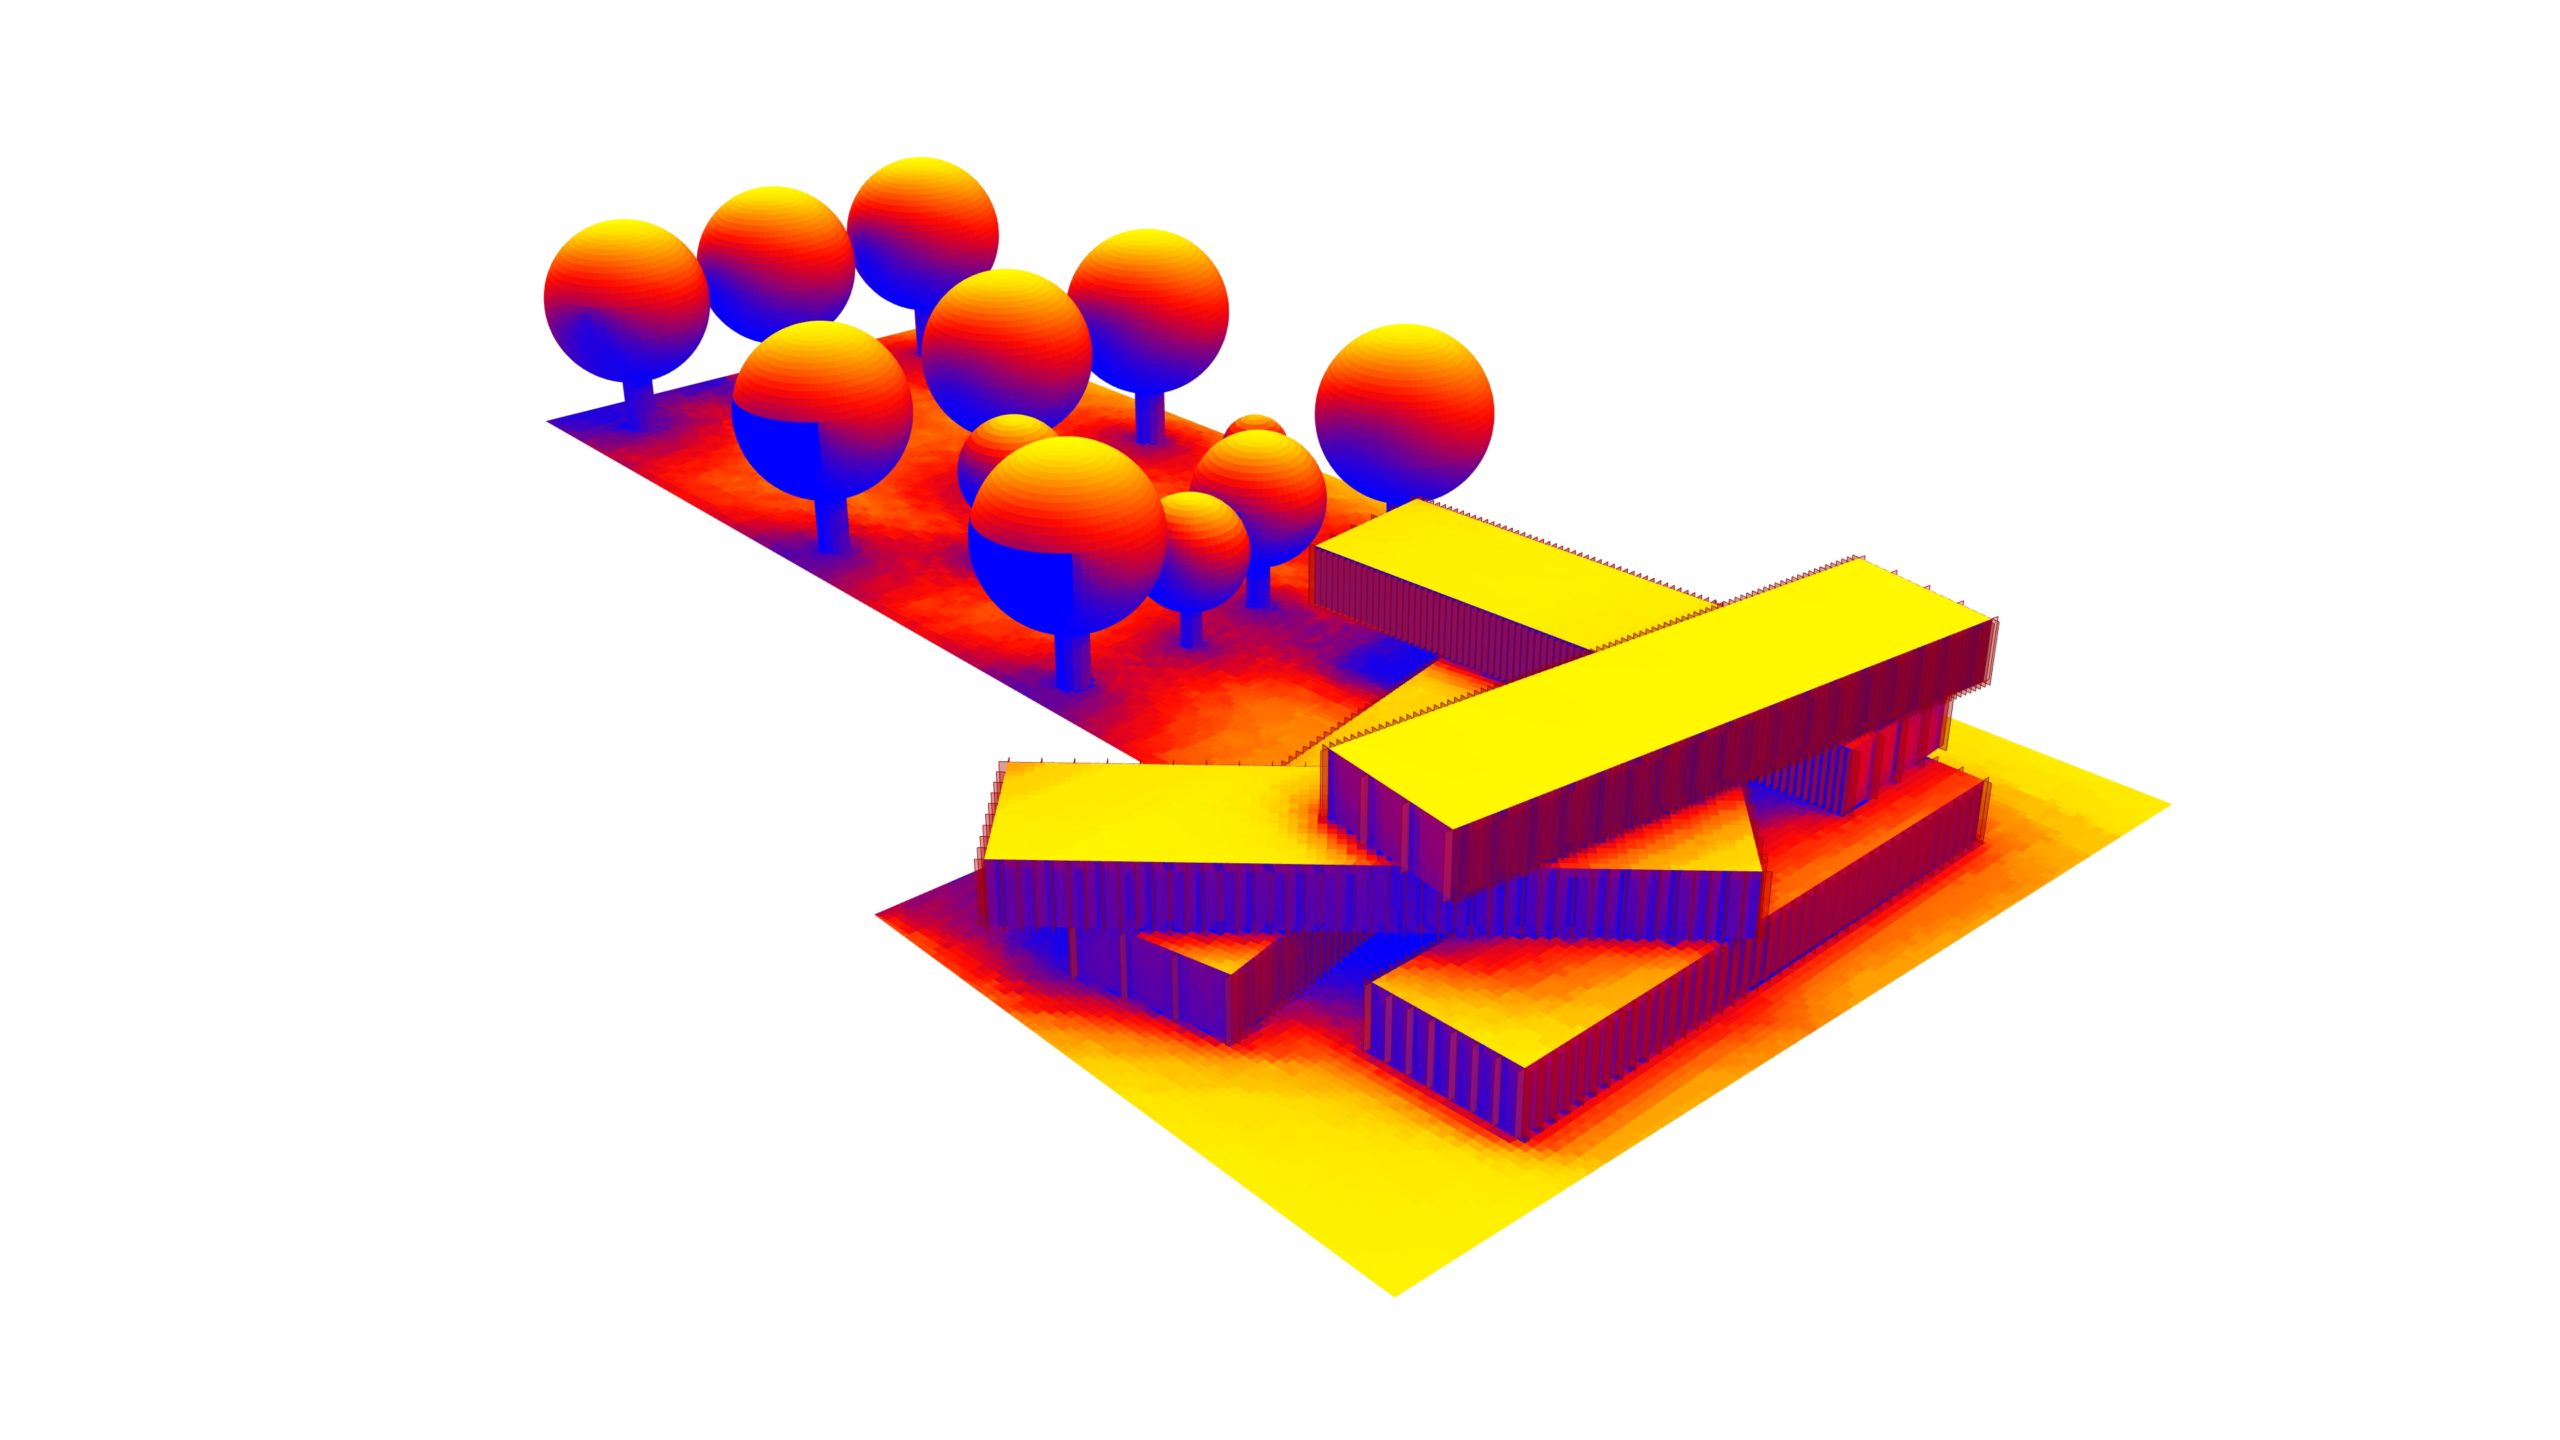
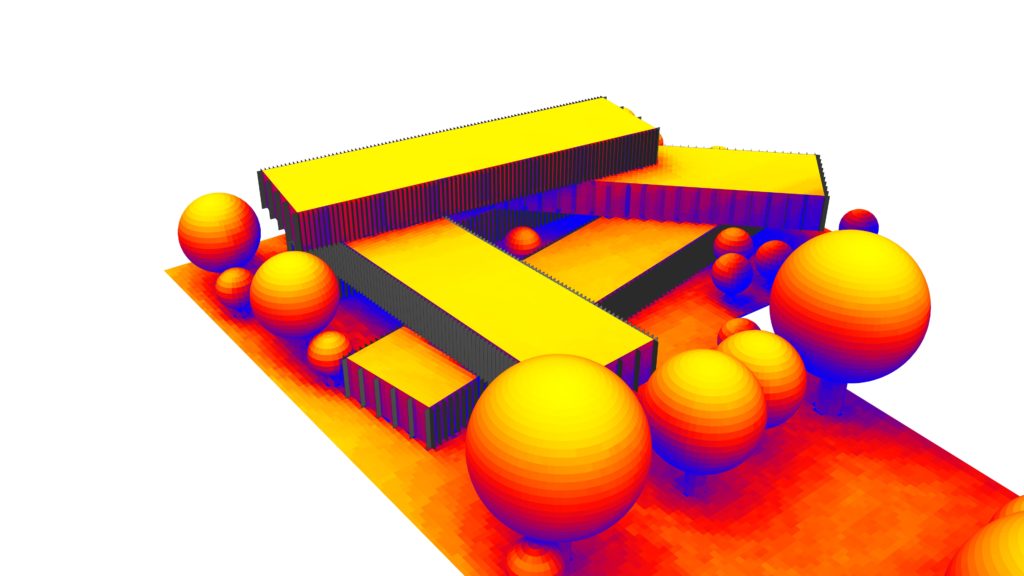
When the building itself was analyzed, it was clear that it also needed intervention. Shaders were installed on the facade to reduce solar radiation and improve thermal comfort inside.
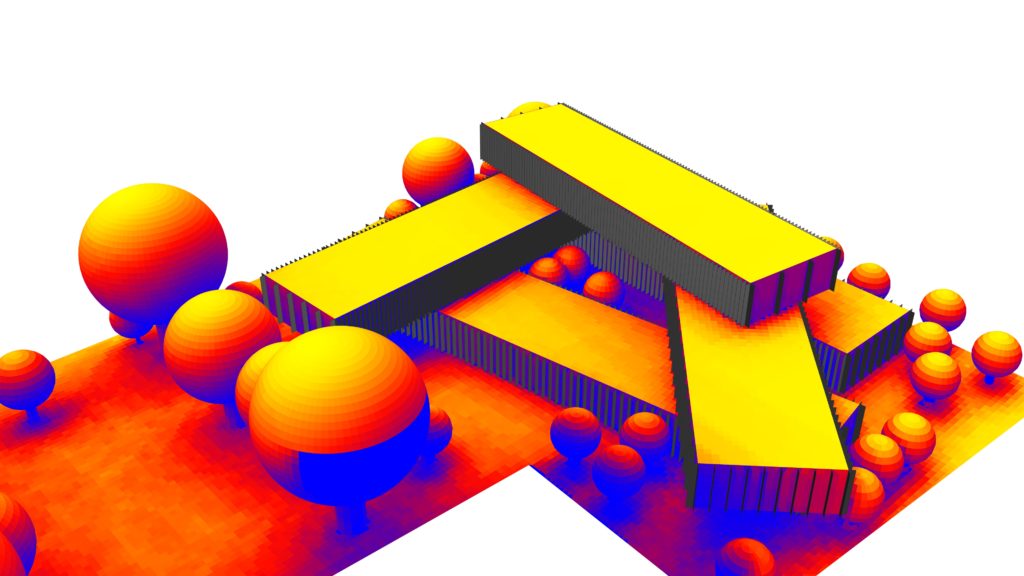
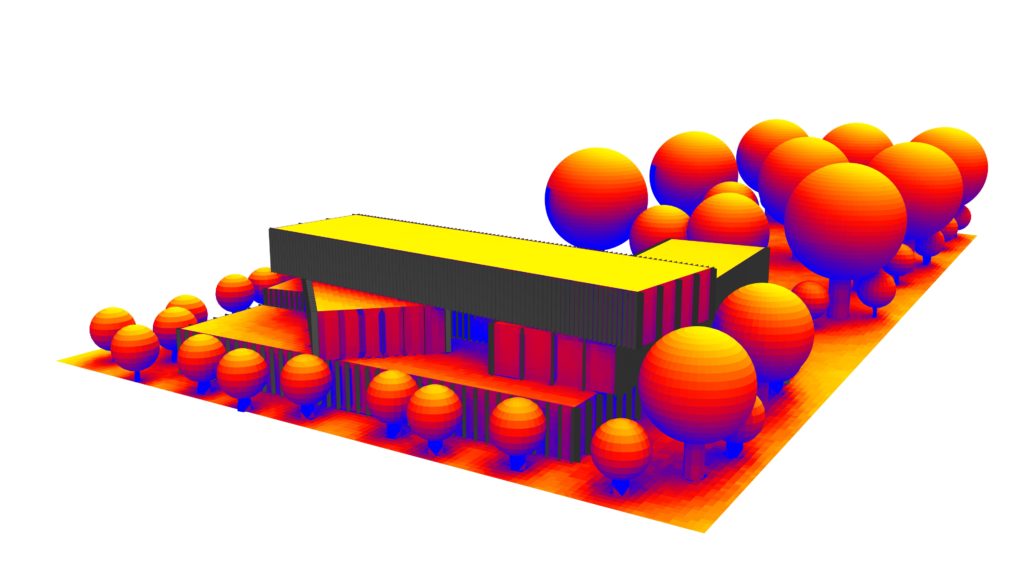
I used this simulation to test the structure of the building and the performance of trees on the site. The location of the elements (trees and building) was critical to the success of the project. The final massing of the building was able to contribute aesthetic value to the building as well as enhance the perception of what a school should look like.


Wind & CFD
This is by far the slowest simulation I’ve ever run. In this session optimizing resources in terms of computing power was critical for the analysis.
In order to increase computing power, I first reduced building details. To test the GH script, several simulations were created with a high mesh value. As soon as the simulation gave me some results, I reduced the mesh and reran the simulation to see a more detailed analysis.
It is quite interesting to find out that the massing of the building can induce wind in certain areas of the architectural program. Wind penetration was improved by moving the massing in the wind’s direction, and trees were added to reduce wind speed.
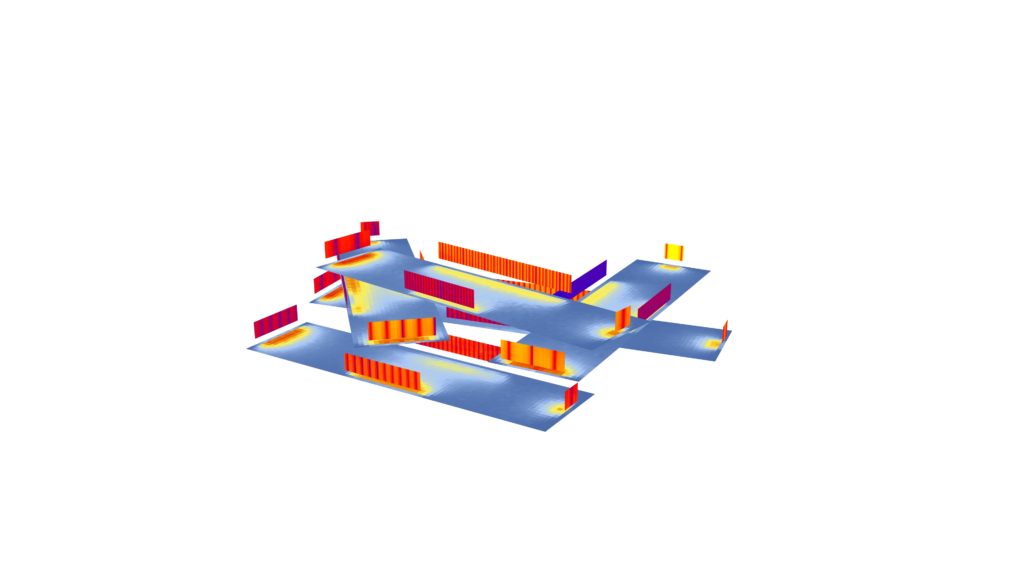
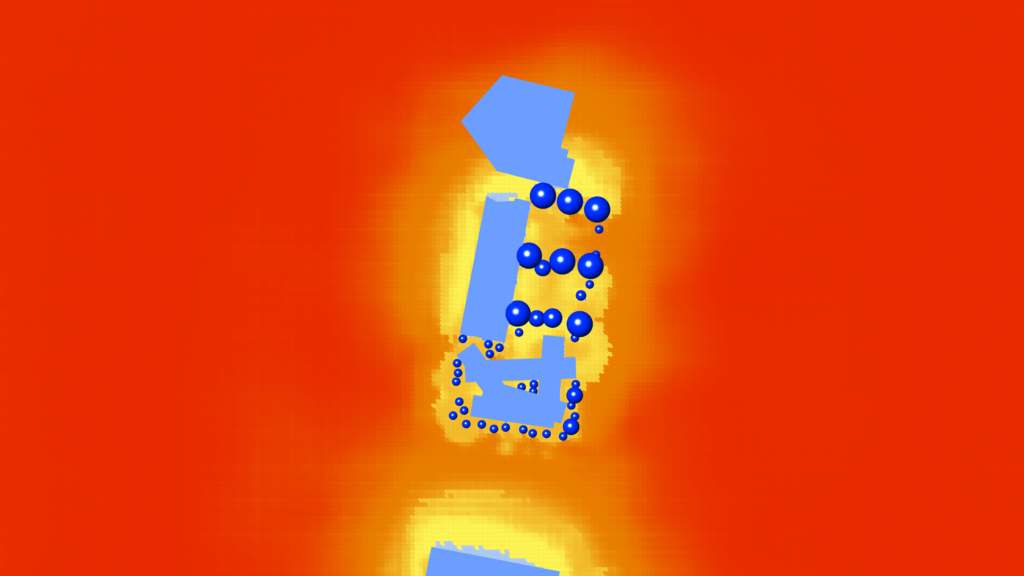
In this image we can observe the pressure of the wind simulation drastically reduce just by interacting with the building massing.
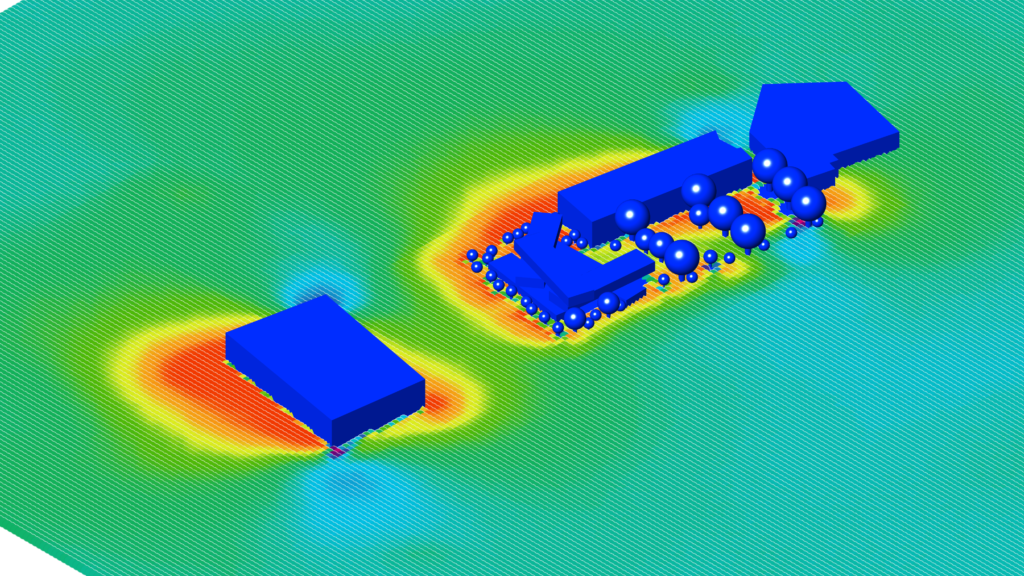
Also in this analysis we can visually see that some turbulence is being created because of the position of the building.

To reduce this turbulent flow, trees will be placed and the building will rotate. Because of computer resources, there was no time to rerun the simulation (this one took 24 hours to calculate). This type of simulation, however, can demonstrate the wind pattern, which helps to improve wind penetration through the project.
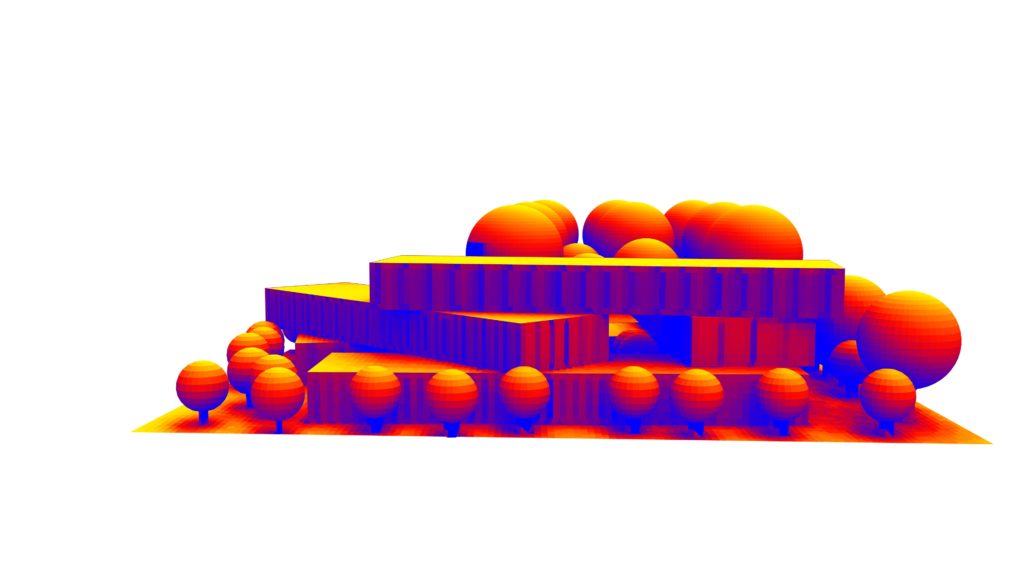
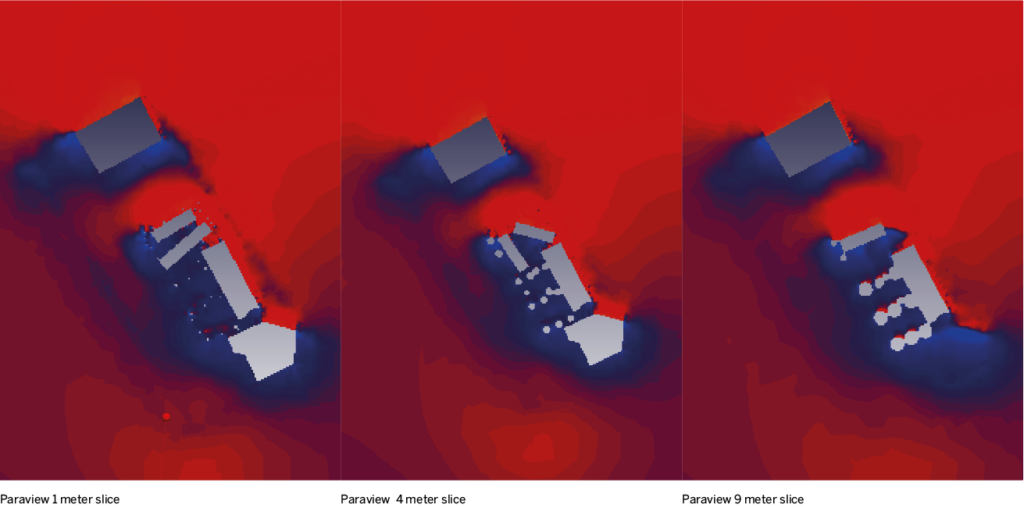
In order to relocate the building, I create a definition. Based on that data set, the program displayed a specific location for the project. I then conducted a second analysis of the building’s radiation to determine how to reduce total radiation. The results showed me that I needed to rotate the building in a very specific direction. Additionally, the amount of daylight entering the interior was analyzed. Using this type of data, I was able to create window patterns that would increase interior comfort.
This type of window pattern could also improve wind penetration. In the summer, it is important to understand how the wind interacts with the building.
InFraReR
This is one of the most impressive tools of them all. The webpage UI is really simple and that’s a helpful thing for us beginners in this world of environmental analysis. It’s a really impressive app in terms of computational power, but the data can be incomplete and pretty limited in some cases, so GH provided me with the capability of modeling the context, the actual site and the building volume, something I couldn’t do on the web page.


In comparison with the other simulations, this one is pretty close. I couldn’t tell which was which.
Conclusions
The first step to creating an eco-friendly building is understanding the local climate, and this tool is a must for every architect. To create this type of analysis, a lot of computer power is required, so there are other types of strategies that I used. For a faster simulation, sometimes the resolution of the design must be quite low. It is crucial to develop the skill of trading Resolution / Accuracy / Time.
The total site radiation was reduced with this missing parameter, but there is still room for improvement. In order to improve the radiation performance and wind simulation, I will iterate more. This study generated very few samples due to computer power constraints, and I plan to continue developing it.
