Project by Saad Khan and Sai Mohan Satwik
Introduction- Evolution
In nature, evolution is the quiet engineer — iterating lifeforms through adaptation, selection, and mutation to thrive in ever-changing environments. From the spiral of a seashell to the branching of trees, nature doesn’t design — it evolves.
Inspired by this process, computational design tools now allow us to simulate evolution in architecture. Using genetic algorithms, we can evolve building forms to better suit environmental conditions, performance goals, and spatial needs — not by manually tweaking, but by letting digital “genes” compete and improve over generations.
In this exploration, We’ve employed Grasshopper, Ladybug Tools, and Galapagos to evolve a pavilion design based on solar performance — optimizing its form to adapt to both summer shading and winter sun gain.
Much like natural selection, Galapagos acts as the evolutionary engine: testing countless design mutations, selecting the best performers, and crossing them into new generations — all while measuring solar radiation as the driving fitness goal.
The Pavilion and its analysis
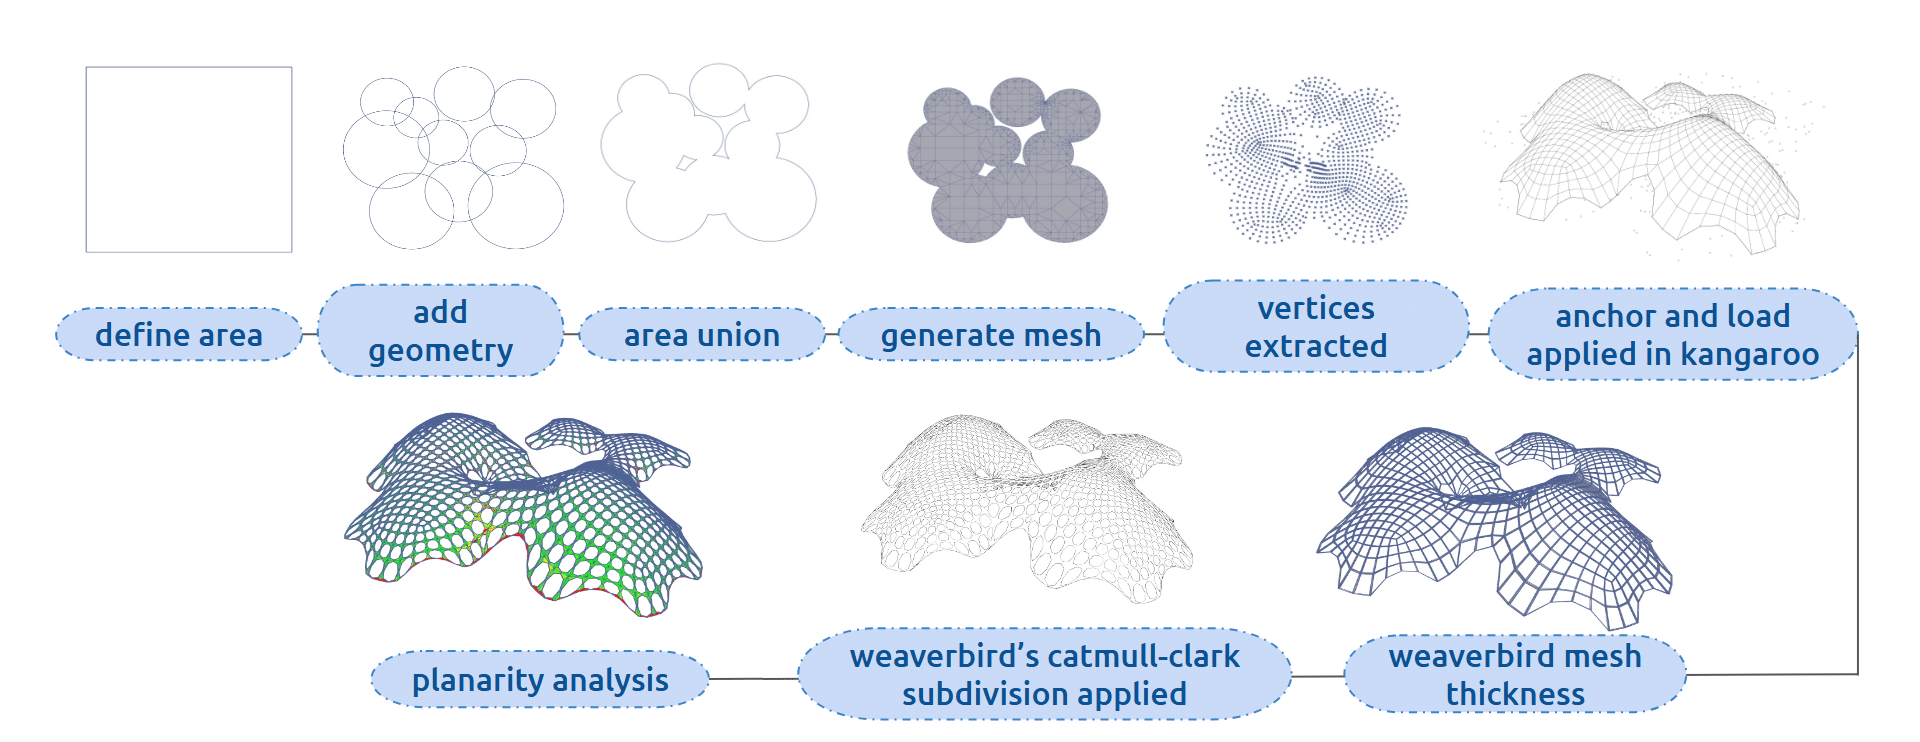
In the previous term the task was to design a pavilion using mesh and kangaroo physics. From there the wire-mesh was thickened to become a pavilion with openings. However, it could be made better, optimized to perform better, undergo an evolution. We used Ladybug solar analysis to observe the incident radiation/ solar exposure of the pavilion on the site base, as well as the maximum and minimum solar radiations hitting on the pavilion surface. From there, openings will be determined to allow maximum sun in winters and minimum sun during the summers.

Pseudo-code – Pavilion, Ladybug and Galapagos
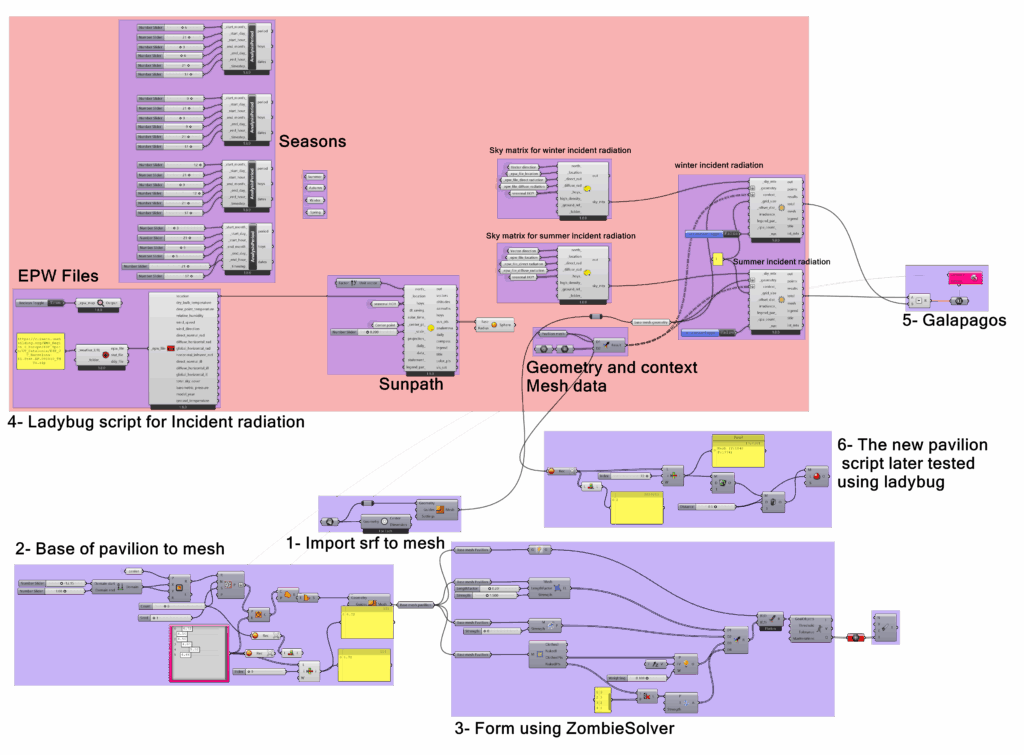
A roadmap was made to get results of the pavilion’s optimization. In the original script of the pavilion, genepool was used to randomize the radii of the pavilion , which will then be merged to form a base. Zombie solver was used to replace kangaroo to automatically get the form of the pavilion.
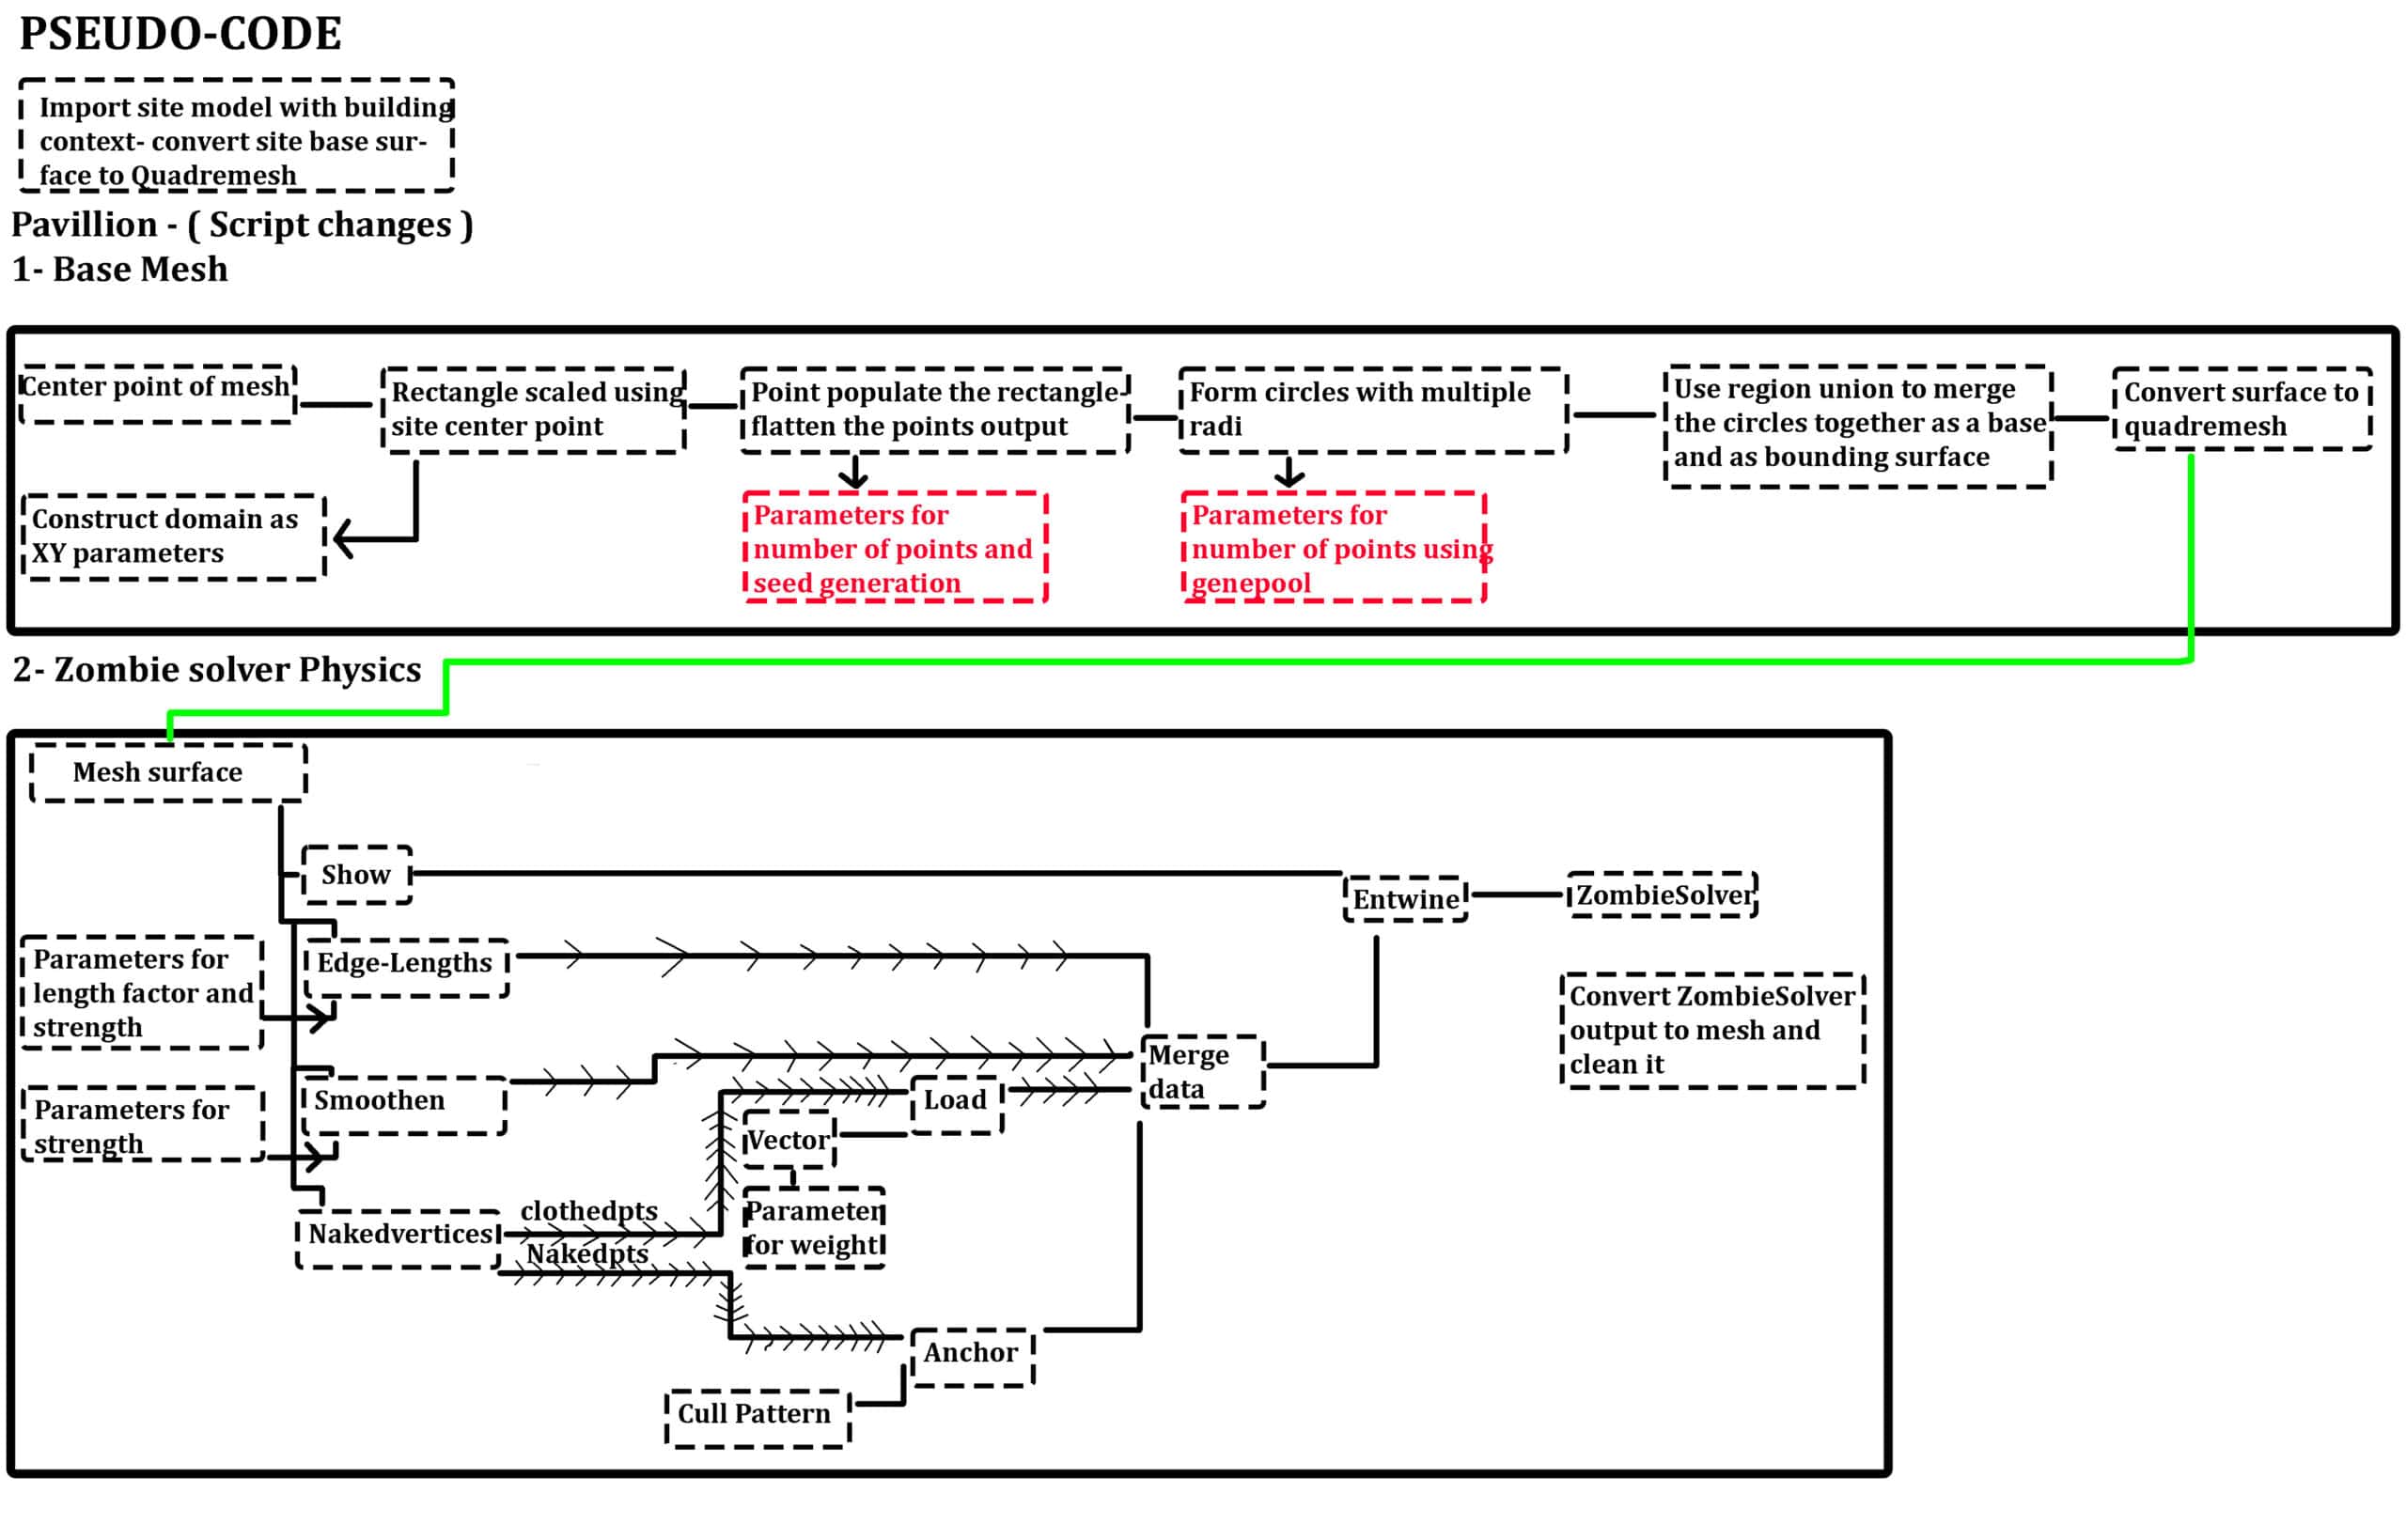
The pseudo code above is part one on the minor tweaks in the script before moving forward. In the red, are the two parameters that will the the genepool input of the Galapagos component.
For Ladybug script, the pavilion was converted to mesh acting as context geometry along with the site buildings to visualize the radiation analysis of the base site, which is the target geometry.
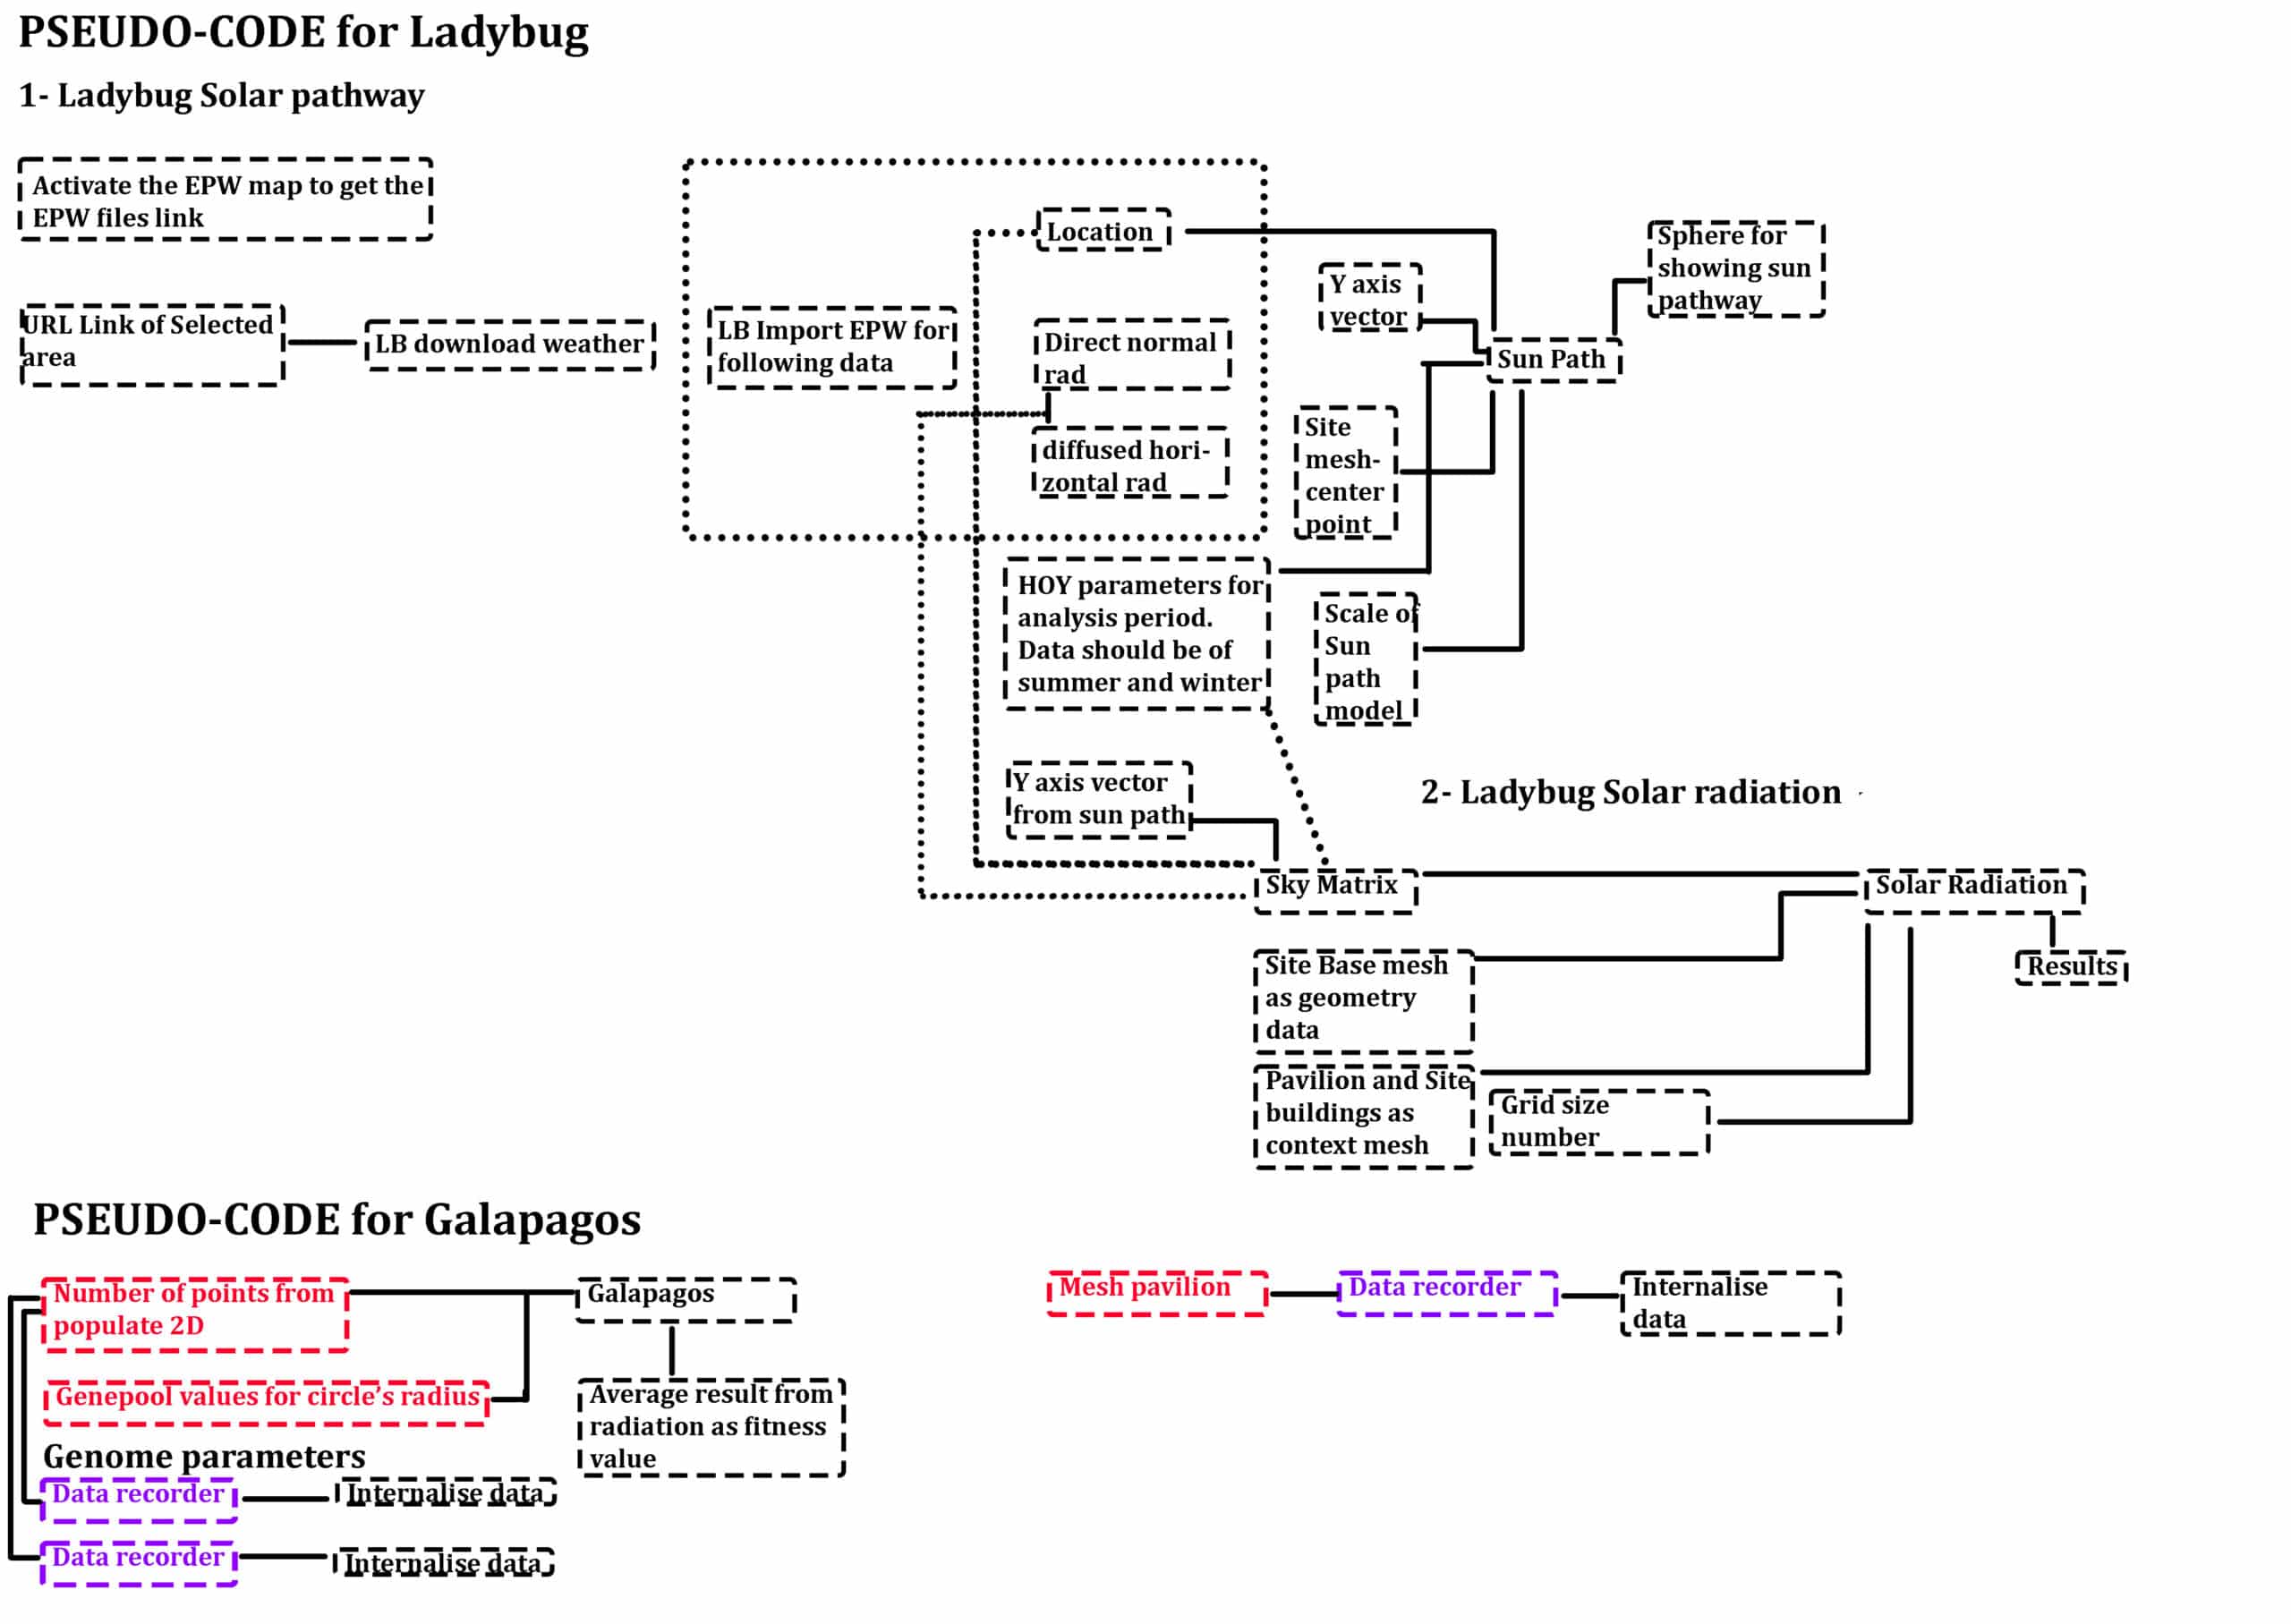
The most critical detail to remember is to connect data recorder to your genepool parameters and your mesh, so that you can then visualize a series of models which are considered as “mistakes” generated from Galapagos in order to get the final optimized model. The optimized model will then undergo ladybug analysis.
Ladybug Summer and winter radiation analysis
The script was specifically set up for summer and winter analysis. The key aim was to determine the openings of the optimized pavilion where there will be less summer sunlight and more entry for winter sunlight. After orienting the site to the north the analysis was performed.
In order for Galapagos component to optimize the pavilion, it needs an average value as a fitness number. The fact that summer and winter radiations were both different, the two average values were subtracted from each other and that value was the an input for Galapagos. The genome input would come from the parameters of the pavilion that control the base design.
Galapagos optimization
After feeding the data to Galapagos component, initiated the solver. Below shows the graph of the amount of possibilities/ design iterations which are actually considered as “mistakes” in order to optimize and improve the pavilion’s forms to restrict summer sun and allow winter sun in.
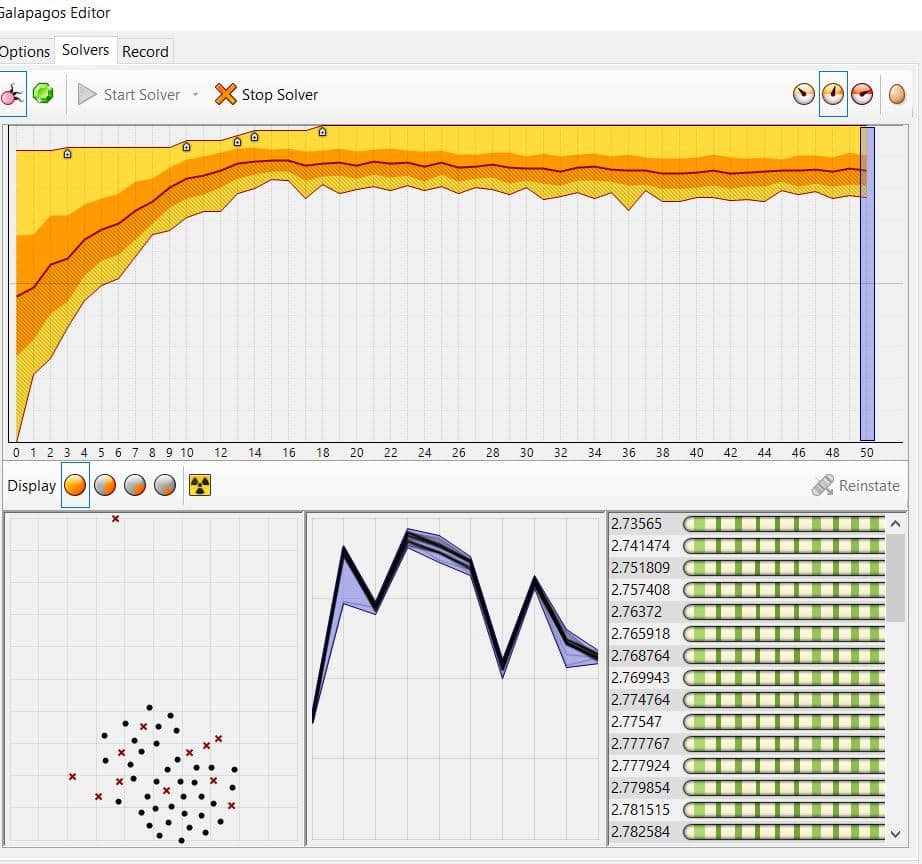
The growing chart here shows four types of data.
Top Graph (Fitness Over Generations)
This is the evolution chart — it shows how the fitness score (your objective value) changes over generations:
- X-axis: Generation number (0–50 in your case).
- Y-axis: Fitness value (lower is better, if minimizing).
- Colored bands: Spread (range) of fitness scores in each generation:
- Darker bands = higher concentration of similar fitness values.
- The black curve = best fitness per generation.
- This helps you see how quickly the population is converging toward optimal values.
Bottom Left Panel (Genome Distribution Plot)
This plot shows the distribution of individuals (solutions) in genome space:
- Black dots: Current generation individuals.
- Red Xs: Invalid solutions (e.g., due to geometry errors or failed simulations).
- This tells you how diverse the current population is — whether it’s widely spread or clustered.
Bottom Center Panel (Fitness Landscape)
This graph shows the fitness values for each individual in the current generation:
- Each point/line represents one solution’s fitness.
- Helps visualize how smooth or erratic the fitness landscape is, and whether you’re stuck in local minima.
Bottom Right Panel (Genome Values and Fitness)
This section lists:
- The fitness values of the top individuals (e.g., 2.73565, 2.74147, etc.).
- Green bars: Visual representation of each gene (slider) value that produced the result.
The Galapagos component then does a simulation of multiple parameters and a fitness module, getting out possibilities or “mistakes” to get to the desired pavilion design. The parameters of the number of points and radii of circles generated from the
Ladybug Analysis- Summer and winter
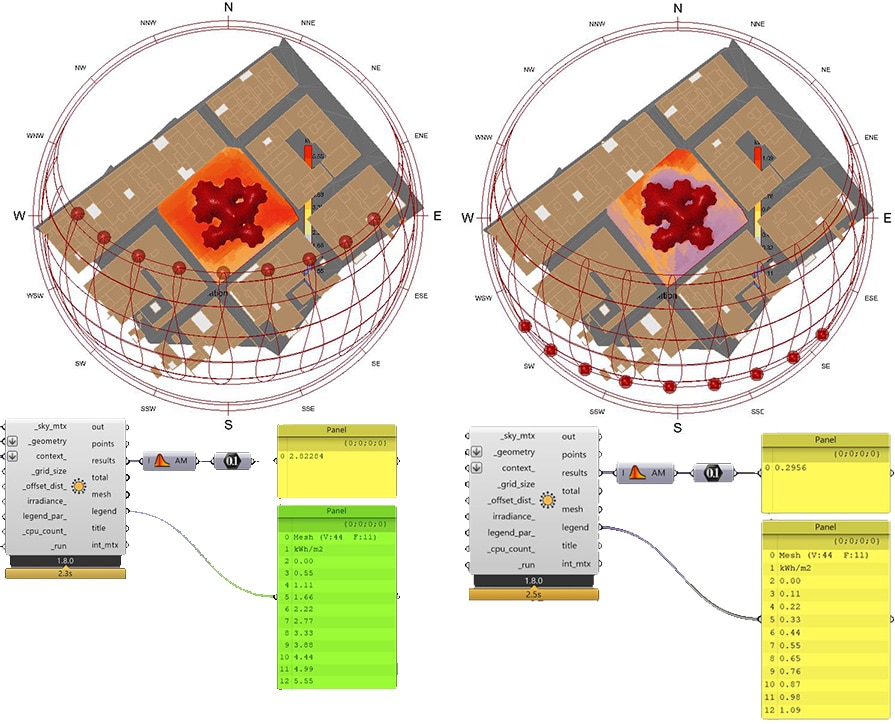
After getting the optimized pavilion , we tested the incident radiation analysis of the optimized pavilion .
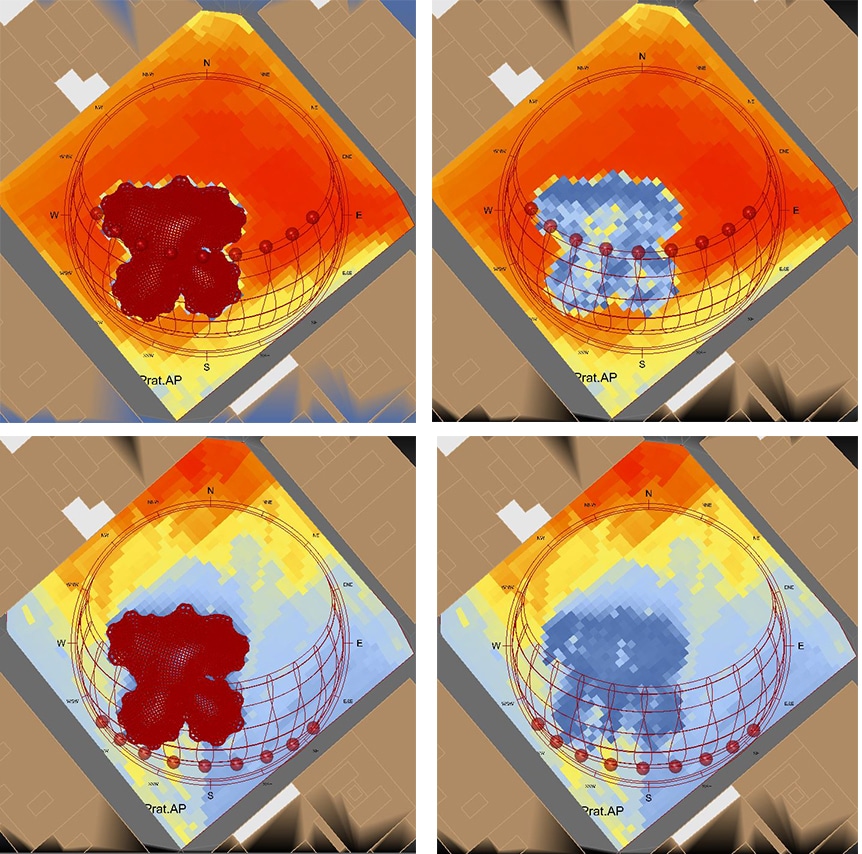
From the ladybug analysis of the optimized pavilion, we’ve come across a situation where the results covered 50% of the expectation.
The incident radiation test during the summer season shows the space is alot cooler underneath the pavilion with a mild amount of radiation entering the pavilion.
On the other hand, the pavilion is unable to allow winter sun in due to buildings’ shadows being casted. The radiation test shows that it is a lot more cooler underneath the pavilion than other areas during winter.
When it comes to the size change of the pavilion, that is due to Galapagos cross working the parameters values with the fitness value of the incident radiation of both seasons.
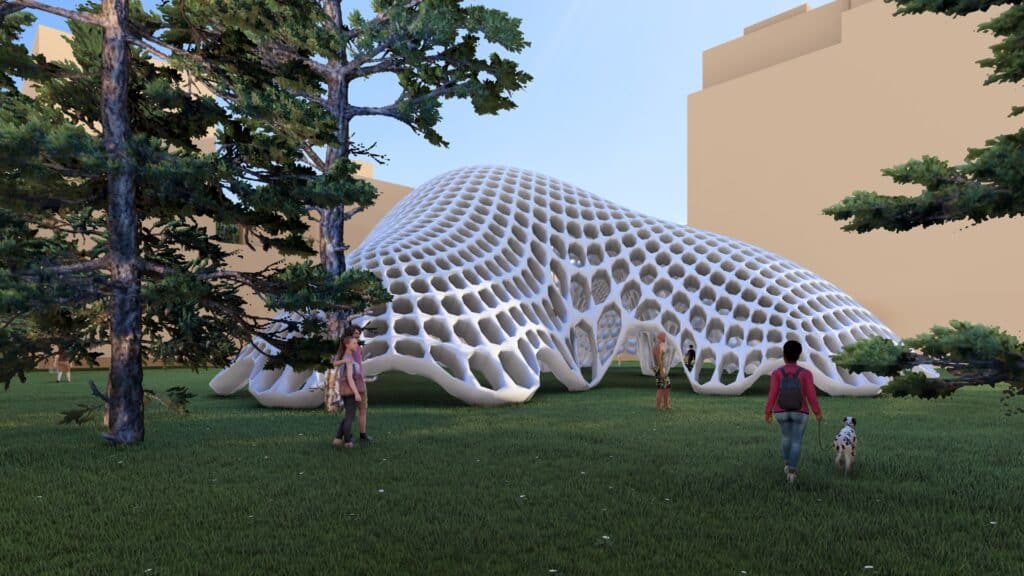
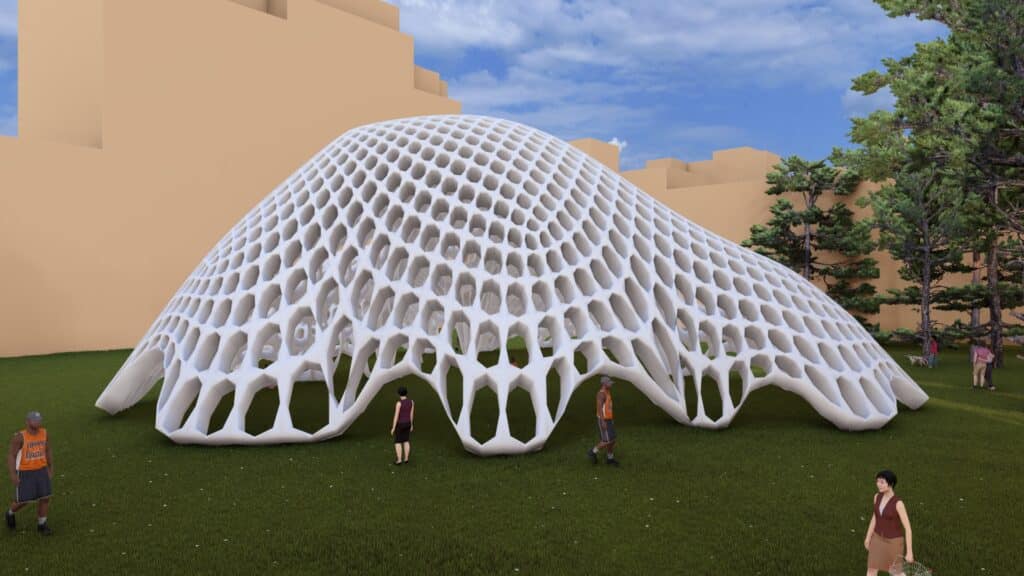
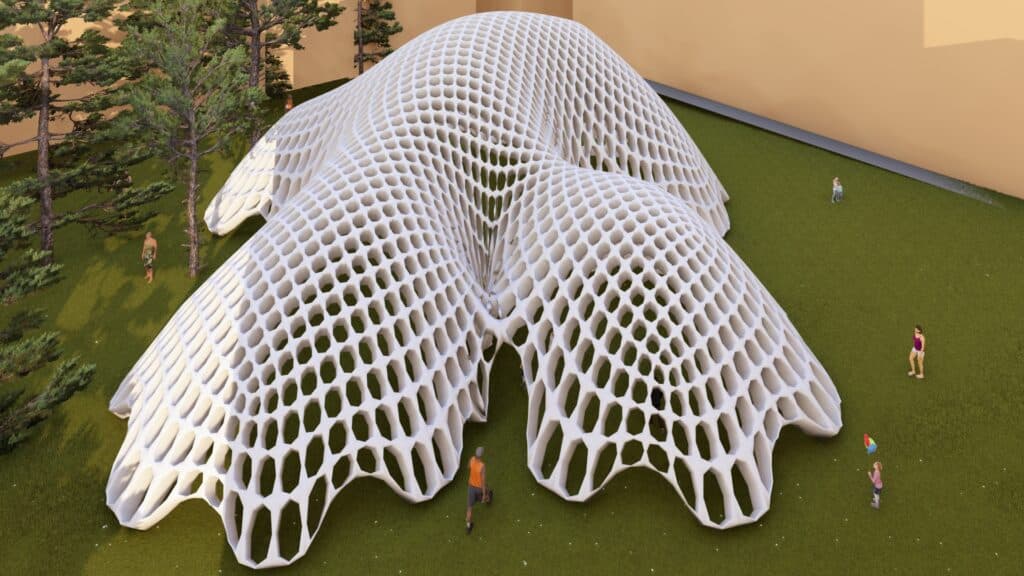
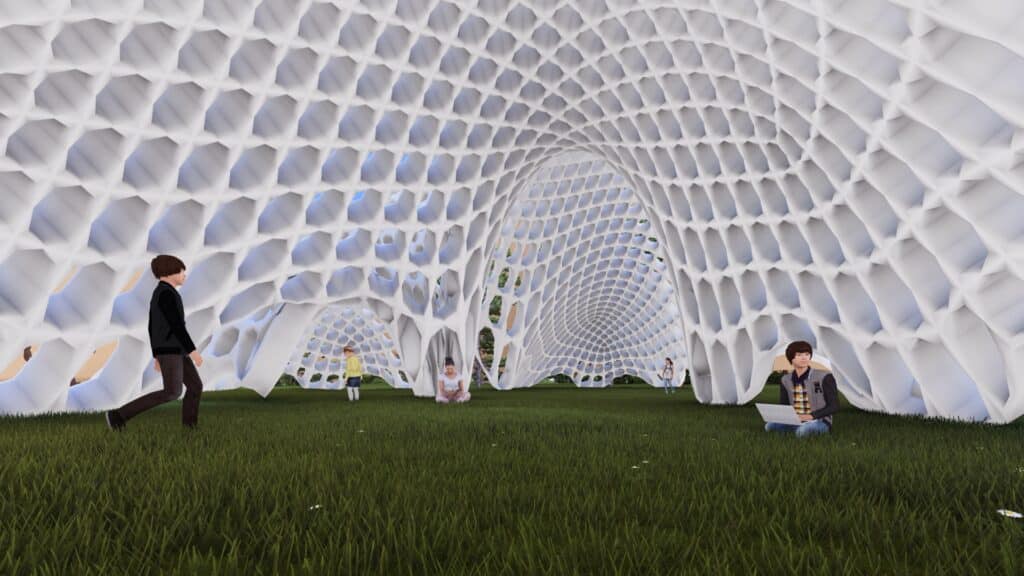
Grasshopper script
Renders