
Nestled within IAAC’s Master of Advanced Computational Design program, our recent investigation of Graph Machine Learning (Graph ML) sought to reimagine how we perceive, evaluate, and improve architectural spaces. Our team of Andrea, Leila, Lennart, and Mahnoor worked on a courtyard prototype to create a seamless process that combines parametric modeling, semantic data interchange, and AI-driven analysis.
From Grasshopper to Graph: Crafting the Data Pipeline
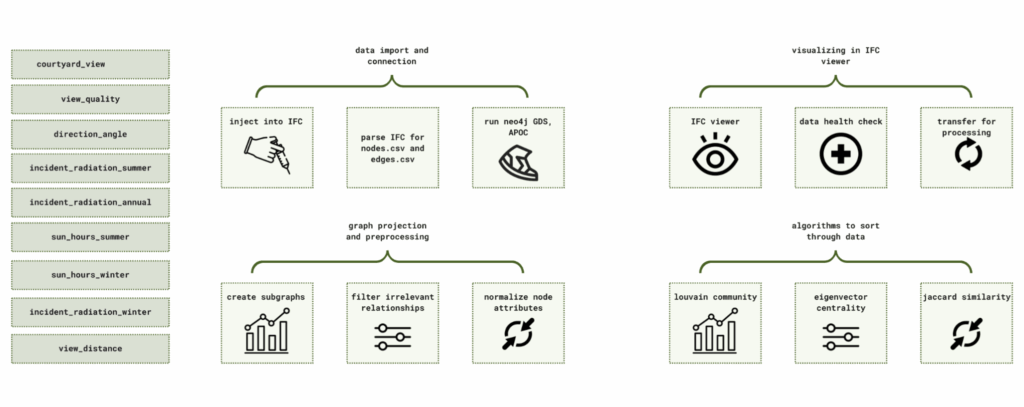
Our journey began with Grasshopper as all journeys do. By defining site dimensions entrance locations courtyard seed shape and outdoor area borders we created a modular courtyard block. This geometry and its metadata were exported to IFC laying the groundwork for a sizable networked dataset.
Then we enriched the Windows with a set of new values, in order to being able to evaluate the visual and comfort relation with the courtyard and the exterior space.
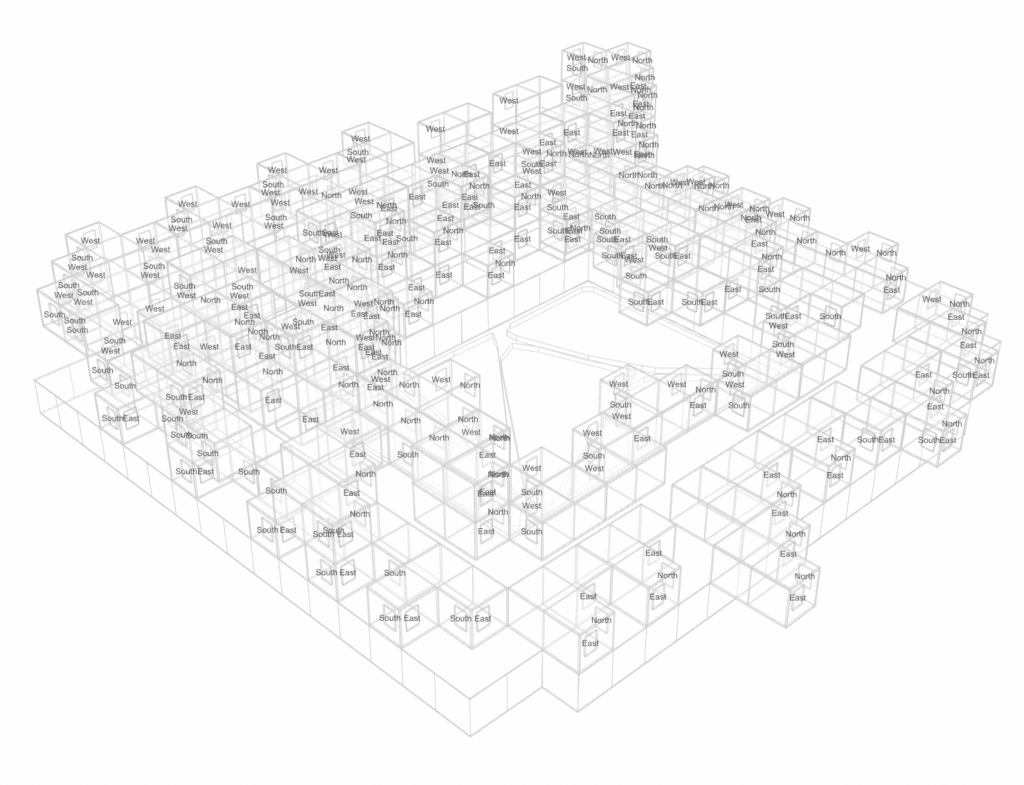
We transformed the IFC into a Neo4j graph in Google Colab. Among other components nodes consist of 89 spaces (IfcSpace) and 332 windows (IfcWindow) for a total of 2374. 2404 edges that show adjacencies visibility links and functional relationships make up the relationships. With node characteristics signifying the location orientation and environmental characteristics of each element this graph structure evolved into our living blueprint.
Decoding Communities: Unveiling Spatial Patterns
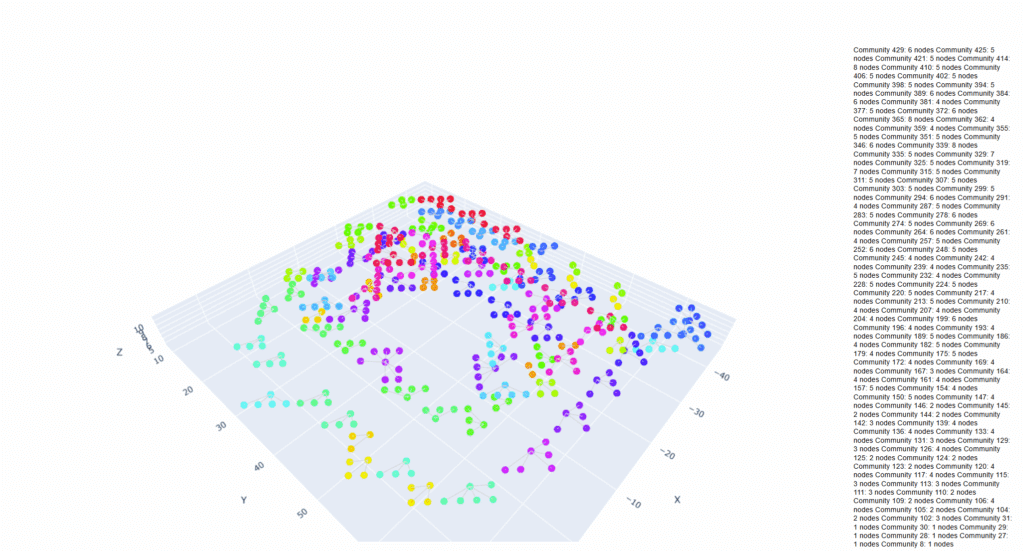
Graph MLs community detection is one of its most powerful tools. More than 100 micro-communities with a modularity score of 0. 988 were found when we used the Louvain algorithm to find clusters of interconnected spaces indicating remarkably cohesive groupings. As a fast cross-check unlabeled Label Propagation validated our community assignments by confirming major clusters. Why is this important? We can obtain specific insights for design interventions by identifying closely knit groups such as a group of apartments facing north or a set of windows with poor view quality.
Quantifying Comfort: View Quality & Sun Exposure
Key environmental metrics were quantified in addition to structure.
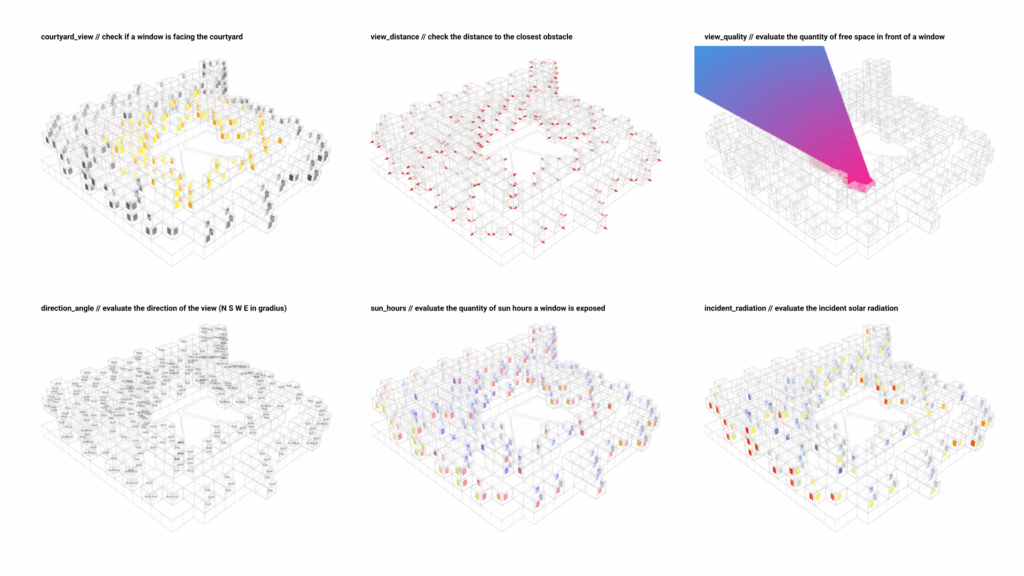
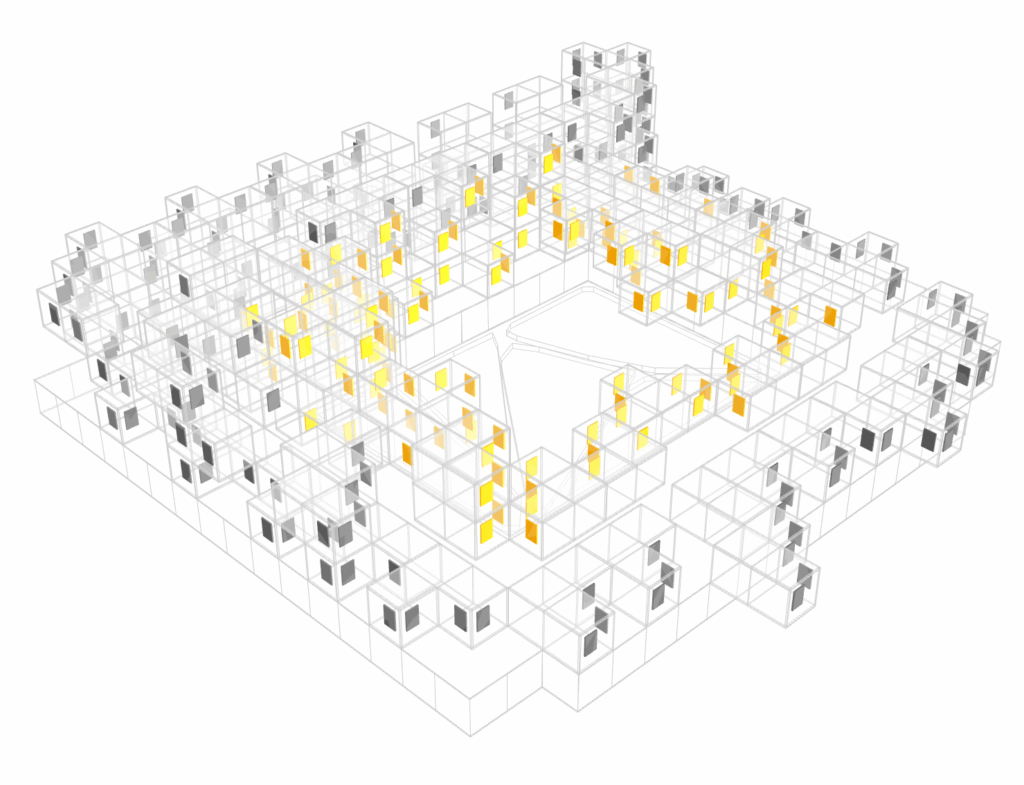
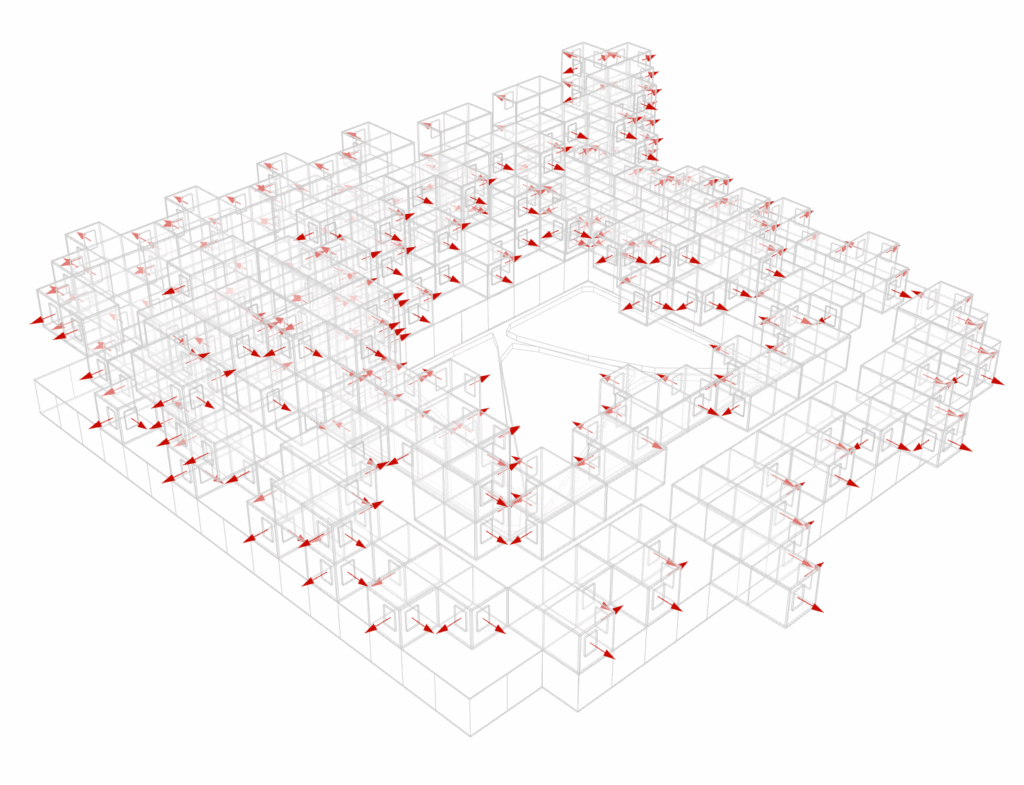
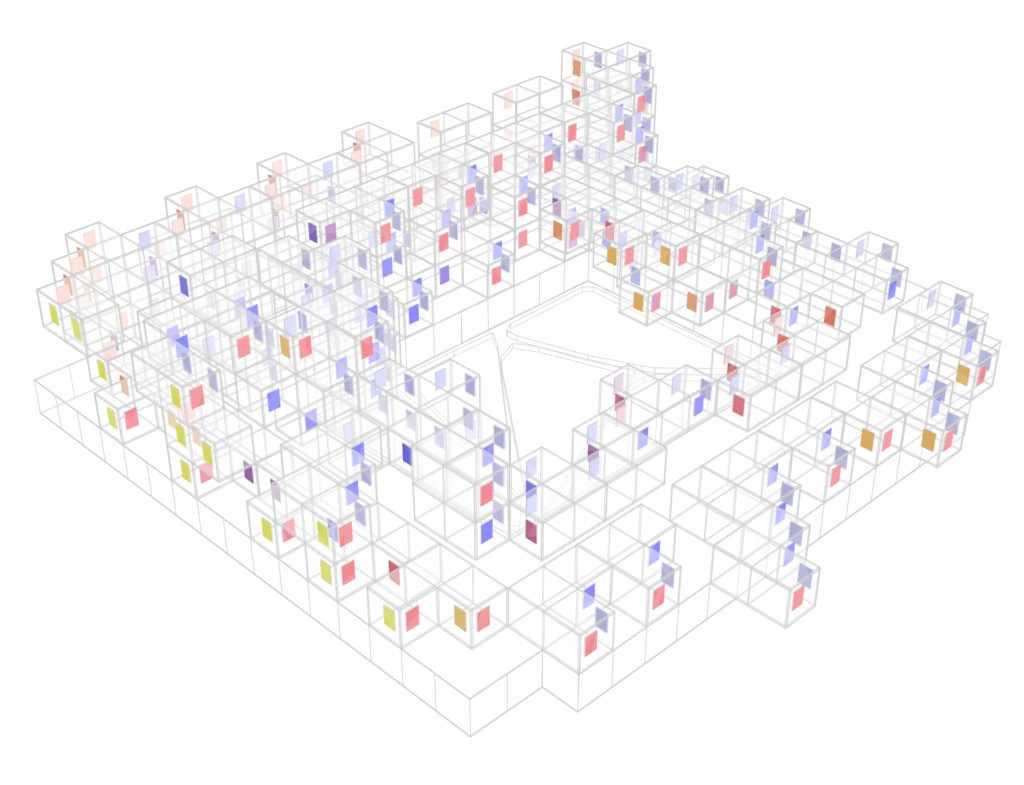
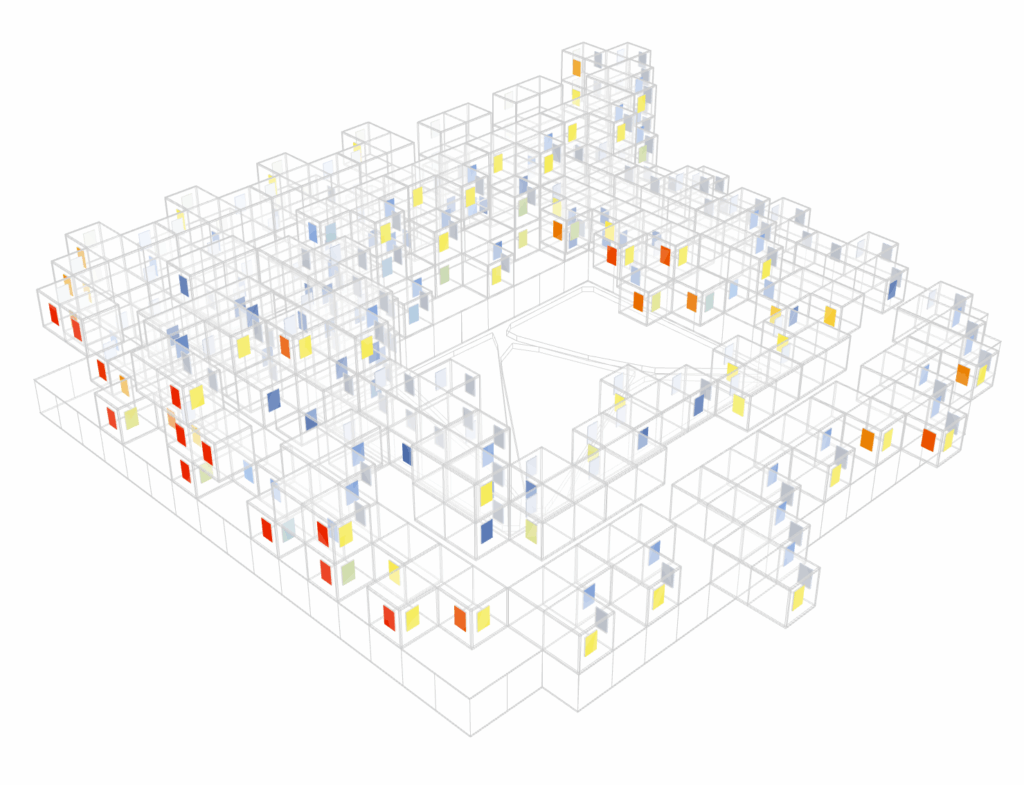
View Quality: We highlighted areas that promise visual comfort by mapping nodes from blocked to expansive based on the unobstructed view corridor for each window.
Sun Hours: Every façades exposure to sunlight was calculated using seasonal analyses (summer and winter). Passive heating or solar shading were the best options for windows that received more than seven hours of summer sunlight.
Annual Radiation: Surfaces that had the most potential for daylight harvesting or that required glare control were highlighted by the total incident radiation (in Wh/m²).
We were able to see these metrics in situ using Neo4js graph data science toolkit visualizations—red nodes for high view quality gradient maps for solar gain—which directly informed changes to the facade and courtyard planting plans.
Further insights on window properties
Closing the Loop: From Graph Insights Back to Grasshopper
Our methods iterative feedback cycle is what makes it unique. Colab insights were packaged into CSV files and then reintegrated into Grasshopper.
Filtering and Highlighting: After querying for apartments facing the courtyard with view_quality 0. 7 or spaces with 2 winter sun hours we used Rhino to dynamically color those elements.
AI Copilot Integration: Conversational queries are powered by our graph which is now an AI-ready dataset.
To see the Copilot highlight rooms in real time ask Which rooms have both north exposure and high thermal comfort? Design stays data-driven but flexible thanks to this two-way flow which combines algorithmic accuracy with human creativity.
Reflections & Next Steps
Spatial analysis has gained a new dimension thanks to graph machine learning. By considering architectural elements as network nodes, we can:
Uncover hidden spatial patterns.
Calculate the environmental performance.
Support design explorations with AI.
Looking ahead we see our graph evolving from static analysis to live digital twins by incorporating real-time sensor feeds such as temperature occupancy and air quality. Picture courtyard comfort zones that are controlled by graph machine learning and can instantly adjust to user preferences or sun paths. We hope that this exploration of courtyard-centric Graph ML will pique your interest whether youre an architect interested in parametric workflows or a computational designer keen to use AI. Ultimately the built environment becomes more intelligent responsive and infinitely more human when data and design work together.
