
Harnessing the power of drone-based photogrammetry and artificial intelligence to create a low-cost urban wildfire diagnostic tool.
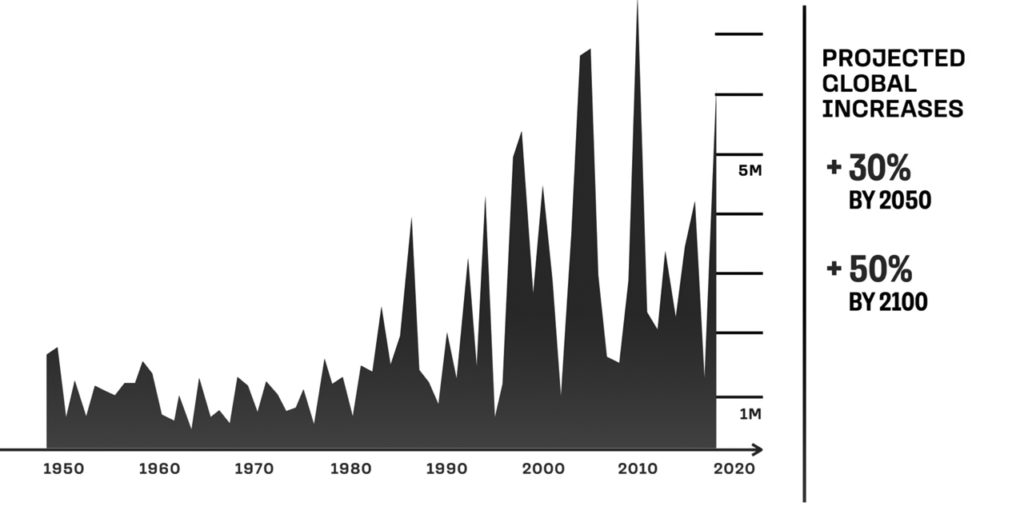
In recent years, the global community has witnessed a significant upsurge in the frequency and intensity of wildfires. Driven by a combination of climate change, urban expansion, and land-use practices, these fires have not only devastated vast natural landscapes but have also encroached upon urban environments, posing unprecedented threats to infrastructure, economies, and human lives. The confluence of increasing temperatures, prolonged droughts, and anthropogenic factors has rendered traditional fire fighting techniques and prediction models less effective, necessitating innovative approaches to address this burgeoning crisis.
Current Technologies
A synopsis of current fire risk related applications
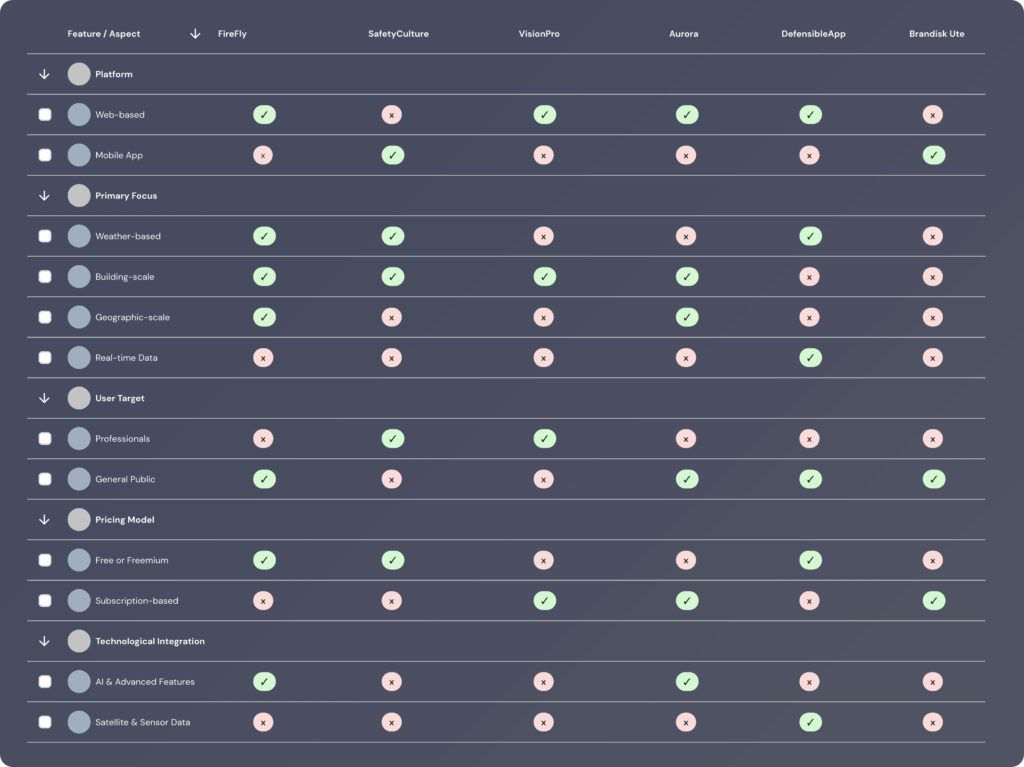
The domain of fire risk assessment has seen a surge in technological advancements, with a plethora of tools and software emerging to cater to diverse needs. These tools can be broadly categorized based on their target audience, technological sophistication, and pricing models. Here is a synopsis of the current landscape:
In the realm of fire risk assessment, professional-grade tools are paramount, designed predominantly for professionals and organizations necessitating intricate insights. These include compliance-centric platforms like SafetyCulture and Vision Pro, emphasizing regulatory alignment with features like customizable templates and audit trails. Spatial analysis tools like Aurora provide a visual and spatial understanding of risks by tagging findings to a floorplan.
Real-time monitoring tools prioritize instantaneous data, with platforms like the Defensible App utilizing satellite sensors for real-time insights into active fires and offering location-based alerts about fire bans and other relevant data based on users’ locations.
Consumer-oriented apps aim to make fire risk assessment universally accessible. Apps like Brandrisk Ute not only offer real-time fire risk updates but also educate users on fire safety, providing features like safety tips and color-coded fire danger levels. Some of these apps also offer interactive features, allowing users to share fire danger forecasts and view detailed fire safety information.
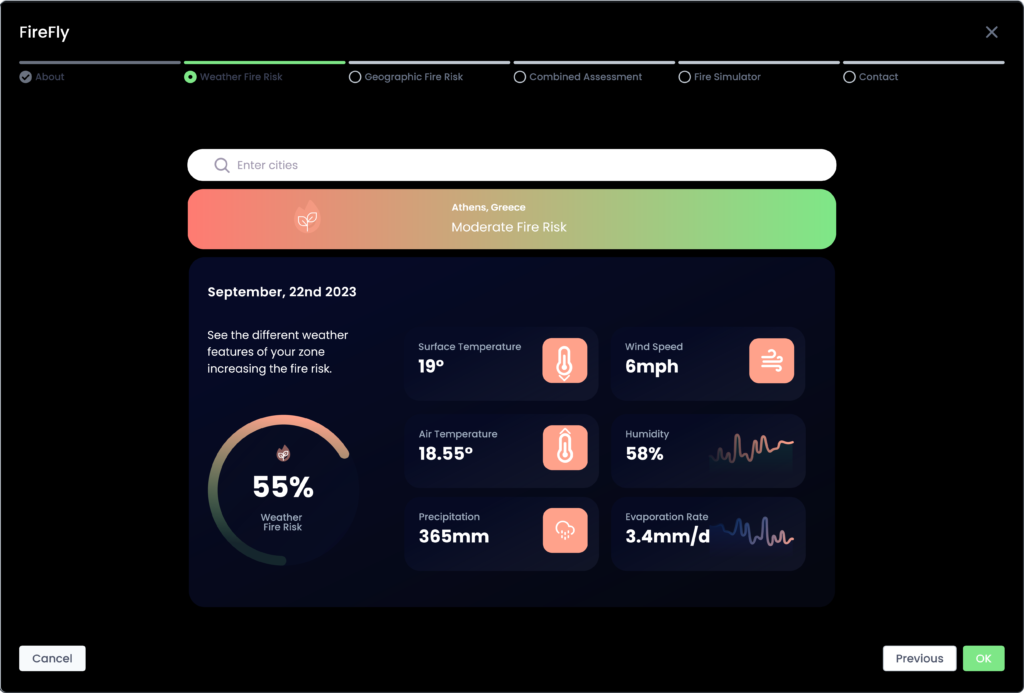
FireFly aims to bridge the gap between professional and consumer-oriented tools, leveraging AI to offer detailed insights with a user-friendly interface, making fire risk assessment accessible to all. It seeks to empower users with actionable insights combining weather data, in-depth risk analysis, and AI-driven predictions, ensuring accessibility of advanced fire risk assessment to individuals regardless of their technical expertise.
Workflow
High Level Processes Explained
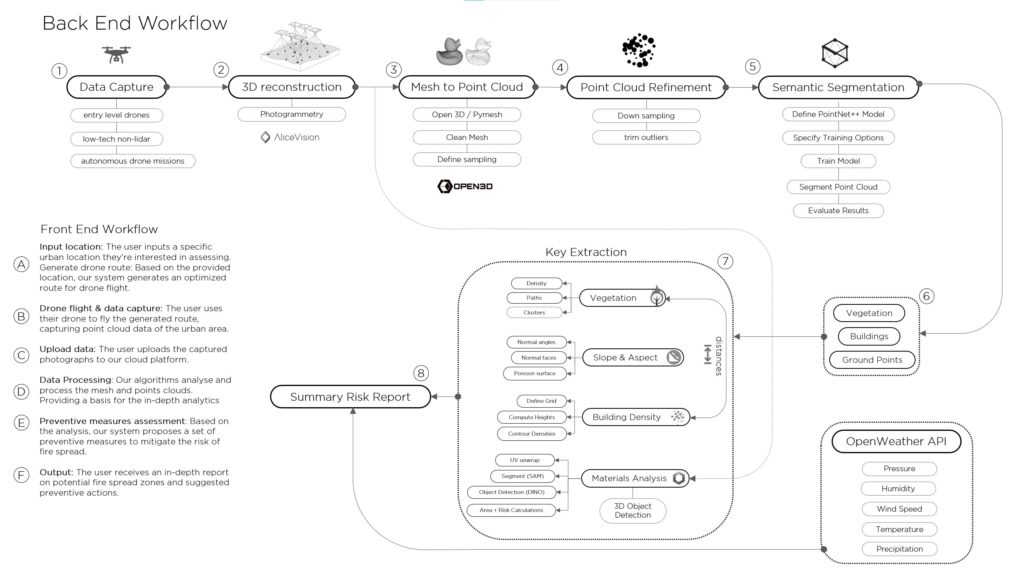
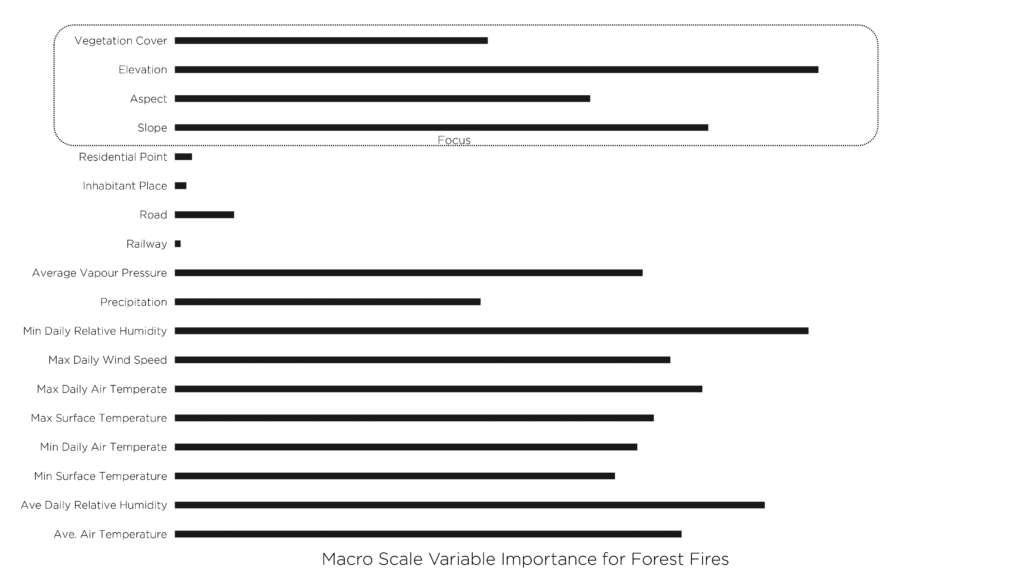
The aim of the workflow is to create an affordable and accessible tool, enhanced with AI and machine learning, focusing on back-end data processing. The metrics analyzed are based on extensive research on factors influencing fire spread, with a focus on urban scale, leaving potential for micro scale analysis in future research.
The workflow starts with data capturing, primarily through entry-level drones capturing aerial photographs for 3D reconstruction through photogrammetry. Applications like Drone Deploy automate this process, avoiding the need for heavier payloads like lidar. Drones like the DJI Mavic or DJI Air are suitable for this task.
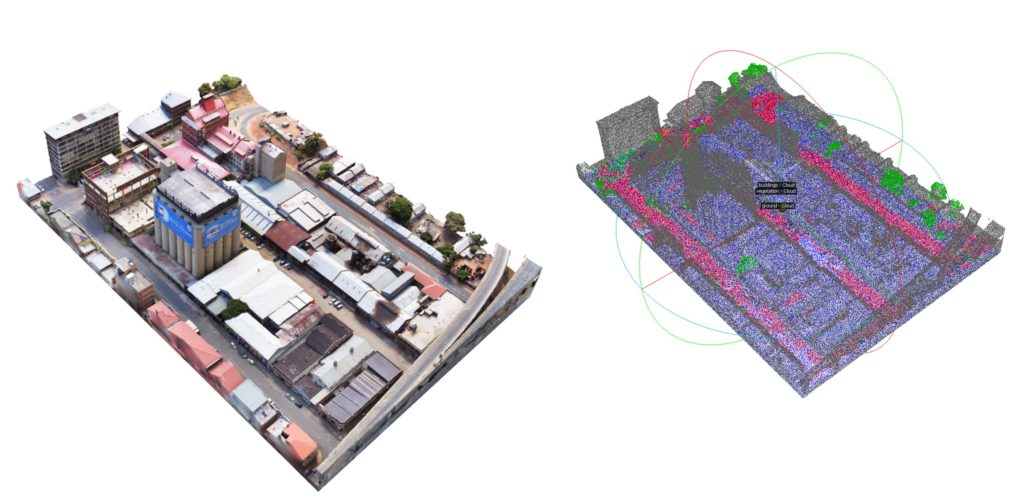
3D reconstruction is achieved using Meshroom by AliceVision, an open-source project aimed at democratizing 3D digitization technologies. Once the 3D mesh is created, it’s converted into a point cloud using the Open3D python library and surface sub-sampling, creating a detailed and representative point cloud.
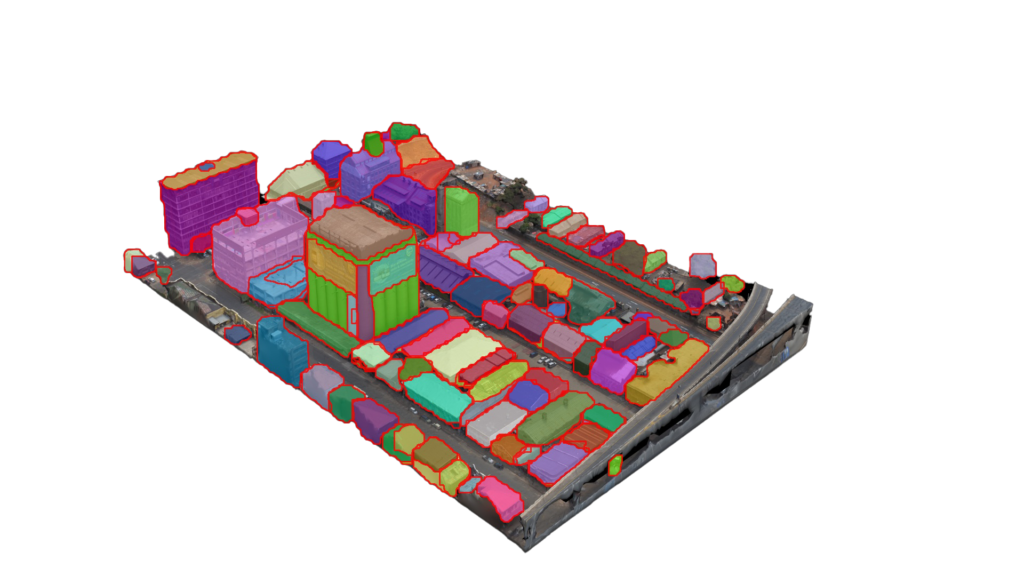
The point cloud is then automatically segmented into vegetation, buildings, and ground points using PointNet++, designed specifically for processing point cloud data. This segmented point cloud is analyzed for key metrics including fire spread through vegetation, terrain slope and aspect, and building densities and their proximity to vegetation.
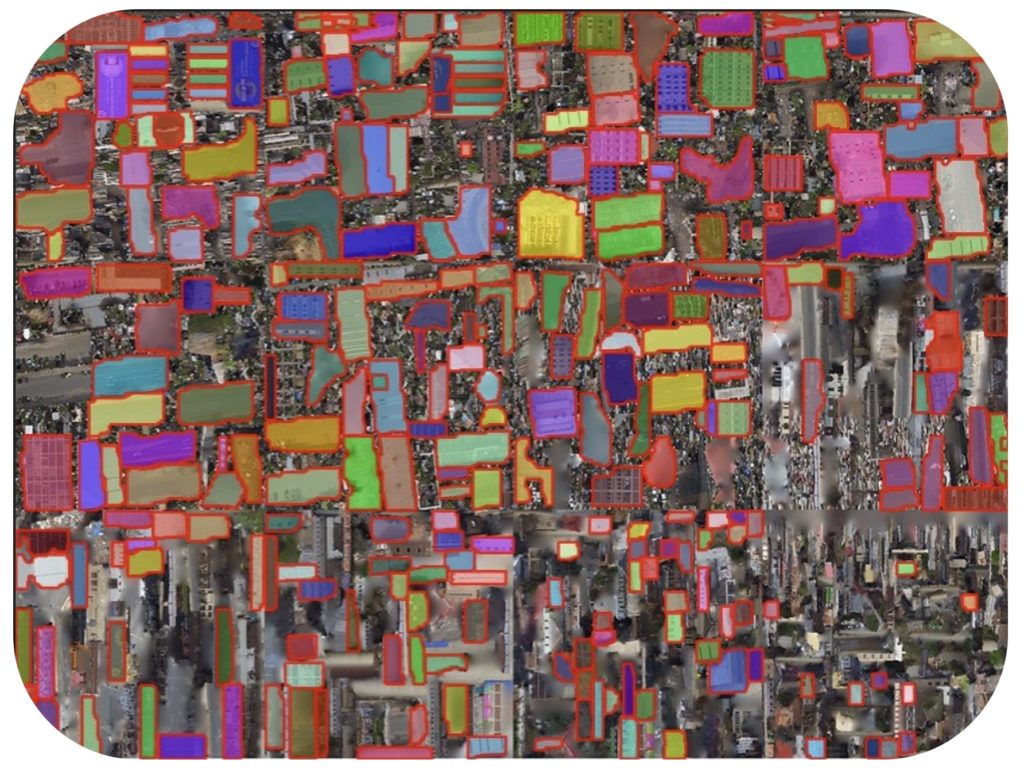
The mesh is also used for materials analysis of the built environment using unwrapped UV textures of the model, segmented by the Segment Anything Model by Meta, and materials detection is done using DINO by Meta, a self-supervised system learning representations from unlabelled data.
Finally, these metrics, along with significant weather data points, are combined to create the final summary risk report, graphically represented on an HTML interface.
Vegetative Pathways
Analysing Fire Propagation in Vegetation
Point cloud data offers a dense and detailed representation of physical environments. In areas prone to wildfires or fire hazards, understanding the spatial distribution and clustering of vegetation becomes critical. This understanding helps in proactive planning and fire risk mitigation. The provided workflow comprehensively analyses the point cloud data, focusing on vegetation, to decipher potential fire spread pathways. It proposes a novel method, which to the writers knowledge, has not previously been undertaken.
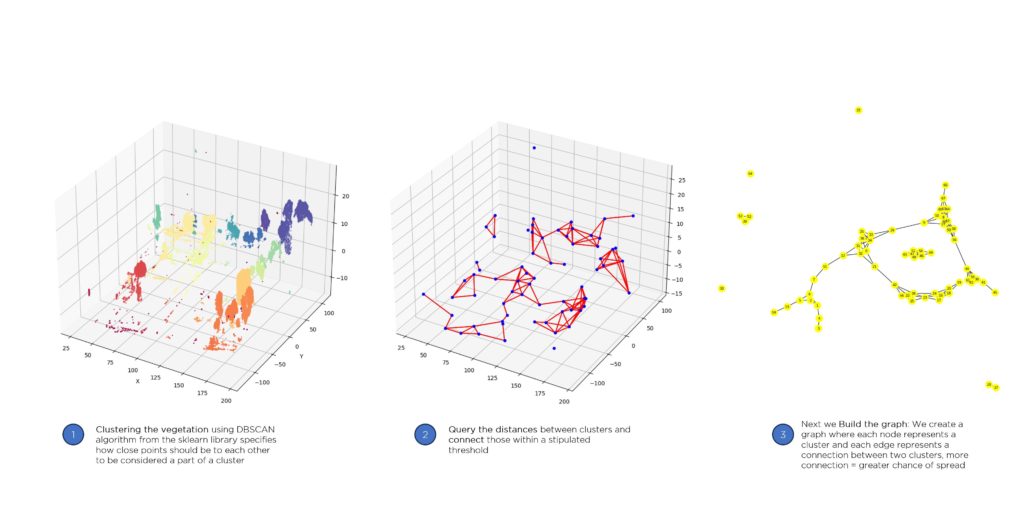
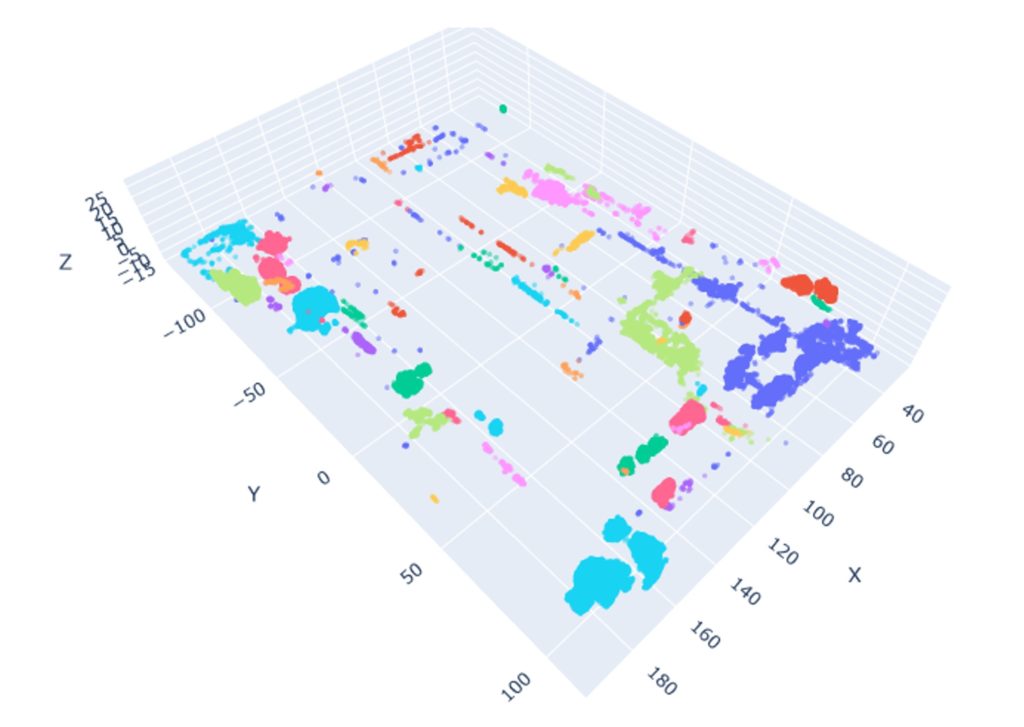
The methodology begins with converting raw point cloud data into a structured Pandas DataFrame, laying the foundation for systematic exploration and advanced computational analysis. The data is then segmented into distinct clusters using the DBSCAN algorithm, which identifies clusters based on density, with meticulous normalization ensuring each feature is on a level playing field. Subsequently, centroids are calculated for each cluster, serving as representative points and reducing the complexity of dense clusters. Efficient querying mechanisms are employed through KDTree, segmenting the dataset into distinct, manageable regions and facilitating rapid spatial queries. A graph is constructed to map potential fire spread pathways, with nodes symbolizing the centroids of vegetation clusters and edges representing the spatial interplay between them. Node degree analysis within this graph reveals potential hotspots and regions at risk of rapid fire spread, becoming focal points for strategic interventions. Finally, the insights are visualized on the original point cloud, translating complex computational insights into an intuitive, visual format, aiding in prompt and effective decision-making by stakeholders.
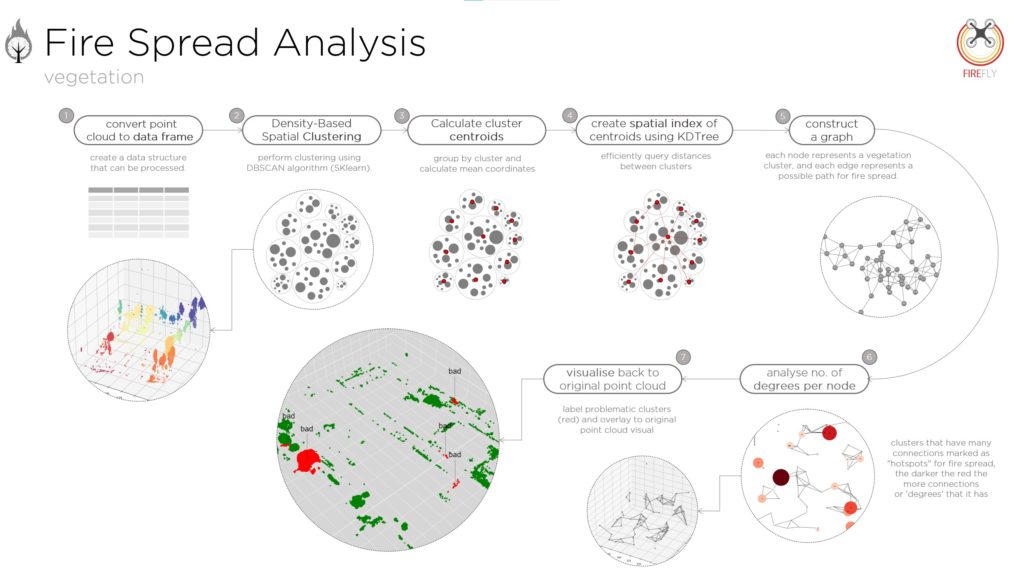
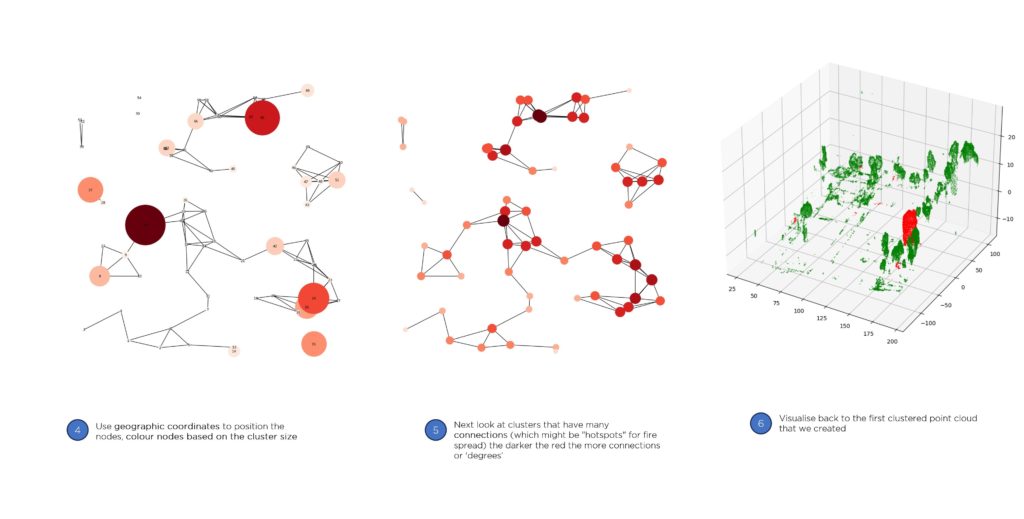
Matplot showing the final outcome of high risk vegetation
Slope & Aspect
A detailed analysis of terrain data
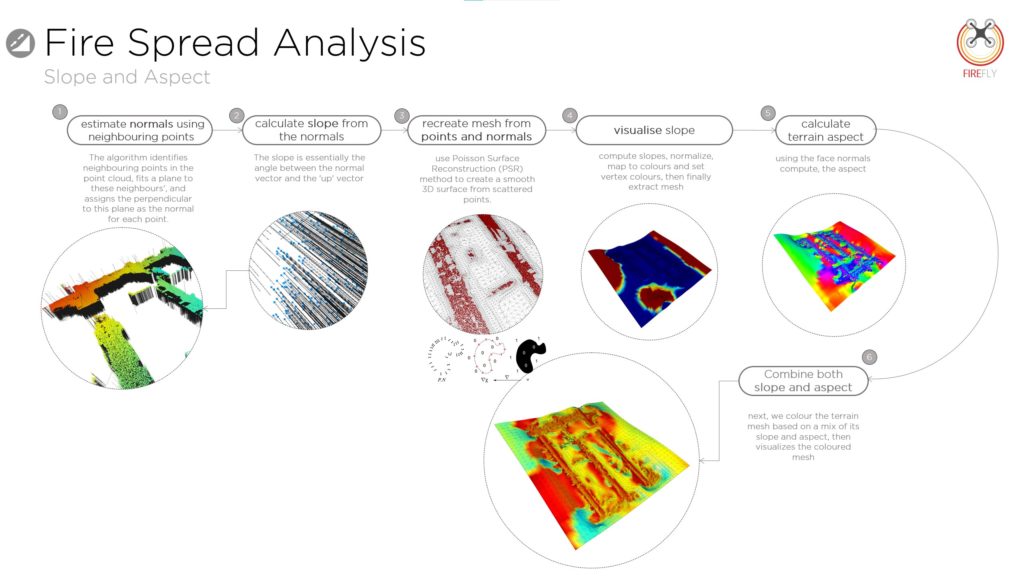
Terrain data is processed to understand its potential influence on fire spread. This workflow begins by estimating the orientation of each point in a 3D point cloud. Using this orientation, the slope of the terrain is computed to gauge steepness. A detailed mesh of the terrain is then generated, providing a tangible representation of the landscape. The direction each slope faces (aspect) is determined, revealing its orientation relative to cardinal directions. Finally, the insights
from both slope and aspect are combined, resulting in a comprehensive visualization that highlights areas of the terrain potentially more susceptible to fire spread.
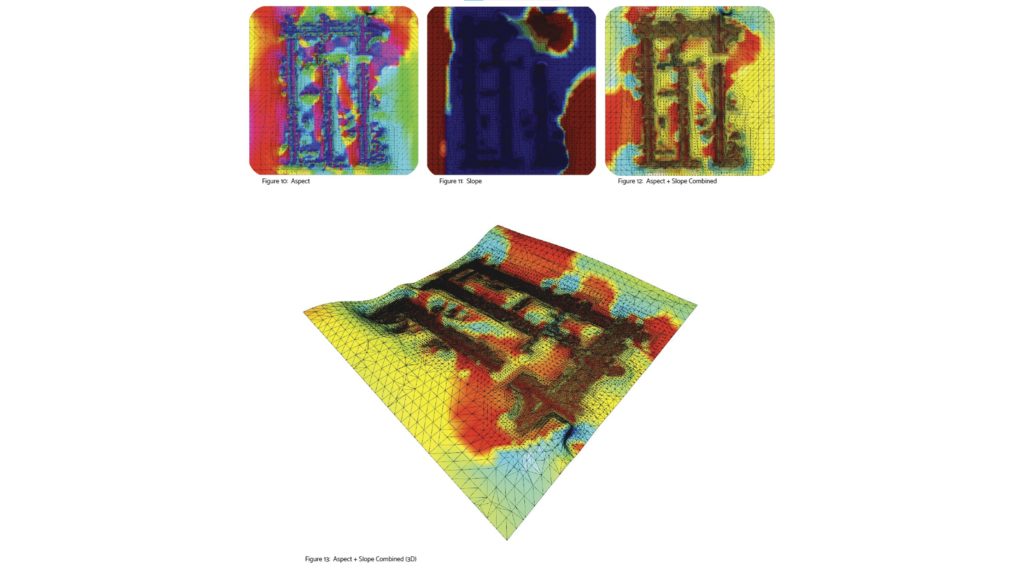
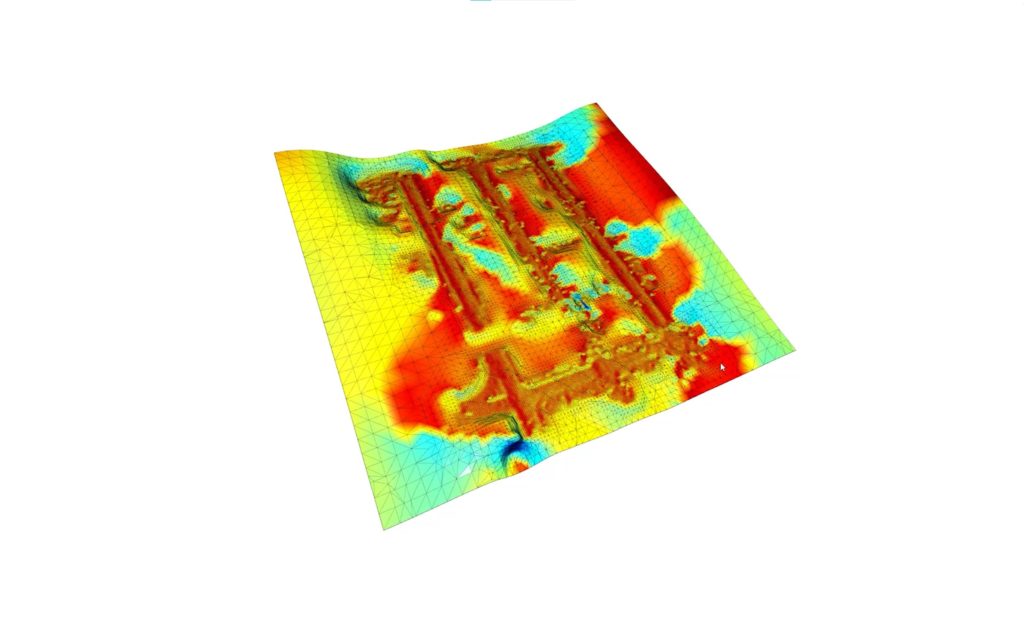
The process starts with estimating normals using the KDTree structure to organize points in k-dimensional space, facilitating efficient querying of neighboring points within a specified radius. The normals, representing the orientation of each point, are calculated by fitting a plane to these neighbors. The slope is then computed from these normals using the dot product between the normal vector and the ‘up’ vector, with the slope being the complement of the resulting angle. A mesh is recreated from points and normals using the Poisson Surface Reconstruction method, providing a clearer perspective of the terrain’s intricacies. The computed slope values are visualized using a color map, distinguishing between flat and steep regions in the mesh. Terrain aspect is calculated based on the face normals of the mesh, providing the orientation of each triangle face relative to the north direction. Finally, insights from both slope and aspect are combined using a weighted average approach, revealing regions more susceptible to fire spread due to their topographical attributes.
Building Density
Building Density Analysis in Fire Spread
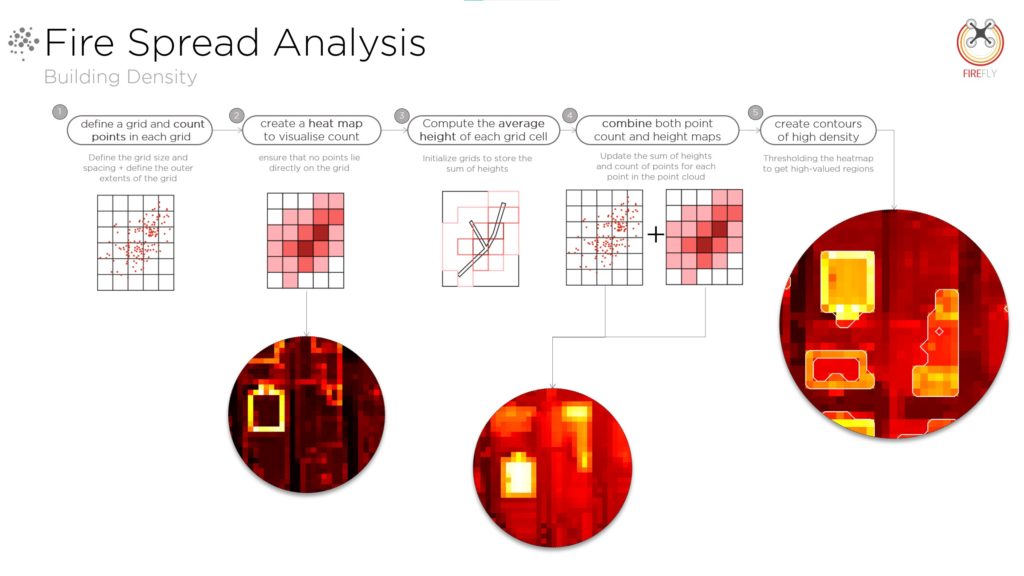
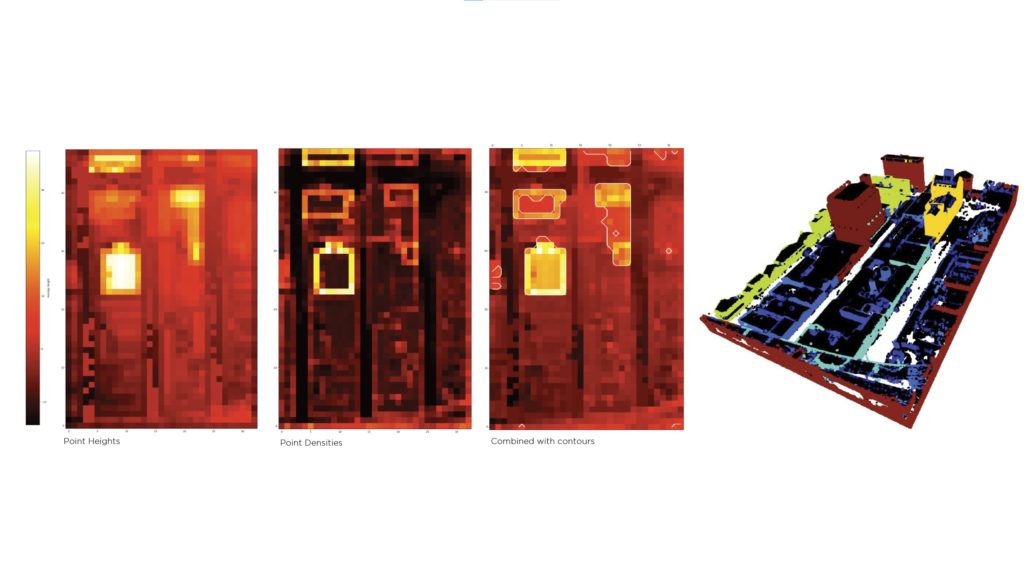
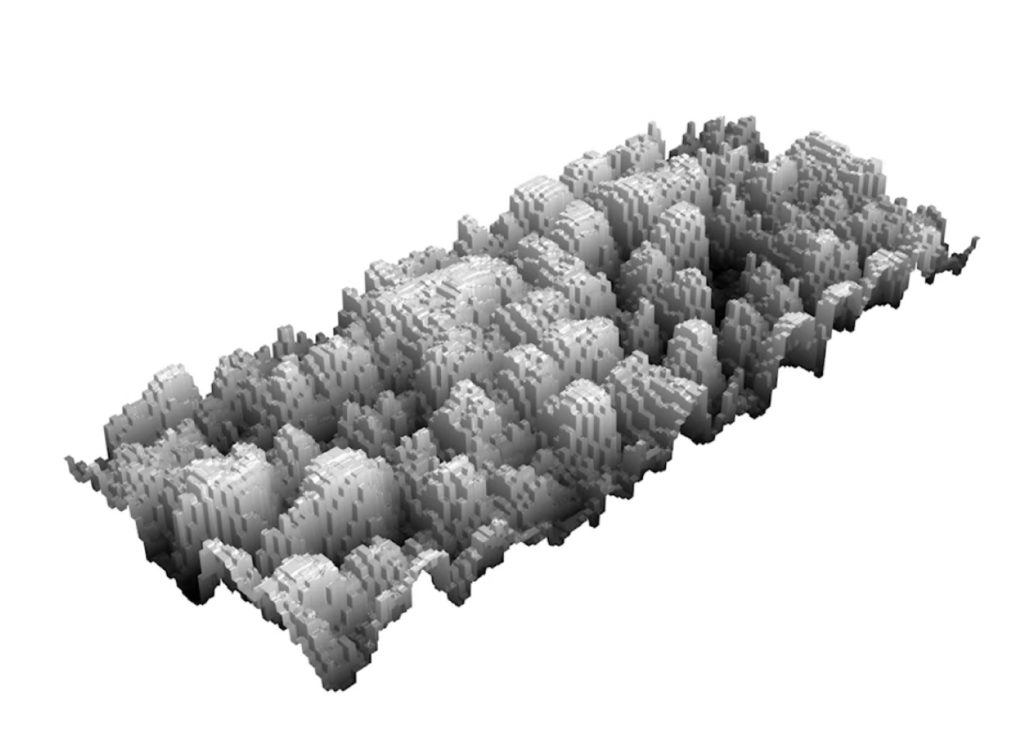
Building density and the physical attributes of structures, such as height, play a crucial role in the potential spread of fire and the associated risks. The objective of this workflow is to analyse the density of buildings using point cloud data and to visually represent this information in a comprehensive format. This chapter details the methodology used to derive insights from the data.
The process begins by defining a grid to determine building density within a specific area, using a point cloud dataset of 3D coordinates representing the buildings’ spatial structure. The density, visualized through a heatmap, is calculated and provides insights into building placement within each grid cell. KDTree is leveraged to calculate and visualize local densities, offering a vibrant depiction of point densities. The average height of each grid cell is computed by applying clustering algorithms to a 2D projection of the point cloud, with each cluster representing a separate building. The heatmap and height data are then integrated, providing a detailed representation of building density in relation to height. Finally, contours of high density are created from the combined heatmap, highlighting areas at higher risk of rapid fire spread due to building proximity and height.
Categorised Combustion
Analysis of building façade materials
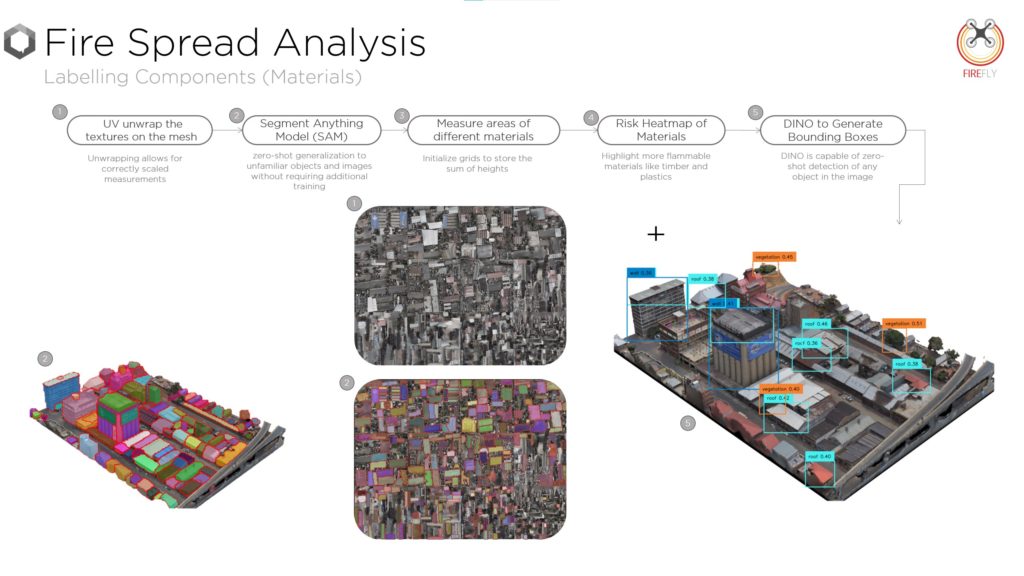
This workflow explores a novel approach of combining two AI ground breaking models: the Segment Anything Model (SAM) and DINO (Deeper Into Neural Networks). Together, they offer a holistic analysis of building façades to generate a comprehensive fire risk heatmap, revealing the transformative potential of AI in urban fire safety.
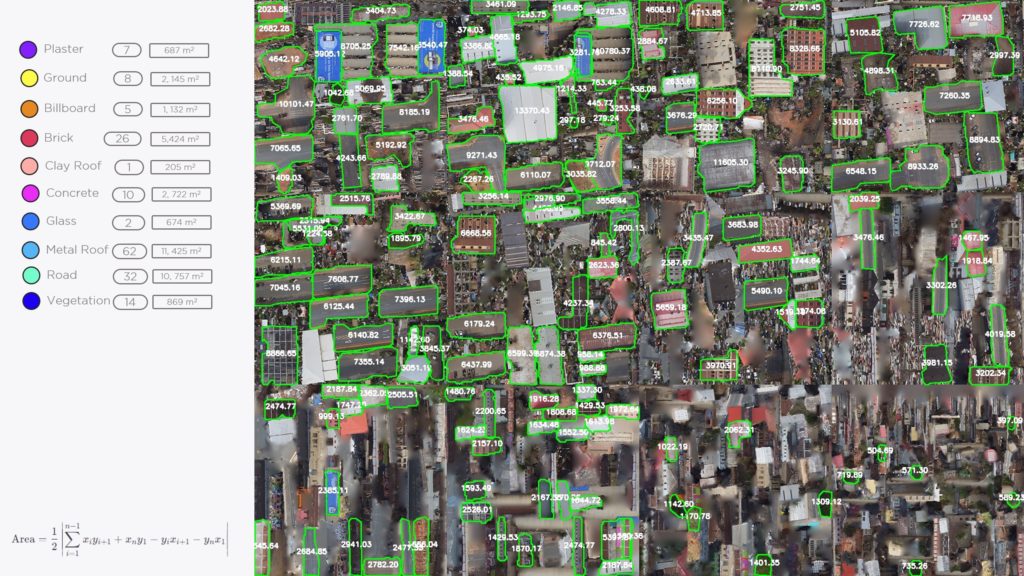
The analytical approach begins with UV unwrapping, a technique that maps 2D textures onto 3D objects, allowing for correctly scaled measurements on building façades. The Segment Anything Model (SAM) is then employed for semantic segmentation tasks, classifying individual pixels in an image into distinct categories, and is capable of recognizing and segmenting unfamiliar objects without prior training, accommodating the diversity in building façades. DINO, a model specializing in self-supervised learning and visual representation tasks, is used for object detection, identifying any object in an image even without explicit training, and capturing intricate details in images. This, combined with SAM’s segmentation, facilitates the detection of various materials on building façades. The areas of the identified materials are measured using the Shoelace formula, and a risk heatmap is created to visually communicate the potential hazards of different materials, offering stakeholders a clear view of areas requiring attention. This methodology, by fusing SAM and DINO’s capabilities, provides a novel method of assessing fire risks on building façades, illustrating the transformative potential of AI in enhancing urban safety and in real-world applications.
Proximity Patterns
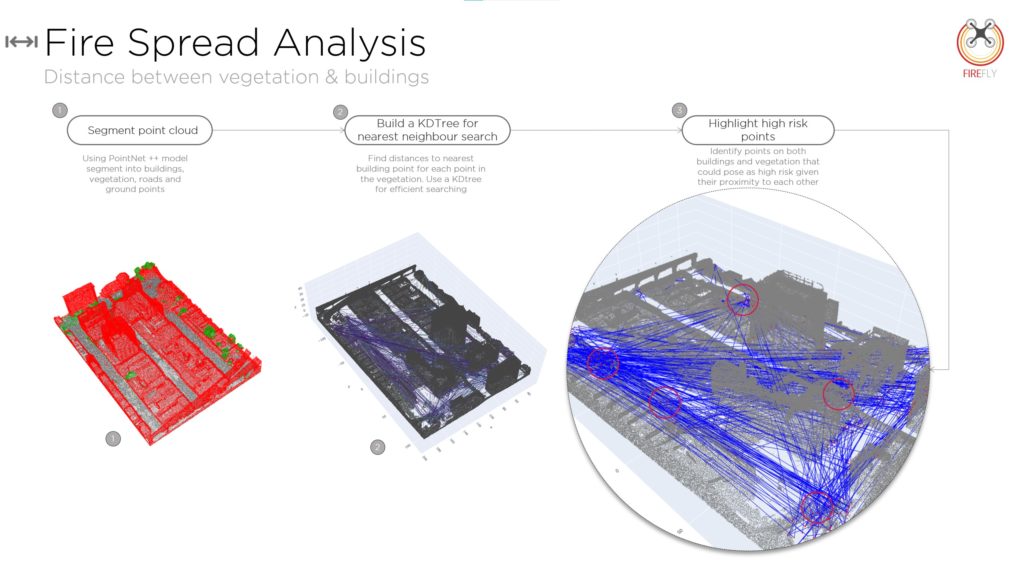
The intricacies of urban and environmental landscapes can be comprehensively represented using point clouds, collections of data points in three-dimensional space. While LiDAR is a common source of such data, a less resource intensive and often underutilized approach is the extraction of point clouds from three-dimensional meshes. In this research, we embraced this technique, leveraging mesh-derived point clouds to assess the proximity between buildings and vegetation – a critical determinant in urban fire risk assessment.
The process begins with the segmentation of point cloud data into distinct categories like buildings, vegetation, roads, and ground using the PointNet++ model, ensuring precise categorization and bolstering the accuracy of subsequent analyses. To determine the spatial relationships between vegetation and buildings, a KDTree is constructed with building points, allowing for the swift determination of the nearest building counterpart for each vegetation point, ensuring computational efficiency and precision. The raw distances obtained are normalized and mapped onto the ‘viridis’ colour map, rendering the data more interpretable and allowing for immediate discernment of proximity levels. The real value of this process is in leveraging this information to pinpoint potential hazards. Points on buildings and vegetation that are below a predefined threshold are classified as high-risk, representing areas where the interplay between man-made structures and nature is dangerously close, potentially escalating fire hazards.
Weather Analysis
Weather Insights: Decoding Fire Risks
The intricate dance of environmental variables shapes the world we live in. Among the myriad of challenges posed by changing climatic patterns,
wildfires stand out as a particularly menacing threat. These uncontrolled blazes not only devastate ecosystems but also imperil human lives and
property. To address this challenge, it’s imperative to understand the precursors to wildfires and devise predictive models for early warnings. This
chapter delves deep into the nexus between weather parameters and fire risk, harnessing the power of technology and analytical methodologies.
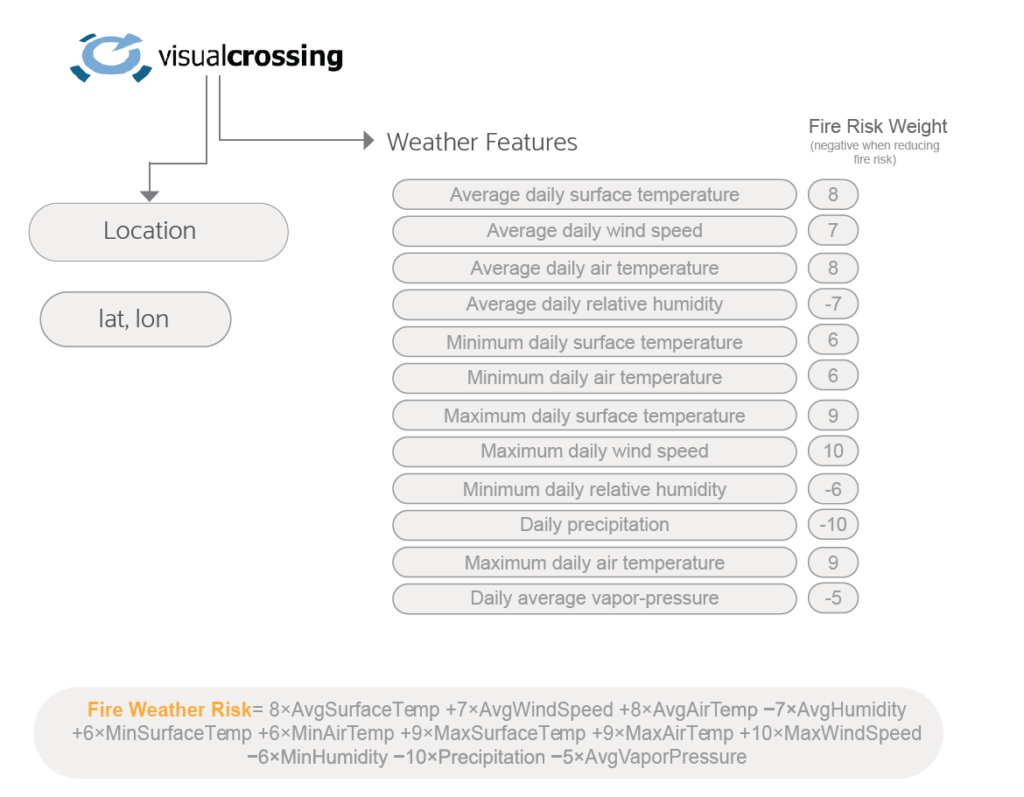
Wildfires, often resulting in catastrophic loss and environmental damage, are influenced predominantly by meteorological conditions. To correlate weather parameters with fire risk, an API from Visual Crossing Weather is employed for its accuracy, reliability, efficiency, and scalability. The methodology involves retrieving weather data, parsing it into a dictionary, calculating a fire risk score using a predefined formula that integrates various weather parameters, and categorizing the risk into different levels.
Weather parameters like temperature, wind speed, humidity, and precipitation play a significant role in determining the likelihood and severity of wildfires, with elevated temperatures and strong winds having pronounced impacts. The risk assessment formula reflects the importance of each parameter, assigning higher weights to those with more significant impacts on fire propagation.
This research represents a stride towards understanding the interplay between weather and fire risk in an era marked by climatic uncertainties. By harnessing technologies like APIs and developing predictive models, the aim is to preemptively address and mitigate the impacts of wildfires through a comprehensive data-centric approach, with refinements and geographical expansions enhancing its predictive accuracy and utility in the future.
Fire Spread Analysis
Predictive wildfire modeling and mitigation
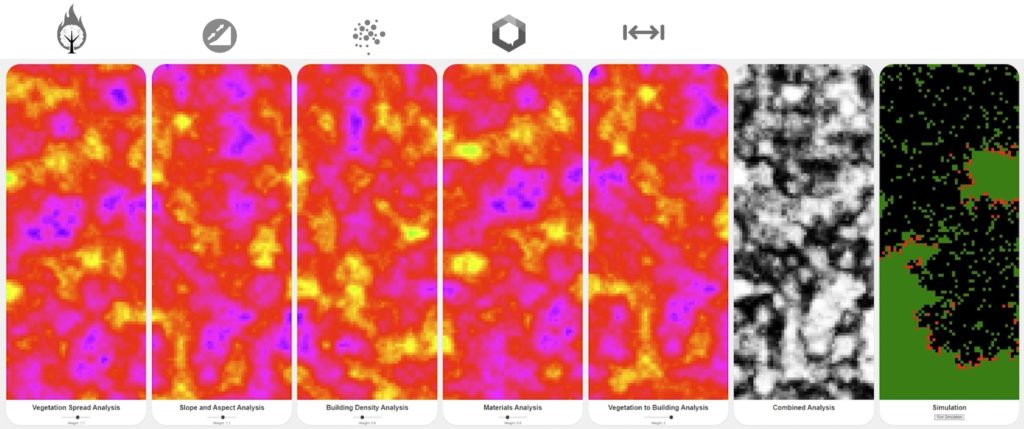
The fire spread simulation is a computational representation of how fire propagates through a landscape. It is designed to visualise and predict fire spread based on various factors, such as terrain, vegetation, and atmospheric conditions. The process of simulating fire spread that we have adopted uses a combination of summary heatmaps and cellular automata.
The simulation is based on the generation of heatmaps representing different conditions across a landscape, such as vegetation spread, slope, building density, and distances from vegetation to buildings, providing a normalized visual of fire spread analytics. Multiple heatmaps are combined using the combineMaps function, considering weights from sliders and applying histogram equalization to enhance contrast.
Fire spread is simulated using a cellular automata model, with cells representing different states: unburnable, not ignited, burning, and burned. The ComputeNextState function governs the progression of the simulation, determining the next state of each cell based on its current state and neighboring states.
To enhance fire containment, the workflow strategically creates fire-breaks around high-risk areas using the createFirebreakAroundHighRisk function. High-risk areas are identified by the identifyHighRiskAreas function, which flags the top 10% of the most intense regions in the combined heatmap. Fire-breaks can be created automatically or manually by users, with each fire-break being tracked and displayed on the interface.
The drawGrid function visualizes the grid, and the simulation can be advanced step-by-step using the stepSimulation button. Users can adjust the weights of individual heatmaps, influencing the combined heatmap and the fire spread simulation, providing a dynamic representation of fire behavior influenced by various conditions and factors. The approach mirrors real-world strategies, allowing for both automatic identification of risk areas and manual intervention, offering a flexible and strategic approach to fire containment.
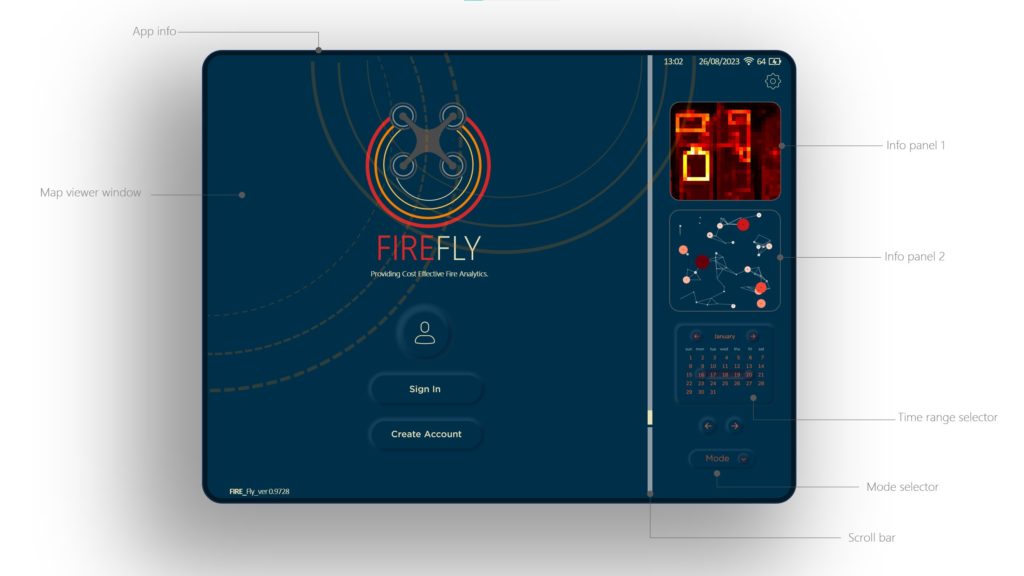
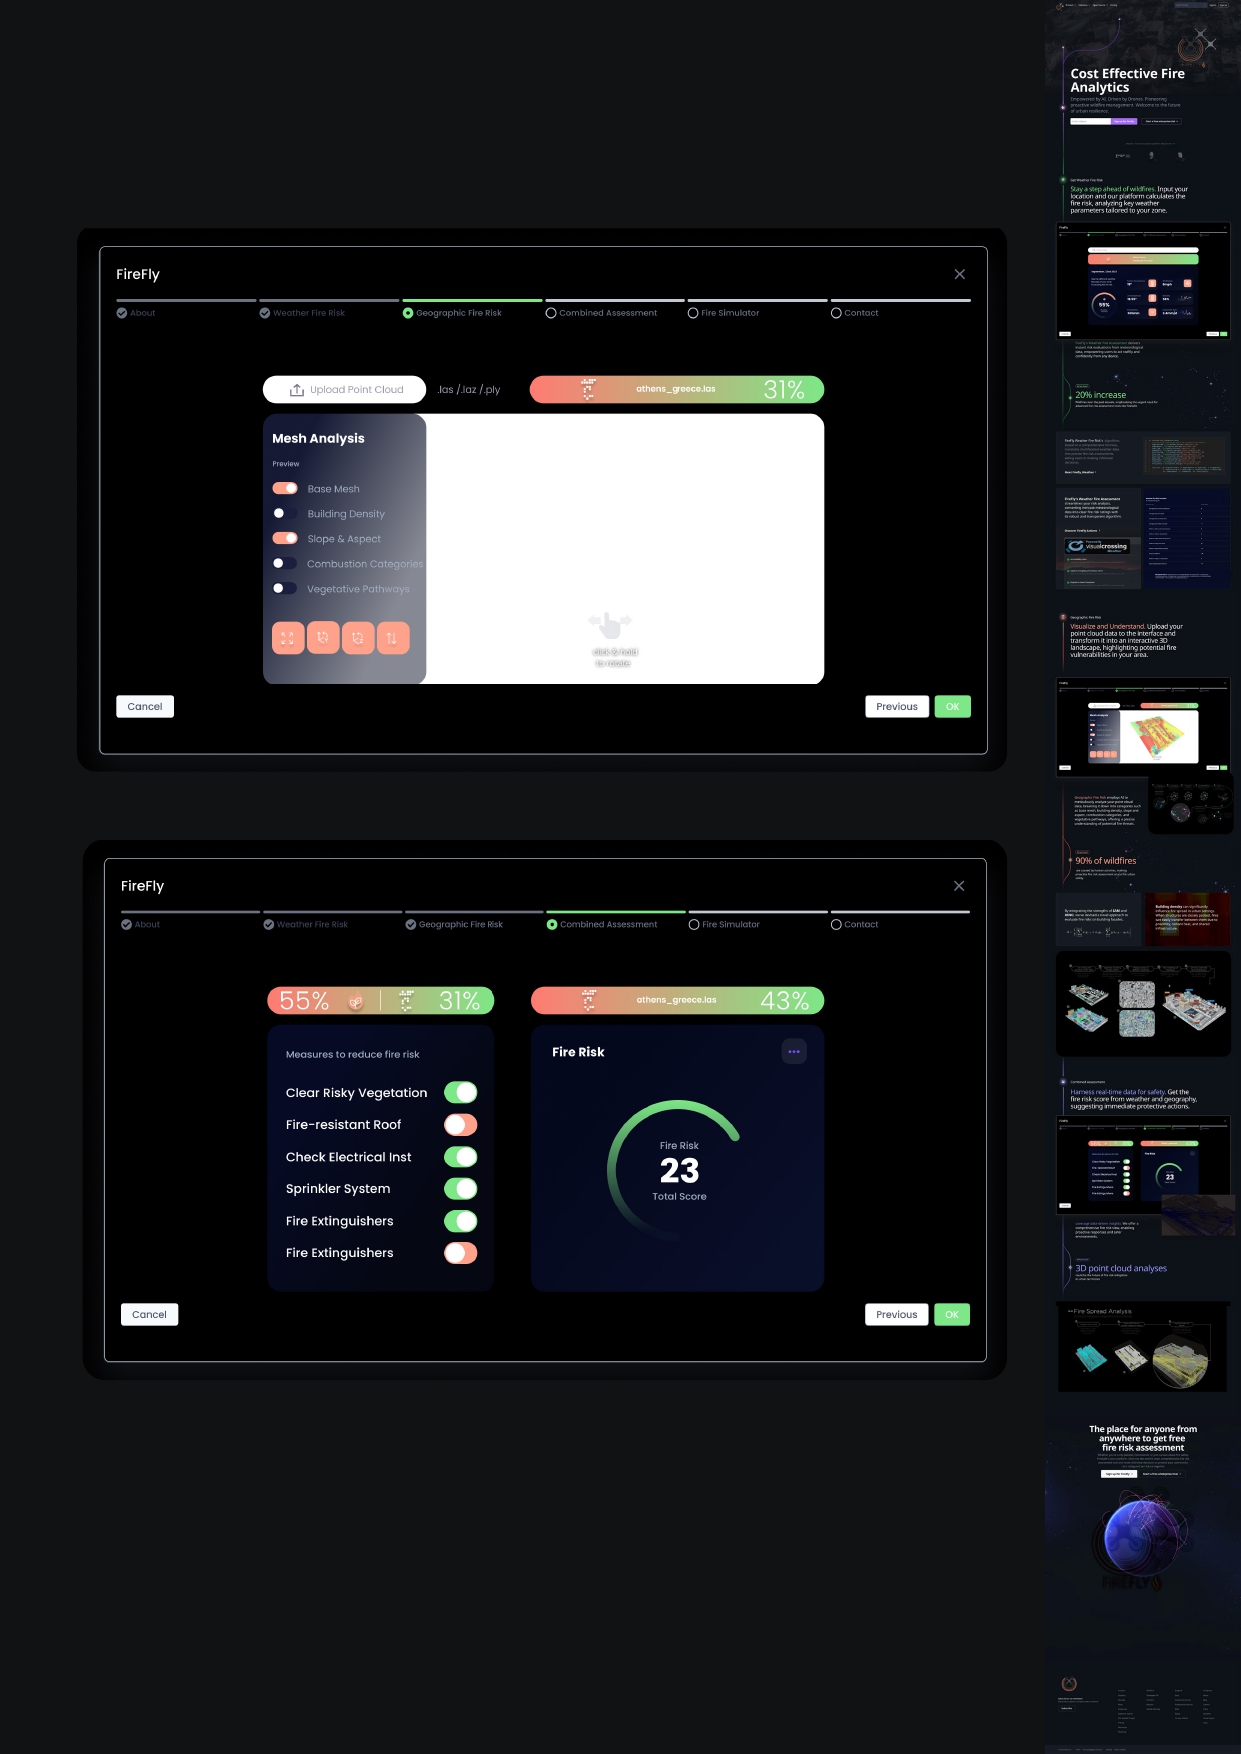
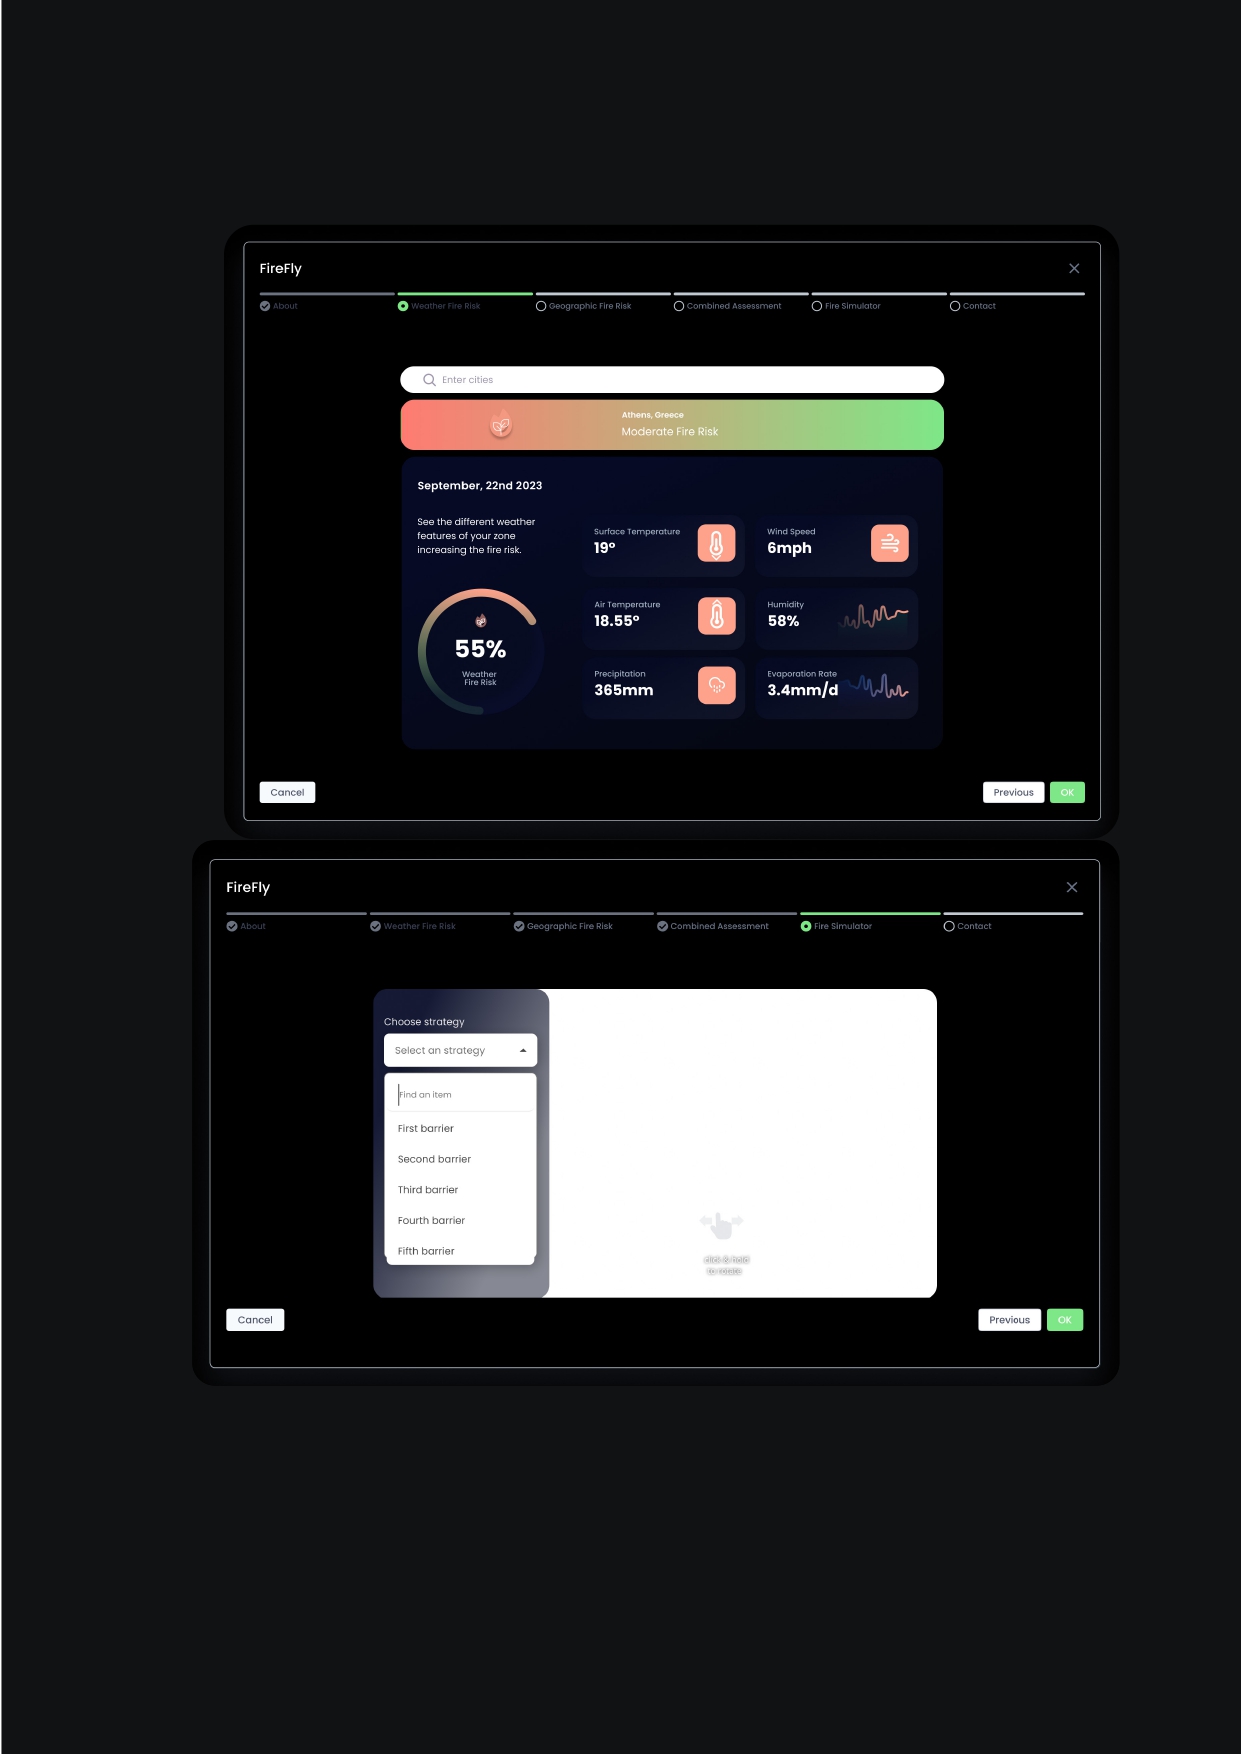
User Interface
A Guided User Experience
Conclusion
Summary thoughts and future potential
In the era of ever-increasing urban expansion and exacerbated wildfire incidents, our thesis stands as a pivotal endeavor to address this pressing concern. The research embarked on a journey to harness the potential of open-source technologies, converging them in novel ways to offer a low-cost yet efficient fire risk assessment tool.
Central to this project was the significant leverage of artificial intelligence and machine learning. These technologies not only enhanced the efficiency of data processing but also equipped the tool with predictive capabilities. The choices of metrics and parameters for the analytics were meticulously based on prior research, ensuring the tool’s accuracy and relevance in predicting fire spread.
This thesis underscores the significance of robust back-end algorithms and data processes, which form the bedrock of any analytical tool. Furthermore, the research delves deep into factors influencing fire spread. The “Categorised Combustion” section, for instance, delves into building façades and materials, while “Proximity Patterns” elucidates the interplay between building and vegetation proximities.
The urban scale of the study is particularly pertinent, given the increasing urban-rural interface and the vulnerability of urban regions to wildfires.
Our research has culminated in the development of a pioneering proof of concept, illustrating the potential for a cost-effective, easily accessible strategy to analyse fire risk spread at an urban scale. Through the incorporation of advanced AI techniques, we have introduced innovative work flows, heralding new paradigms in fire risk analysis.
The integration of the Segment Anything Model and DINO – a state-of-the-art self-supervised system by Meta. This combination harnesses the power of AI to decipher and utilize vast amounts of unlabelled data relatively effectively.
The rapid evolution of AI technologies has consistently presented fresh avenues of exploration. Remarkably, even during the course of our research, breakthrough methodologies emerged. One such advancement is Neural Radiance Fields (NeRFs), which has revolutionized the generation of 3D representations from 2D images. This technique, backed by sophisticated machine learning algorithms, offers a potential alternative to our proposed photogrammetry method. Notably, NeRFs streamline the process, necessitating fewer photographs for 3D model reconstruction compared to traditional photogrammetry.
Looking ahead, future iterations of our work could delve into eliminating the dependency on drone deployment, further streamlining the process. Technological advances, such as Google’s 3D Tile Map API, hold promise. As these technologies mature and offer more frequent updates, especially in outlining regions, they might obviate the need for drones.
Expanding the horizons of our research, we believe that deeper exploration into machine learning processes could yield promising results. A potential avenue is the development of algorithms predicting fire spread based on the summary maps we’ve generated. While the creation of an appropriate dataset might demand significant effort, the potential outcomes could be ground breaking.
While our material façade classification has shown promise, it demands further refinement. The current accuracy levels hover around 62%, indicating a scope for enhancement. A practical next step would be to juxtapose our predictive models against real-world fire scenarios. Such an endeavour would not only validate our methodologies but also facilitate fine-tuning, ensuring that our work flows are robust and reliable.
By marrying advanced computational methodologies with practical, on-ground metrics, it offers a beacon of hope in the relentless battle against wildfires. The insights gleaned from this research will undoubtedly serve as invaluable assets for urban planners, policymakers, and environmentalists in the years to come.
Just for fun…
We gamified our point cloud and turned it into a game of old school Pac-Man!
