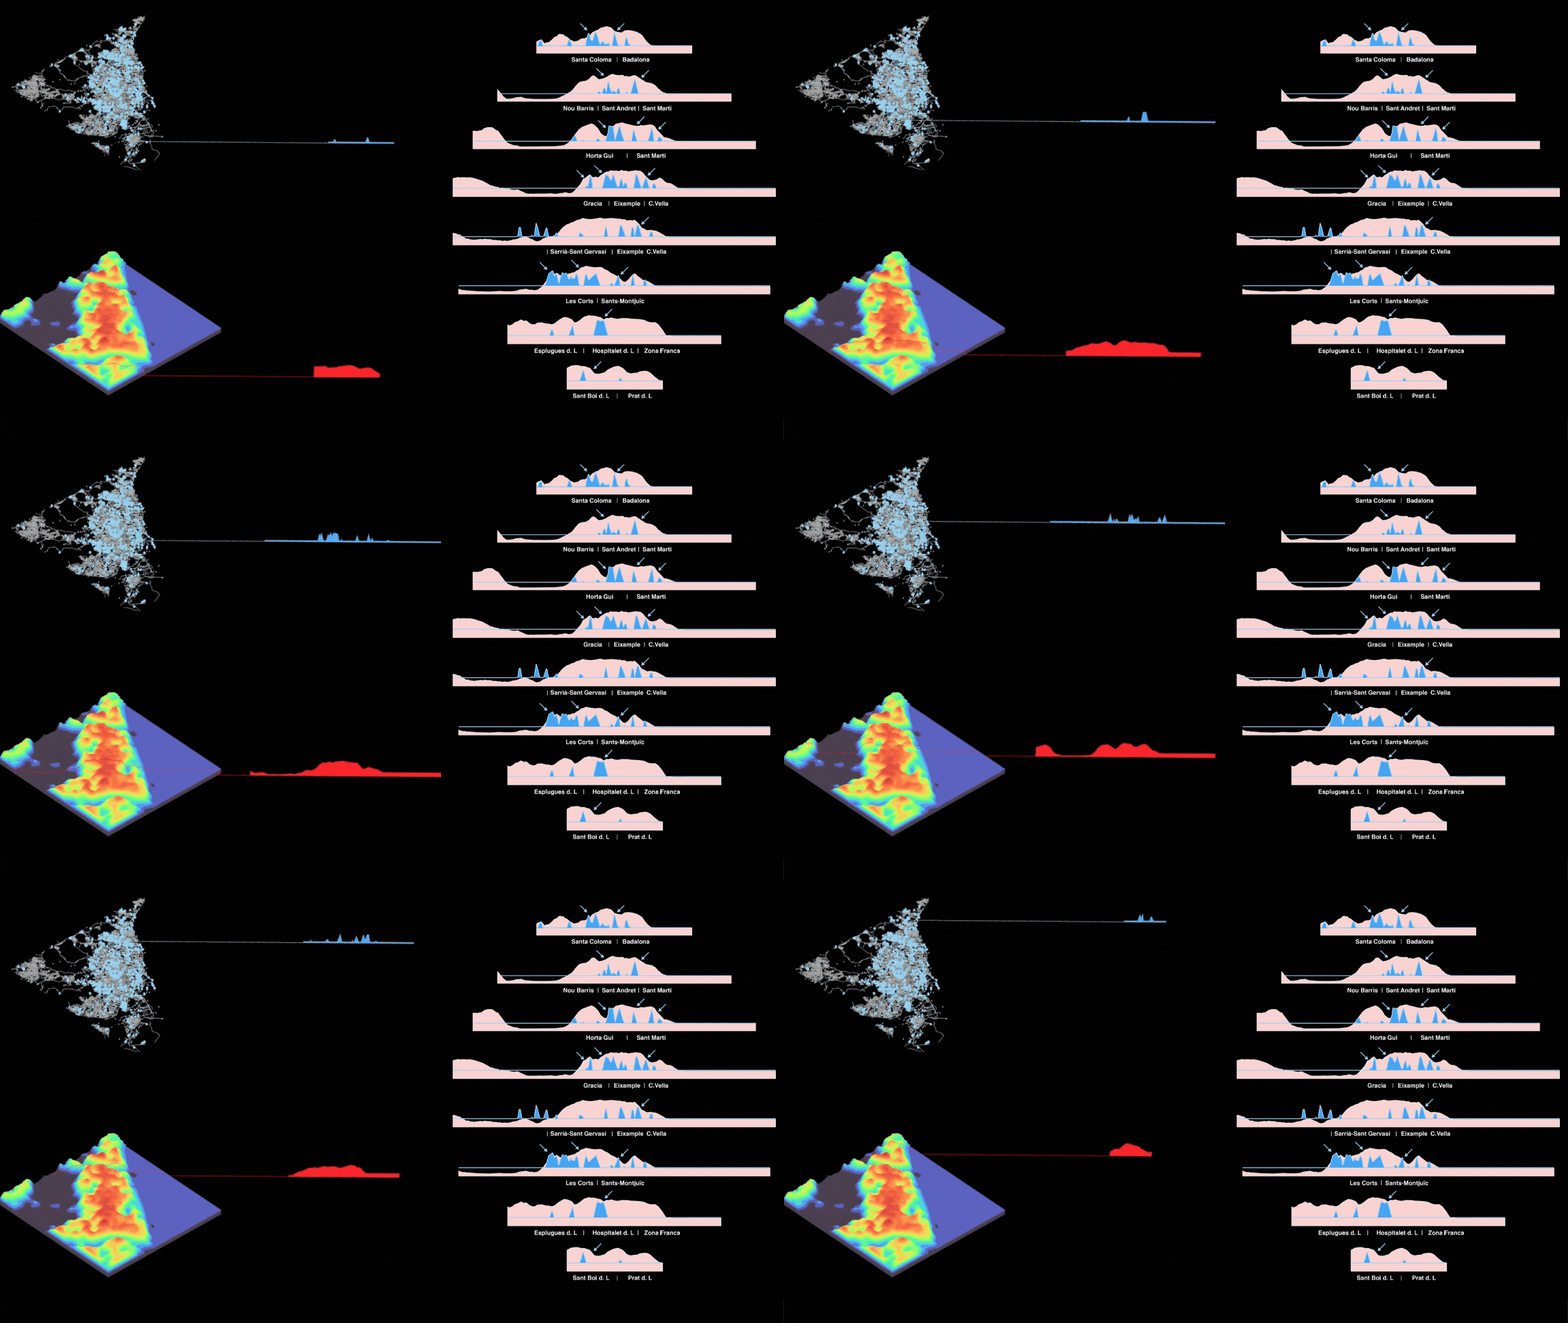
Rising heat is an increasingly critical global condition driven by climate change, urbanization, and deforestation. Average global temperatures have climbed due to greenhouse gas emissions, leading to more frequent and intense heatwaves that threaten ecosystems, economies, and public health. Urban areas, in particular, experience exacerbated effects due to the urban heat island phenomenon, where concrete, asphalt, and lack of greenery trap heat. This trend disproportionately impacts vulnerable populations, particularly those in low-income regions with limited access to cooling infrastructure. Without urgent mitigation and adaptation efforts, rising heat will continue to intensify, exacerbating global inequities and environmental challenges.

CCVI – understanding global condition:
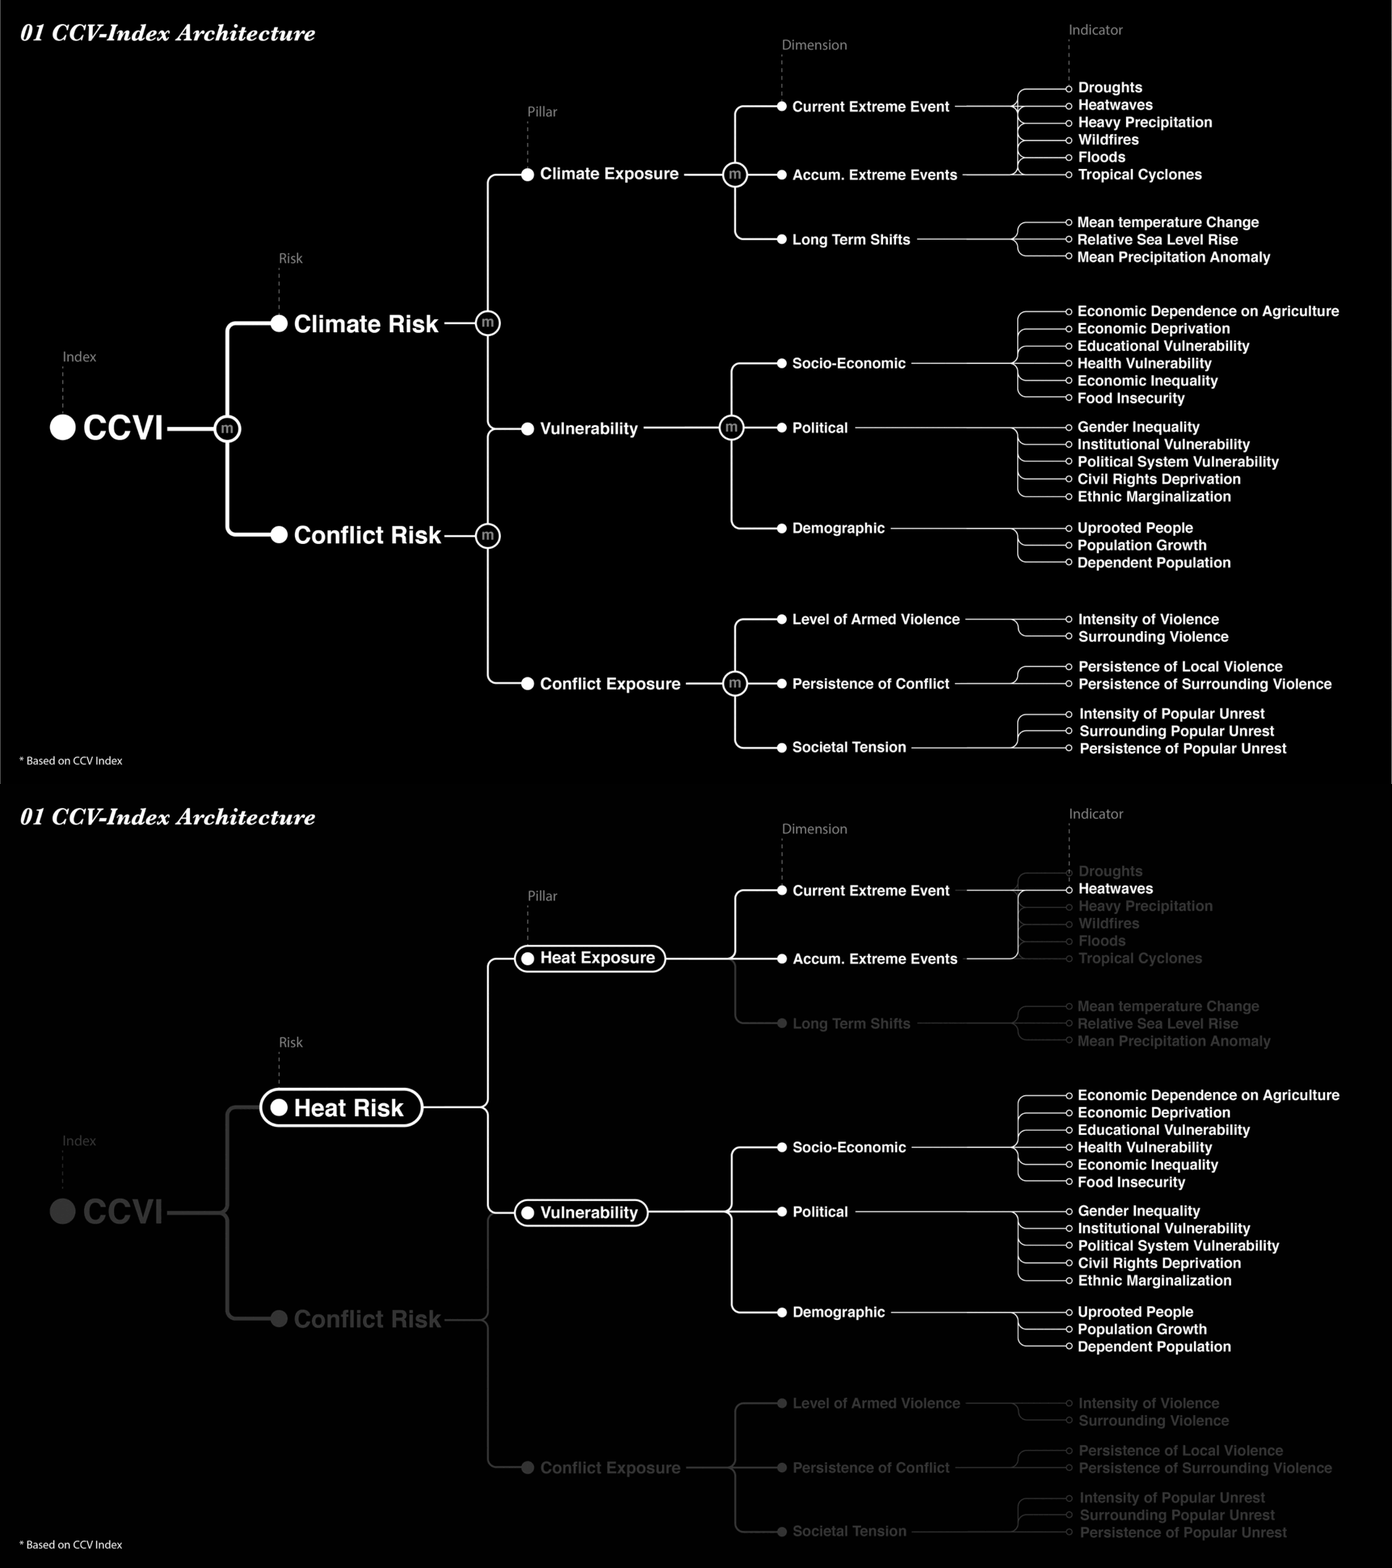
In order to understand the global impact of heat, we studied the Climate—Conflict—Vulnerability Index (CCVI). It maps current global risks by integrating climate and conflict hazards with local vulnerabilities. CCVI is a scientifically informed tool that enables policymakers and researchers to assess and map current global risks to human security arising from climate and conflict hazards, their intersections and the potential for harmful interactions. Additionally, the CCVI reveals how vulnerabilities can amplify the impacts of climate and conflict hazards.
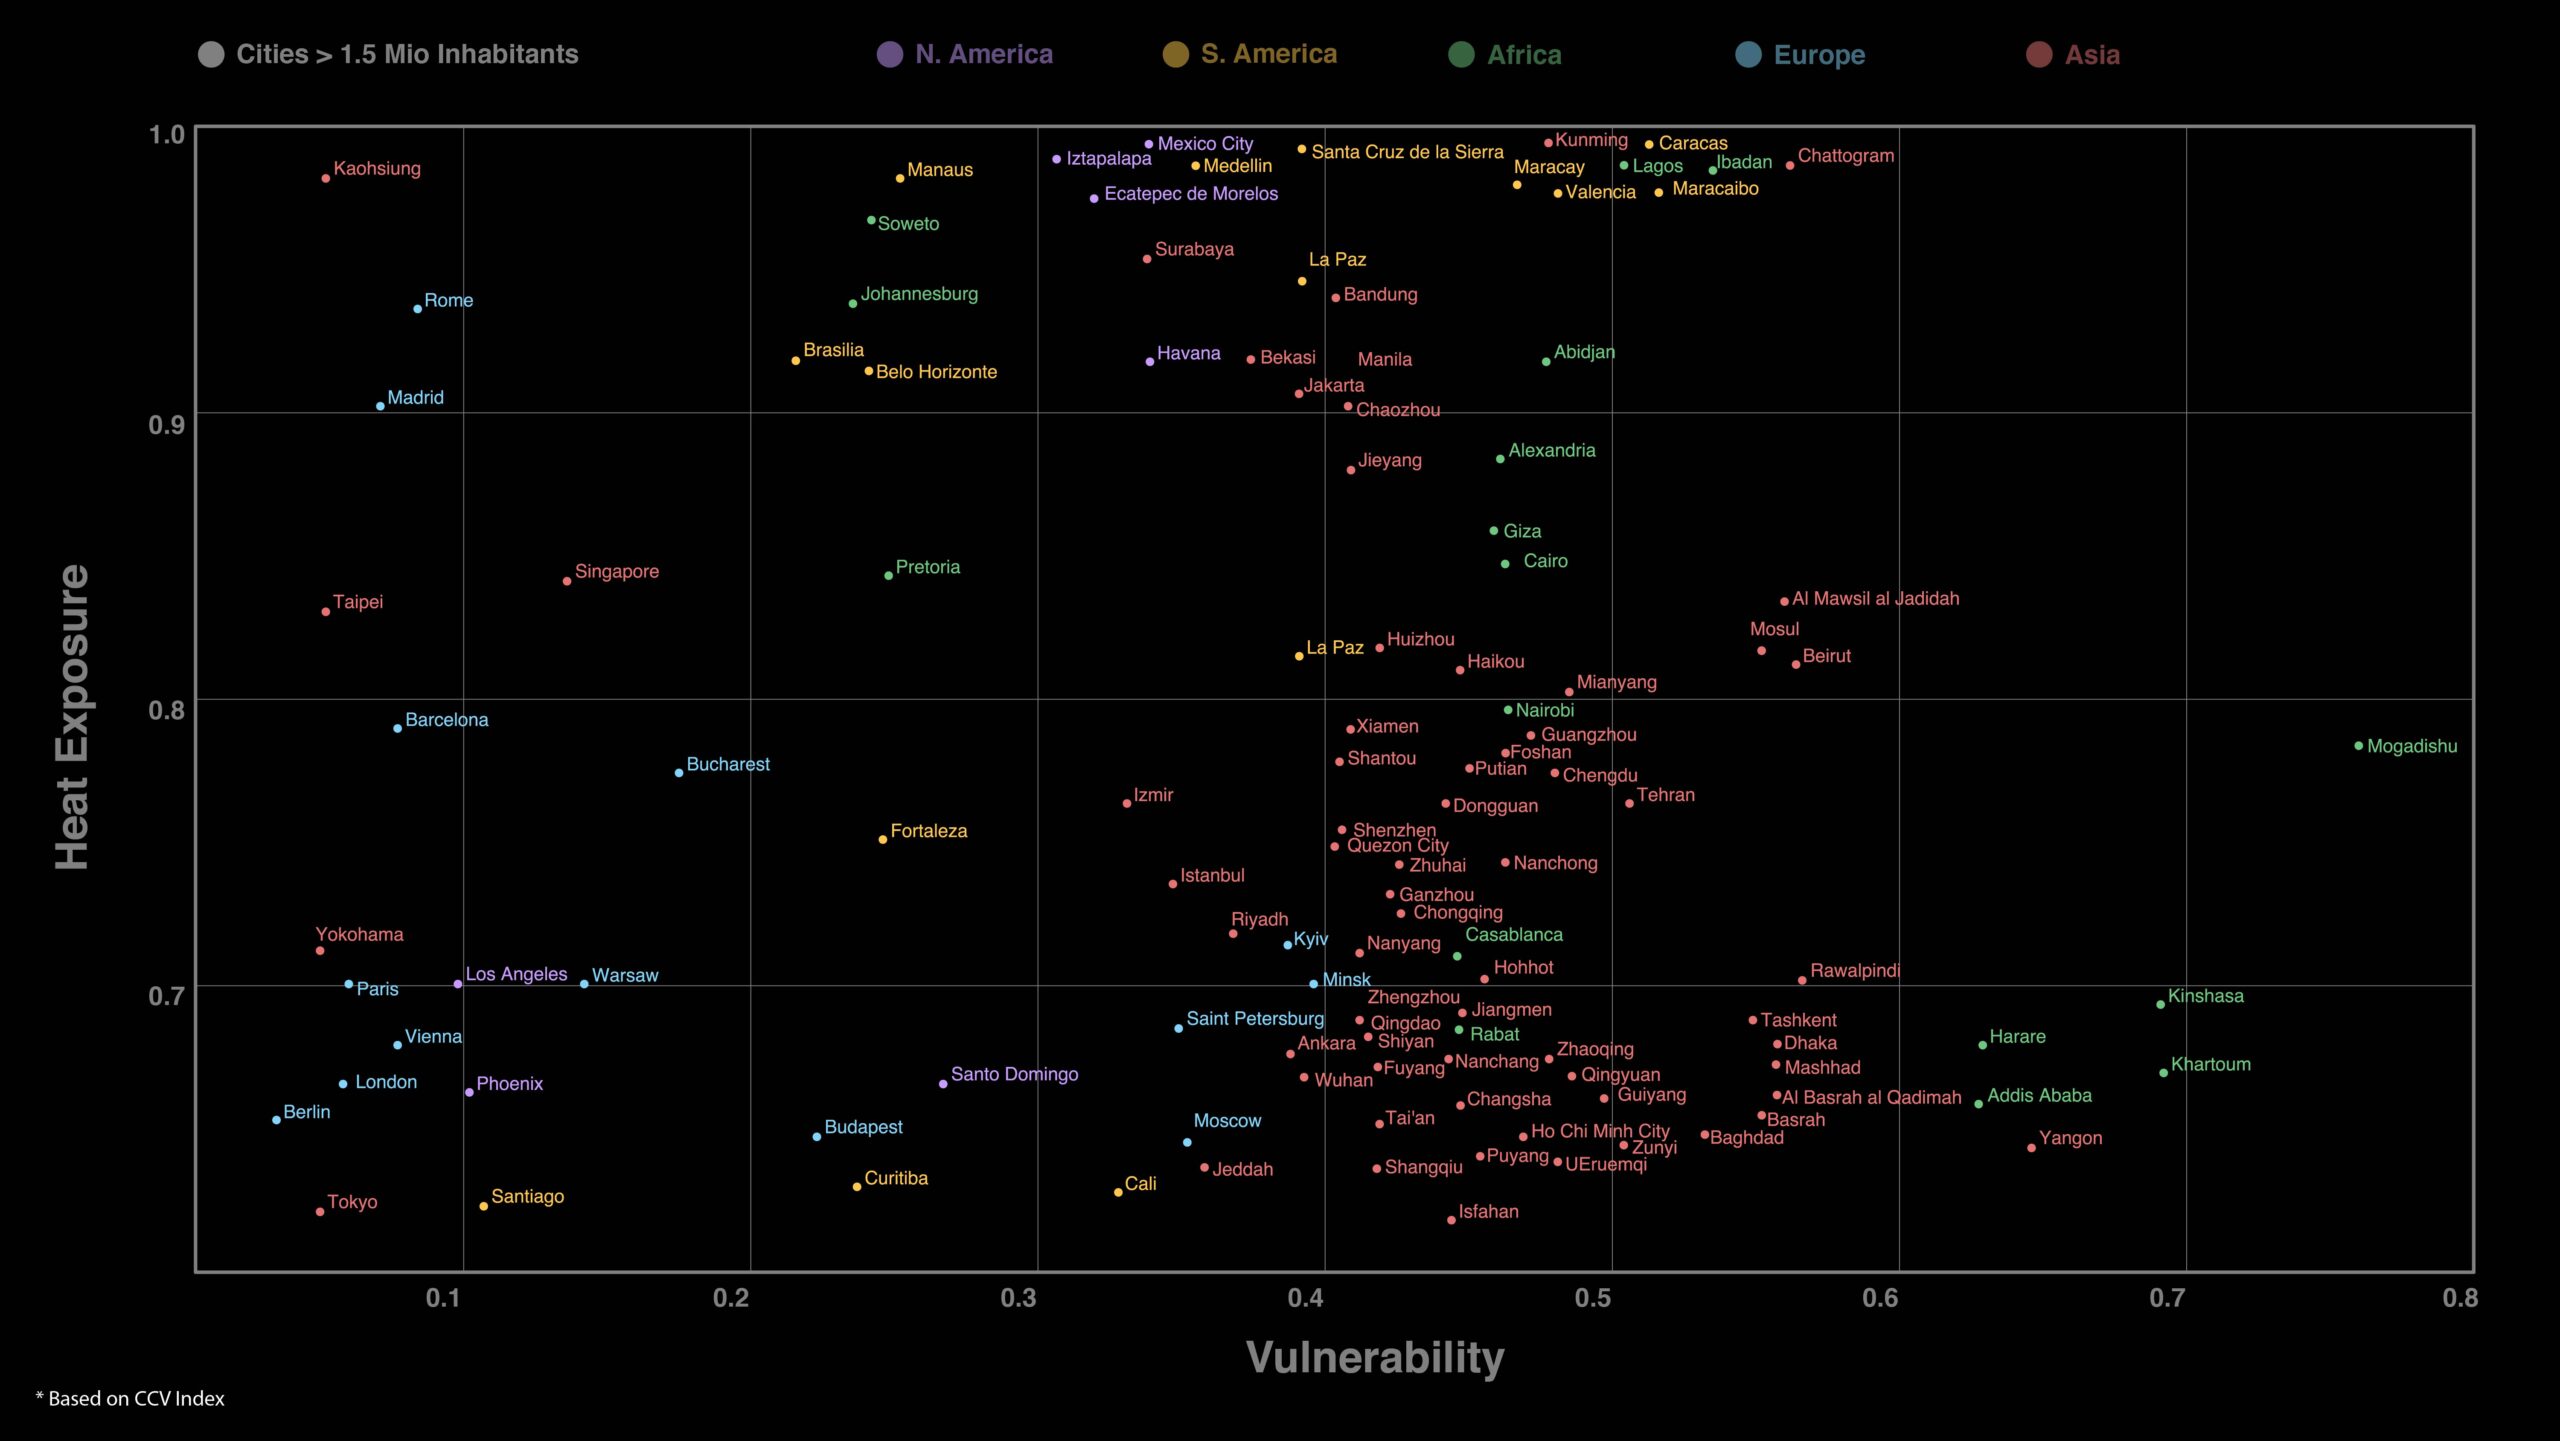
Based on the CCVI data, we visualize maps showing the places affected due to heat waves in world with respect to vulnerability.

In order to learn the effects more in detail, we started to use the urban scale lenses and pick the cities from the index.
The CCVI’s simplistic methodology limits its ability to assess complex interactions between risk determinants. The risk scores generated by the CCVI require contextual interpretation to fully capture local nuances. This opens up various spatial blind spots in the study and questions like….
- What physical forms and spatial patterns does heat take in urban environments?
- How is the Local climate with respect to every city effects the increasing heat?
- What are the factors/stakeholders affected more by these heat waves?
Urban Heat: A Spatial Perspective:
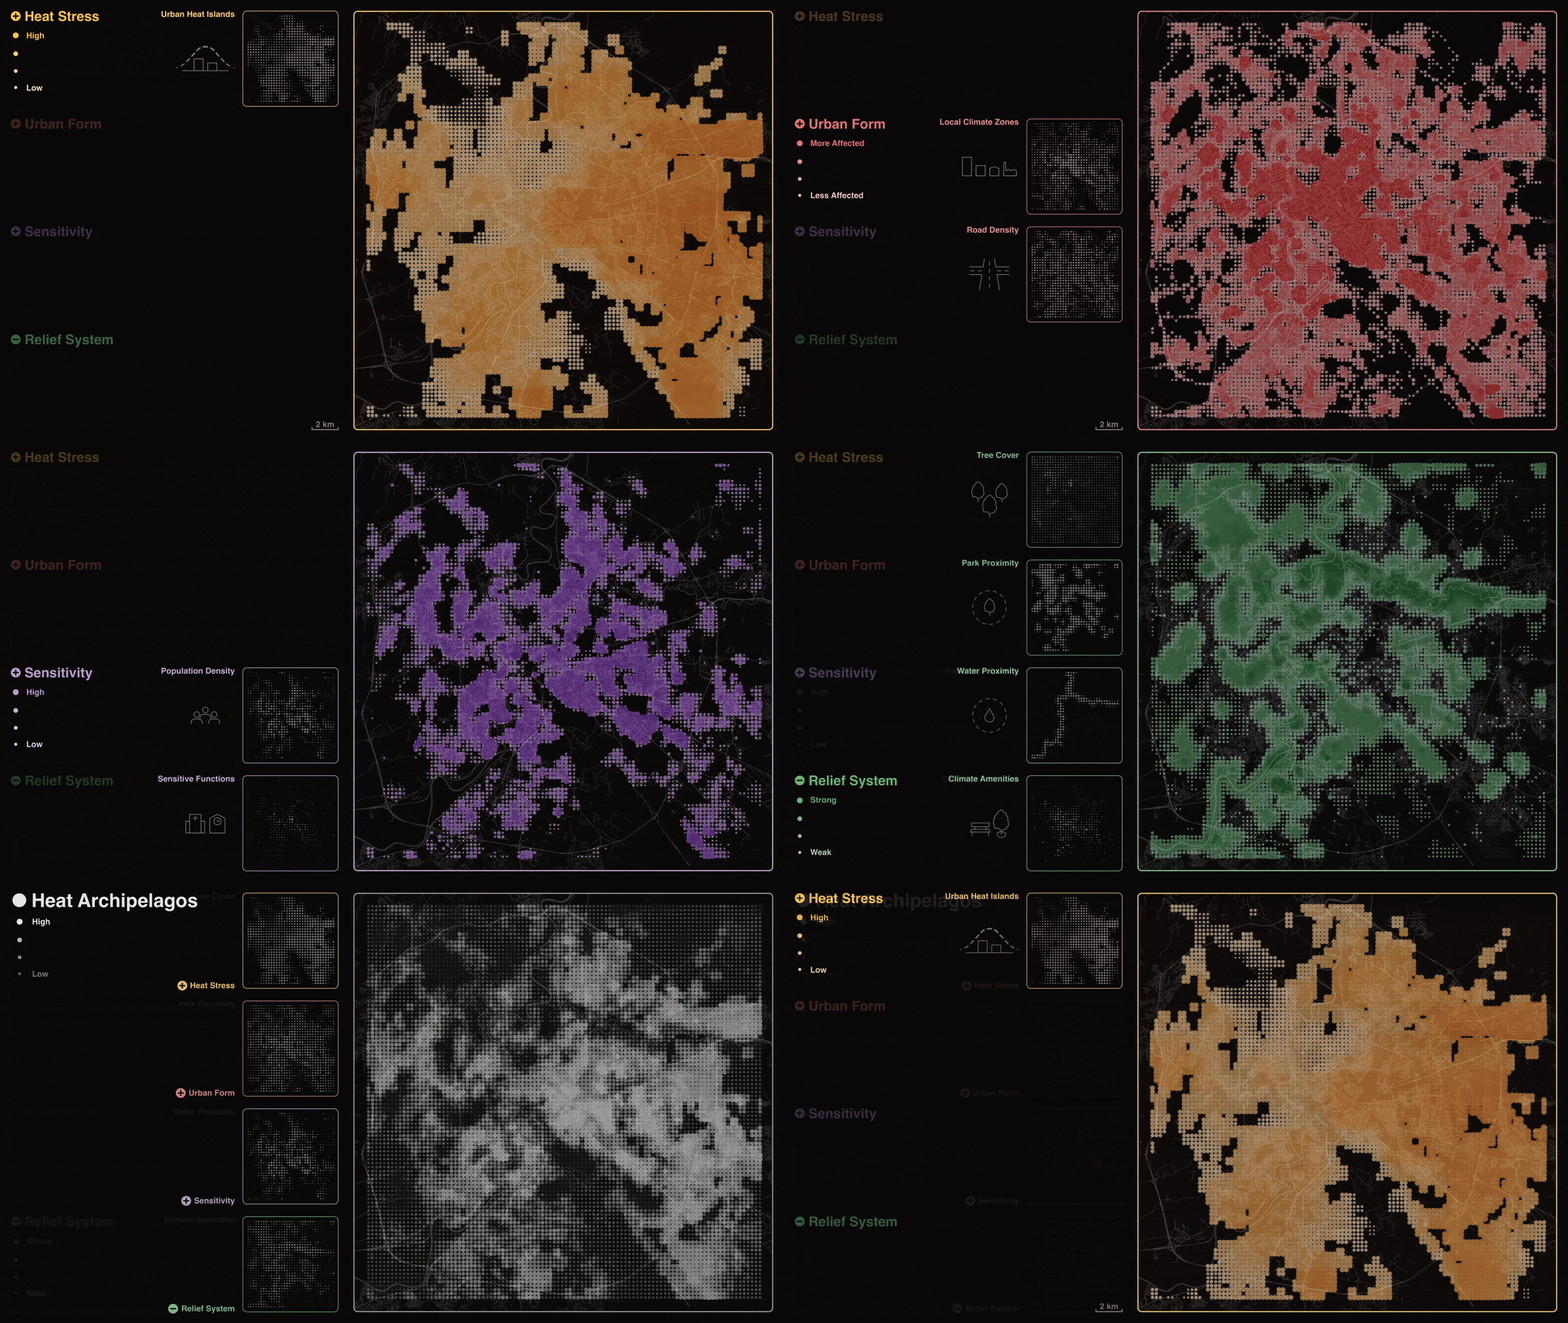
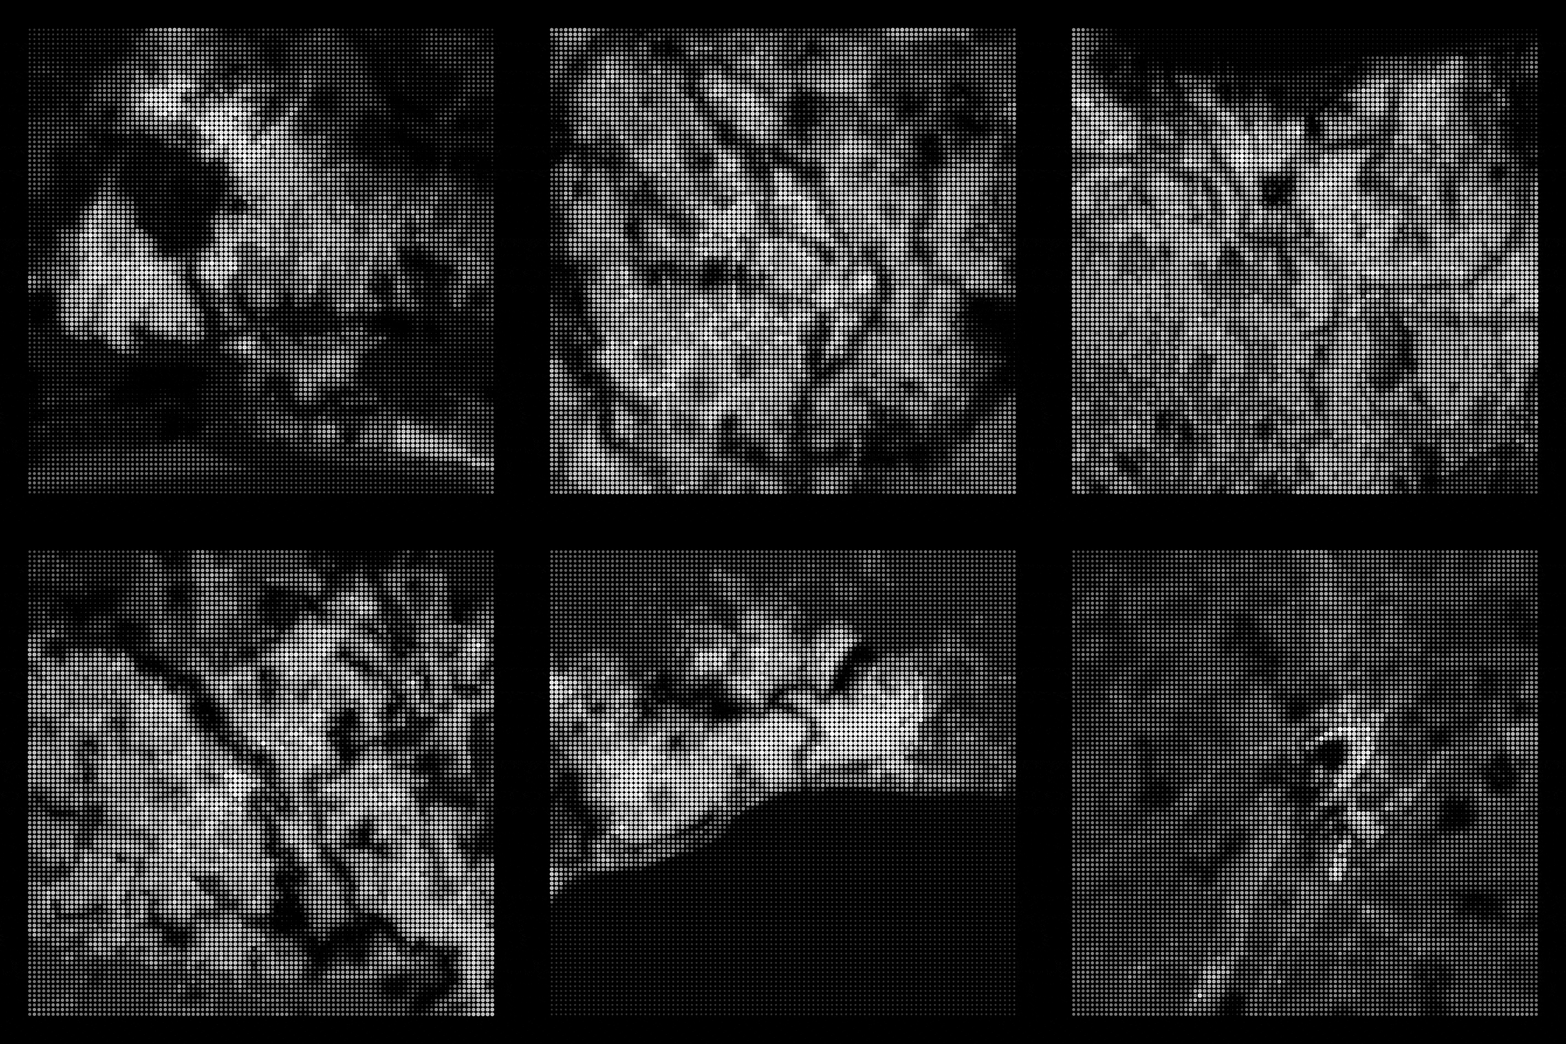
Drawing from case studies and insights from various research papers, our approach was structured around key elements, including Urban Heat Islands (UHI), urban form, sensitive layers, and relief systems. To effectively visualize these concepts, we selected cities that are significantly impacted, focusing on Rome as a representative example due to its high vulnerability within the European context. The city was systematically divided into grid cells measuring 300 x 300 meters, enabling detailed spatial analysis. Data manipulation and integration of diverse datasets were employed to achieve comprehensive insights. To illustrate the findings, heat archipelagos maps were developed using a monochromatic color scheme, effectively representing binary values within each dot to enhance clarity and interpretability.

Heat shapes of city – loop and repetition
The process of studying the cities ranked high by the CCV index started by creating images according to the presented process. Through a Python Script the map creation was automated and looped. The maps present the impacts of heat according to the parameters chosen in a binary manner.
Machine Learning and Clustering:
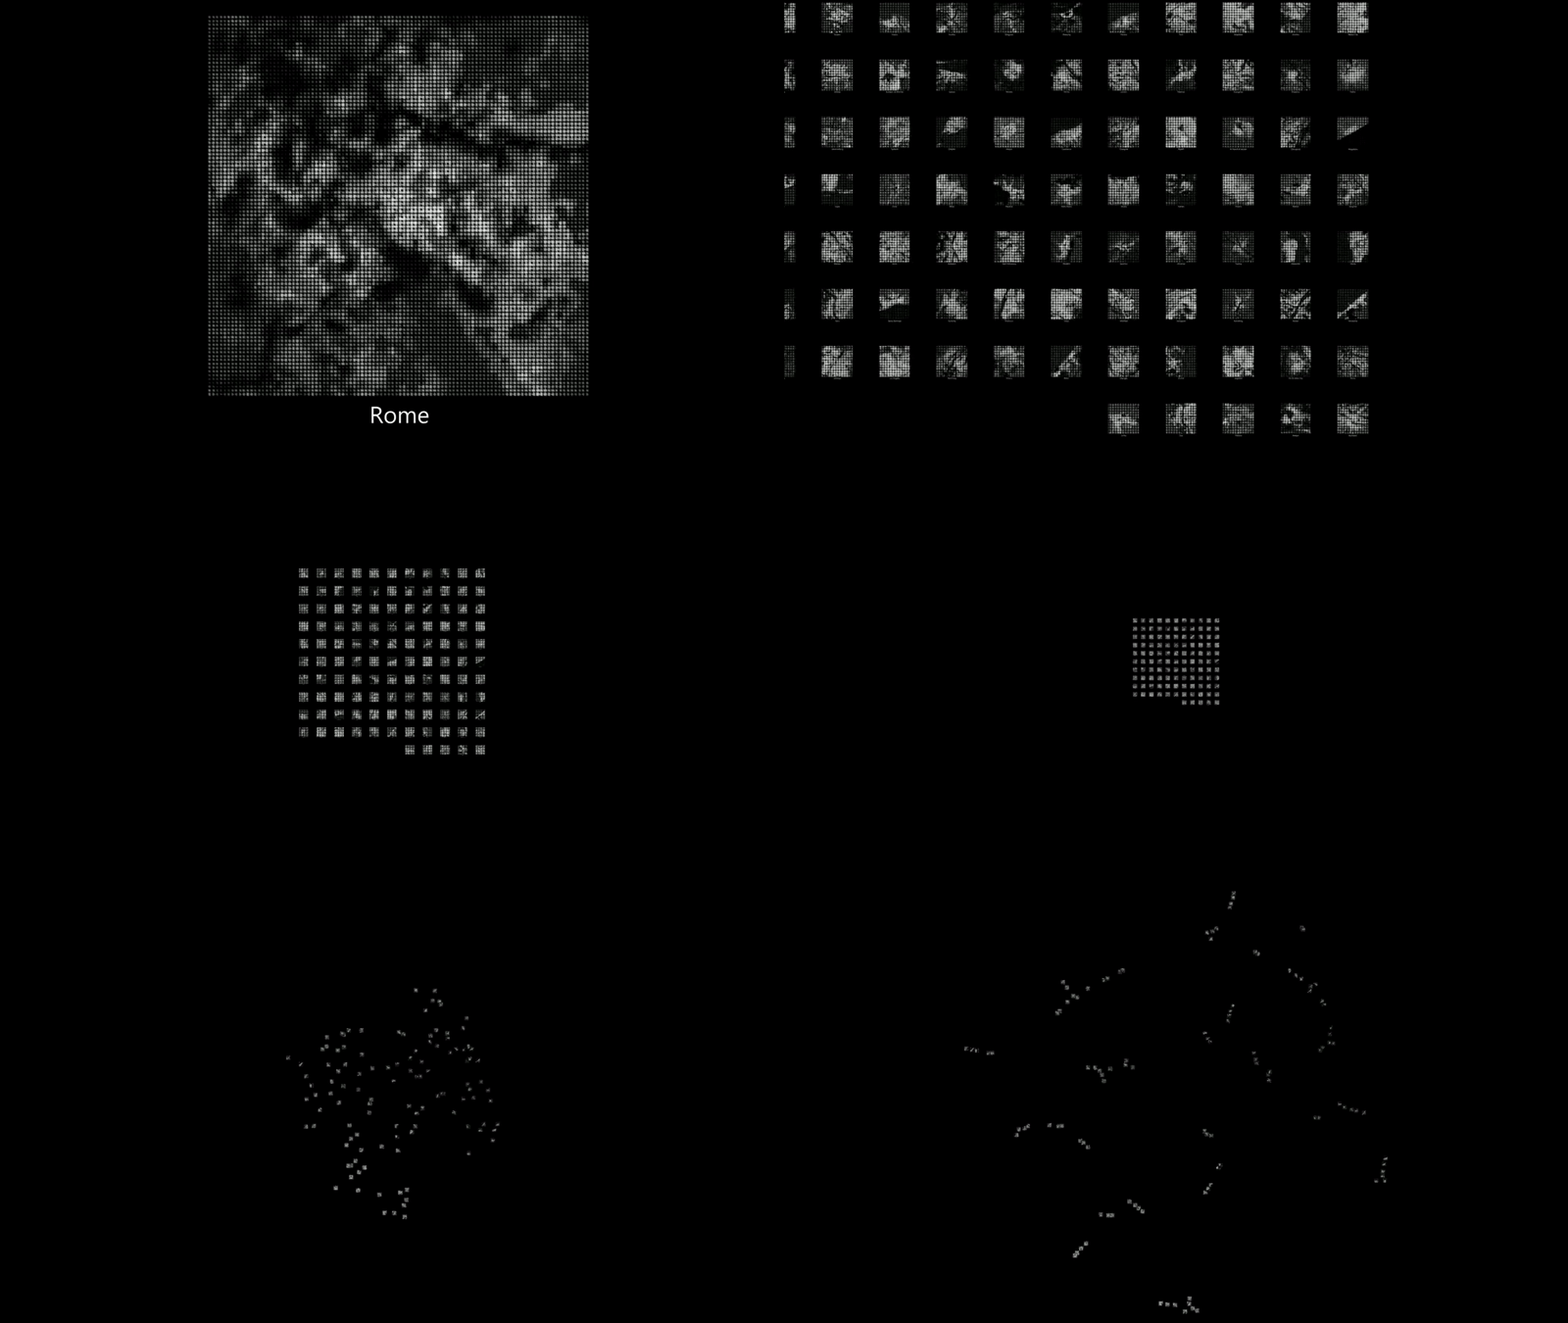
Categorizing the maps was a huge task and the prowess of machine learning were quite insightful in this chapter. We started with unsupervised machine learning and feed with heat archipelagos map.
Heat archipelagos:
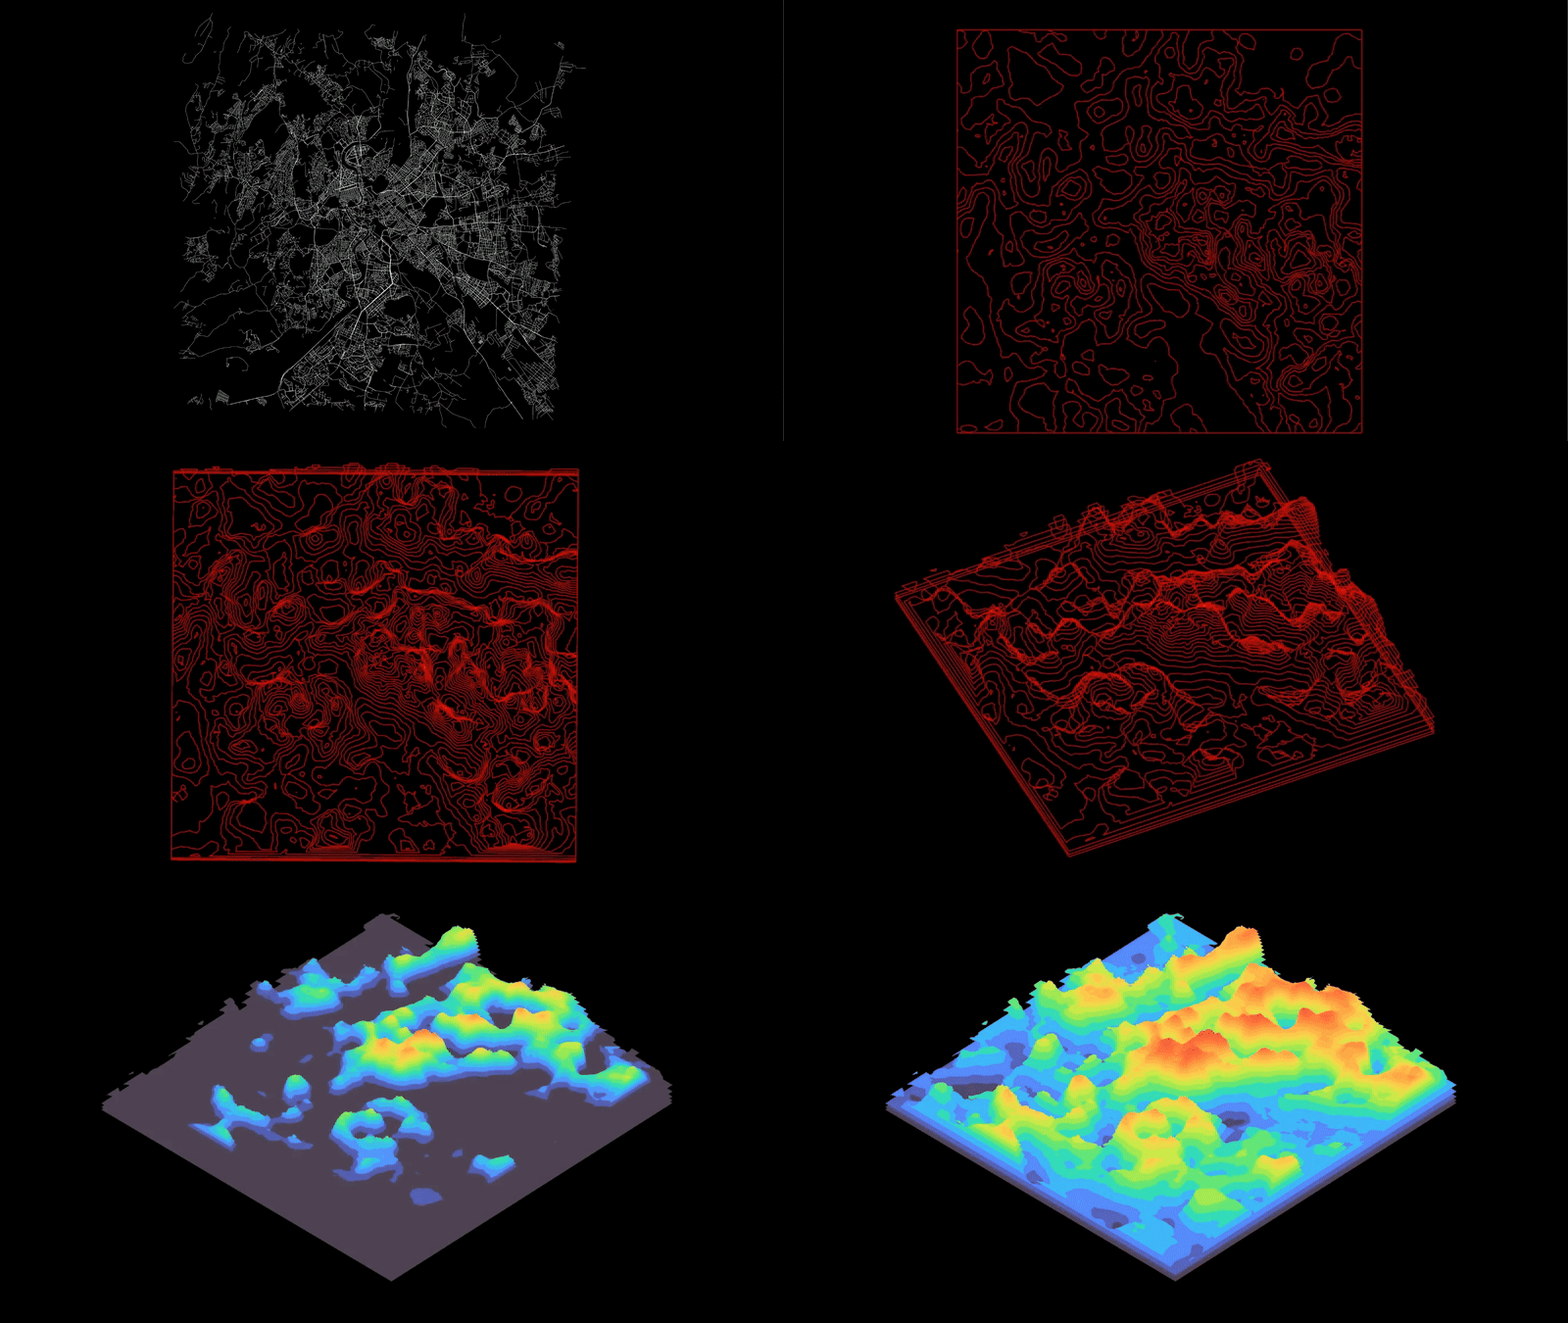
Major strategy of using the machine learning is to categorize the shapes of heat in the city. This was achieved by converting the binary maps of city into archipelagos (contour) model by grouping the points based on values.
Clusters and analysis:
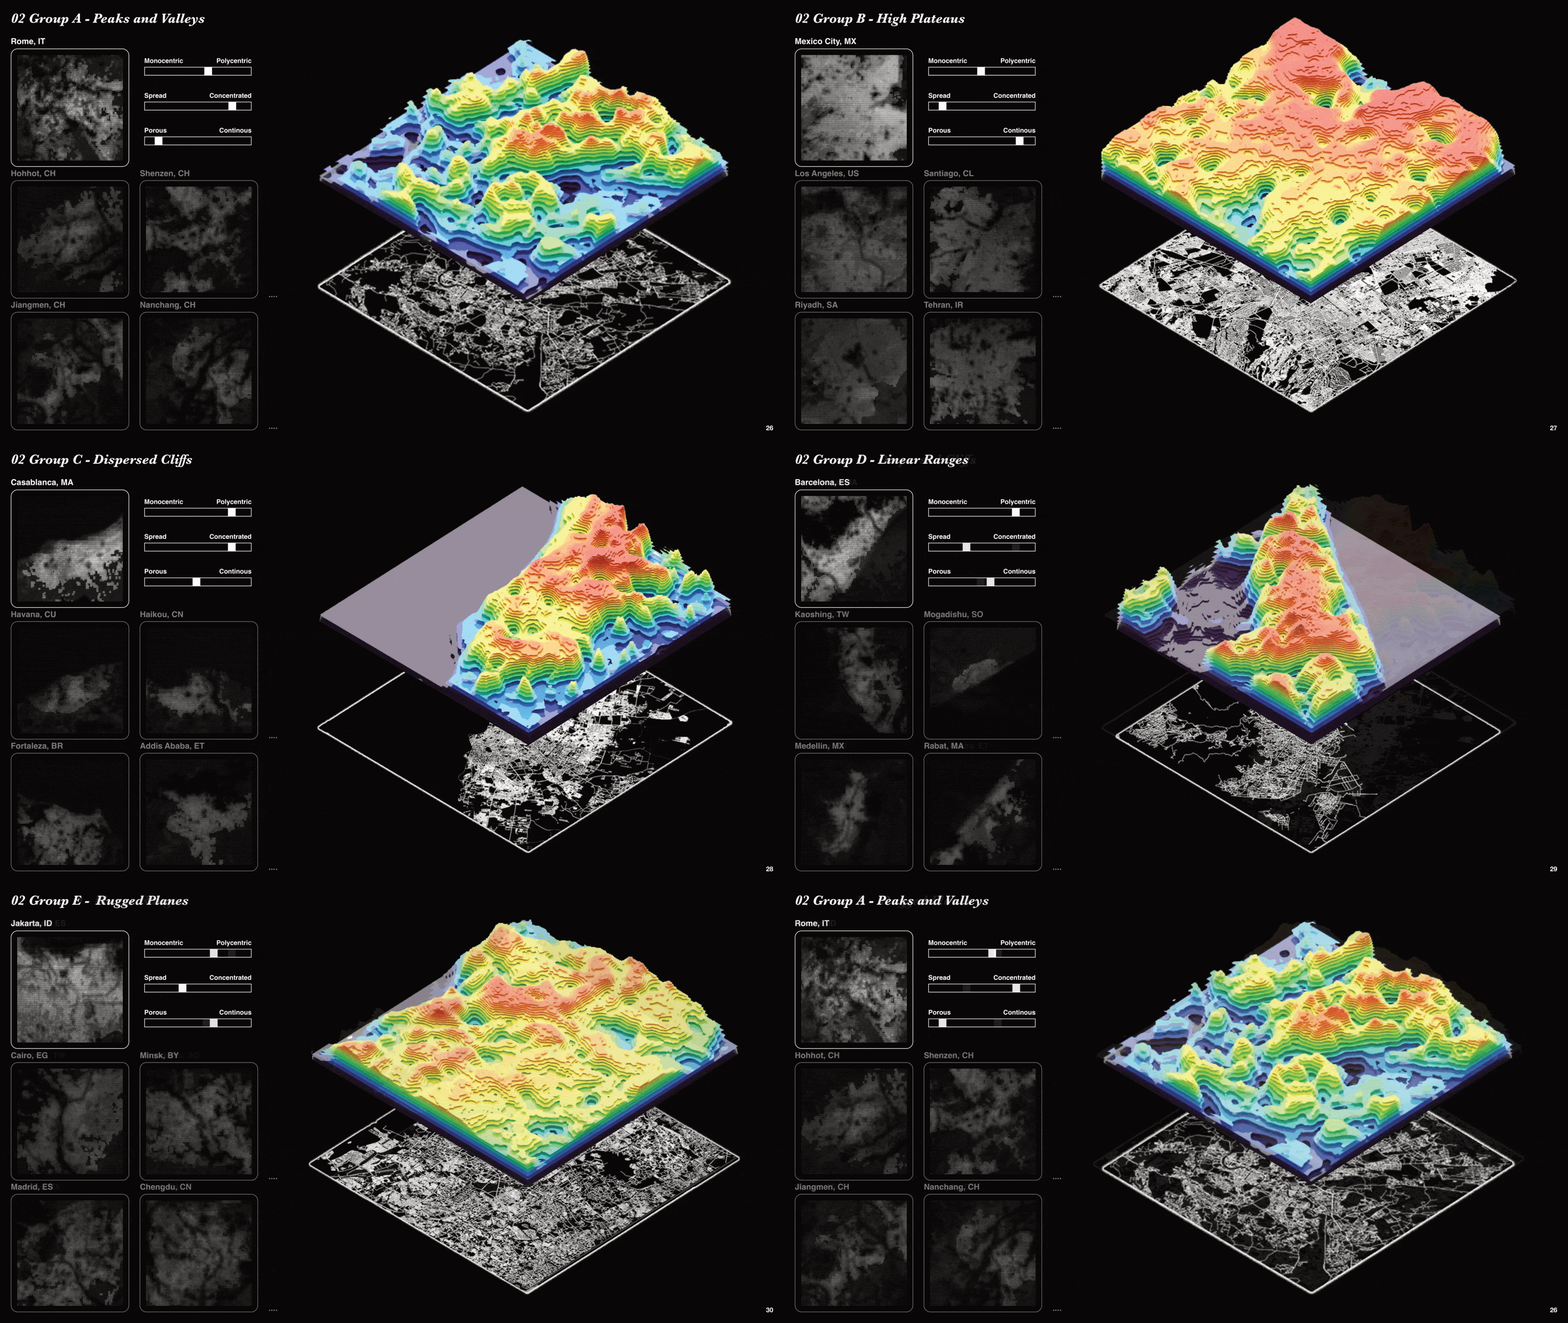
One city from 5 clusters were picked and modeled as to study the distribution, concentration and other attributes of heat archipelagos in the city.
Open Ends:
The study of different shapes were intended to create path defining approach specific to each cluster and investigate various methods of mitigating heat.
- Adaptable, ad-hoc assessments of the status quo of heat
- Conversations among cities with similar geometries of heat
- Starting point for strategic heat adaption
Strategic adaption: Perforation
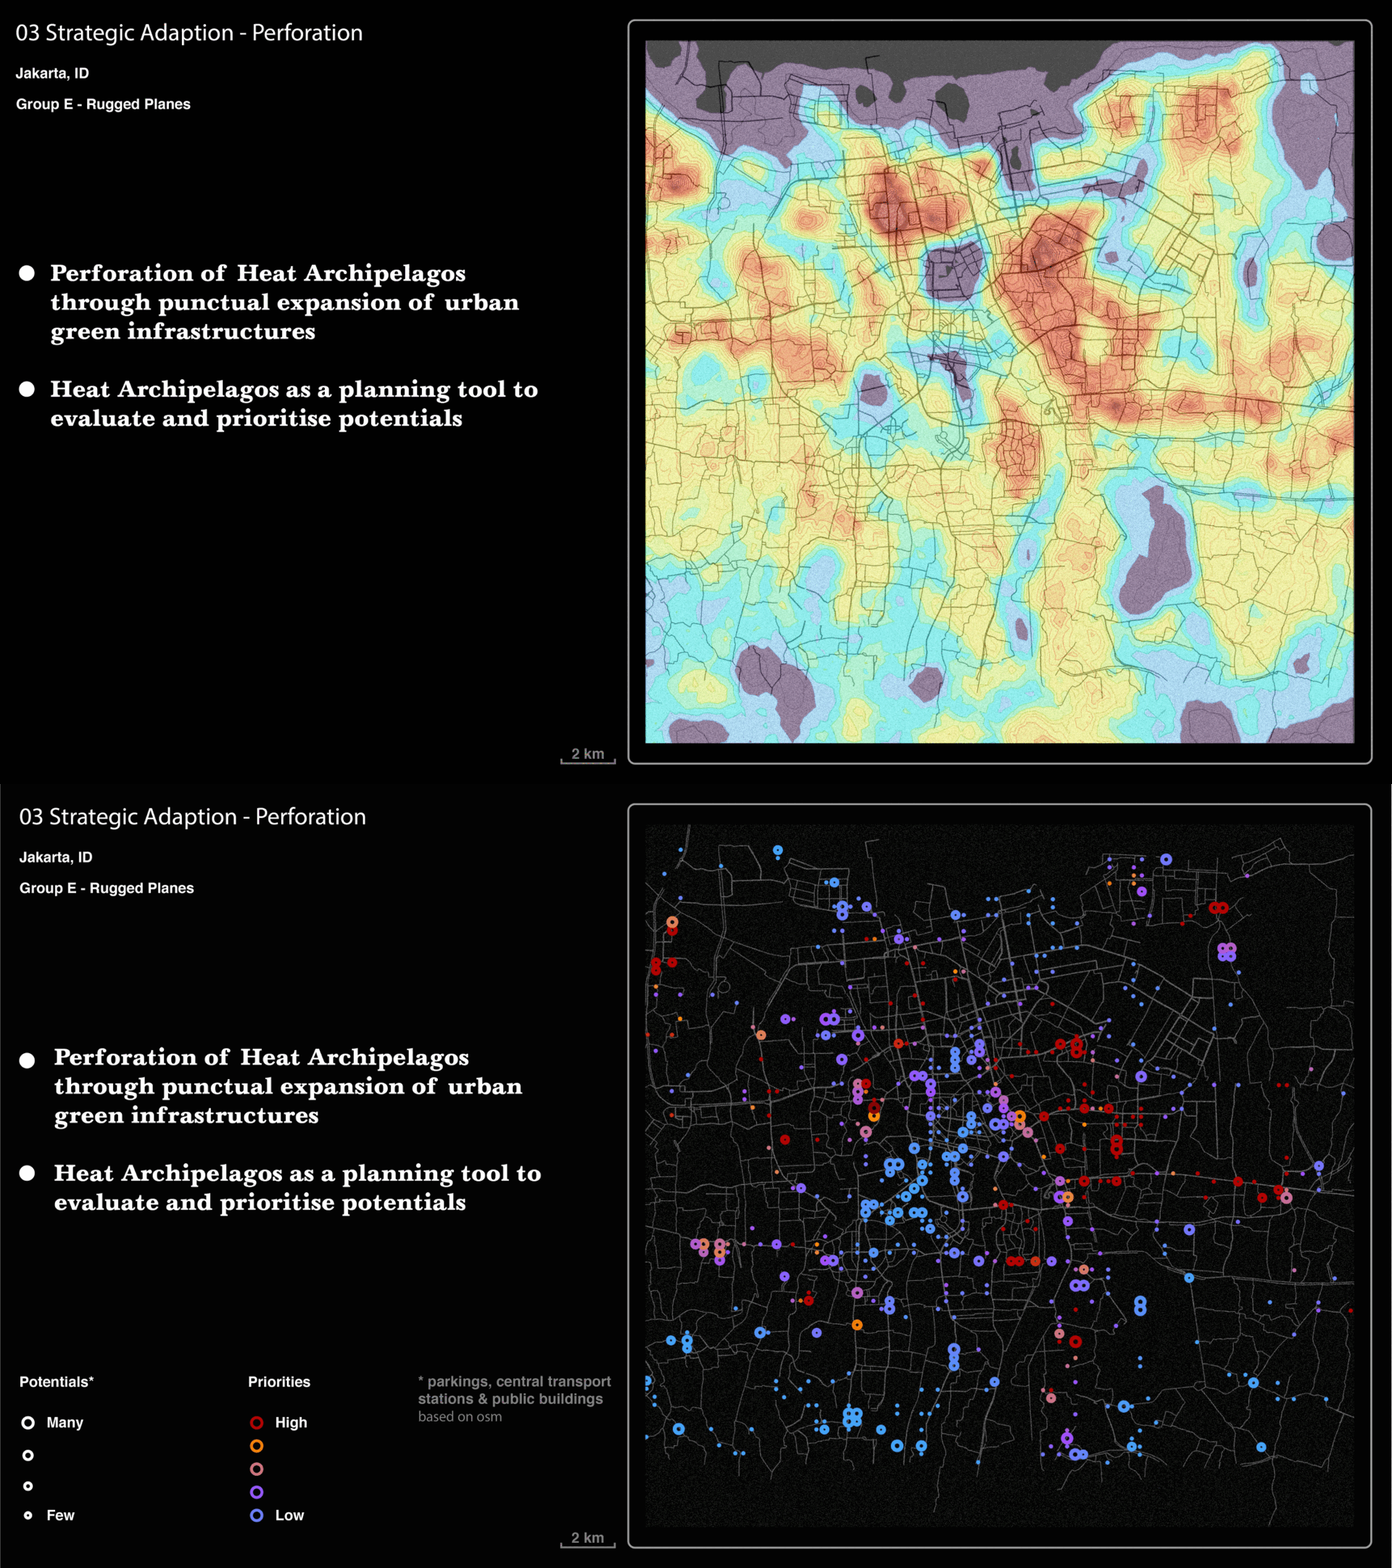
From the cities we studies, we choose two typologies in order to experiment further with the approaches. One of our approach was perforation of heat archipelagos when there is wide spread, polycentric shape. We implied this model on Jakarta, Indonesia.
Strategic adaption: De-clustering
For the cities with linear polycentric distribution of heat, we approached a new nascent way of de clustering the heat using through sections of heat archipelagos and potentials.
