As members of the data team for Hyperbuilding-B, we focus our integrative assignment on functional zoning and the extraction of structural and environmental data from our building zones.

Functional Zoning
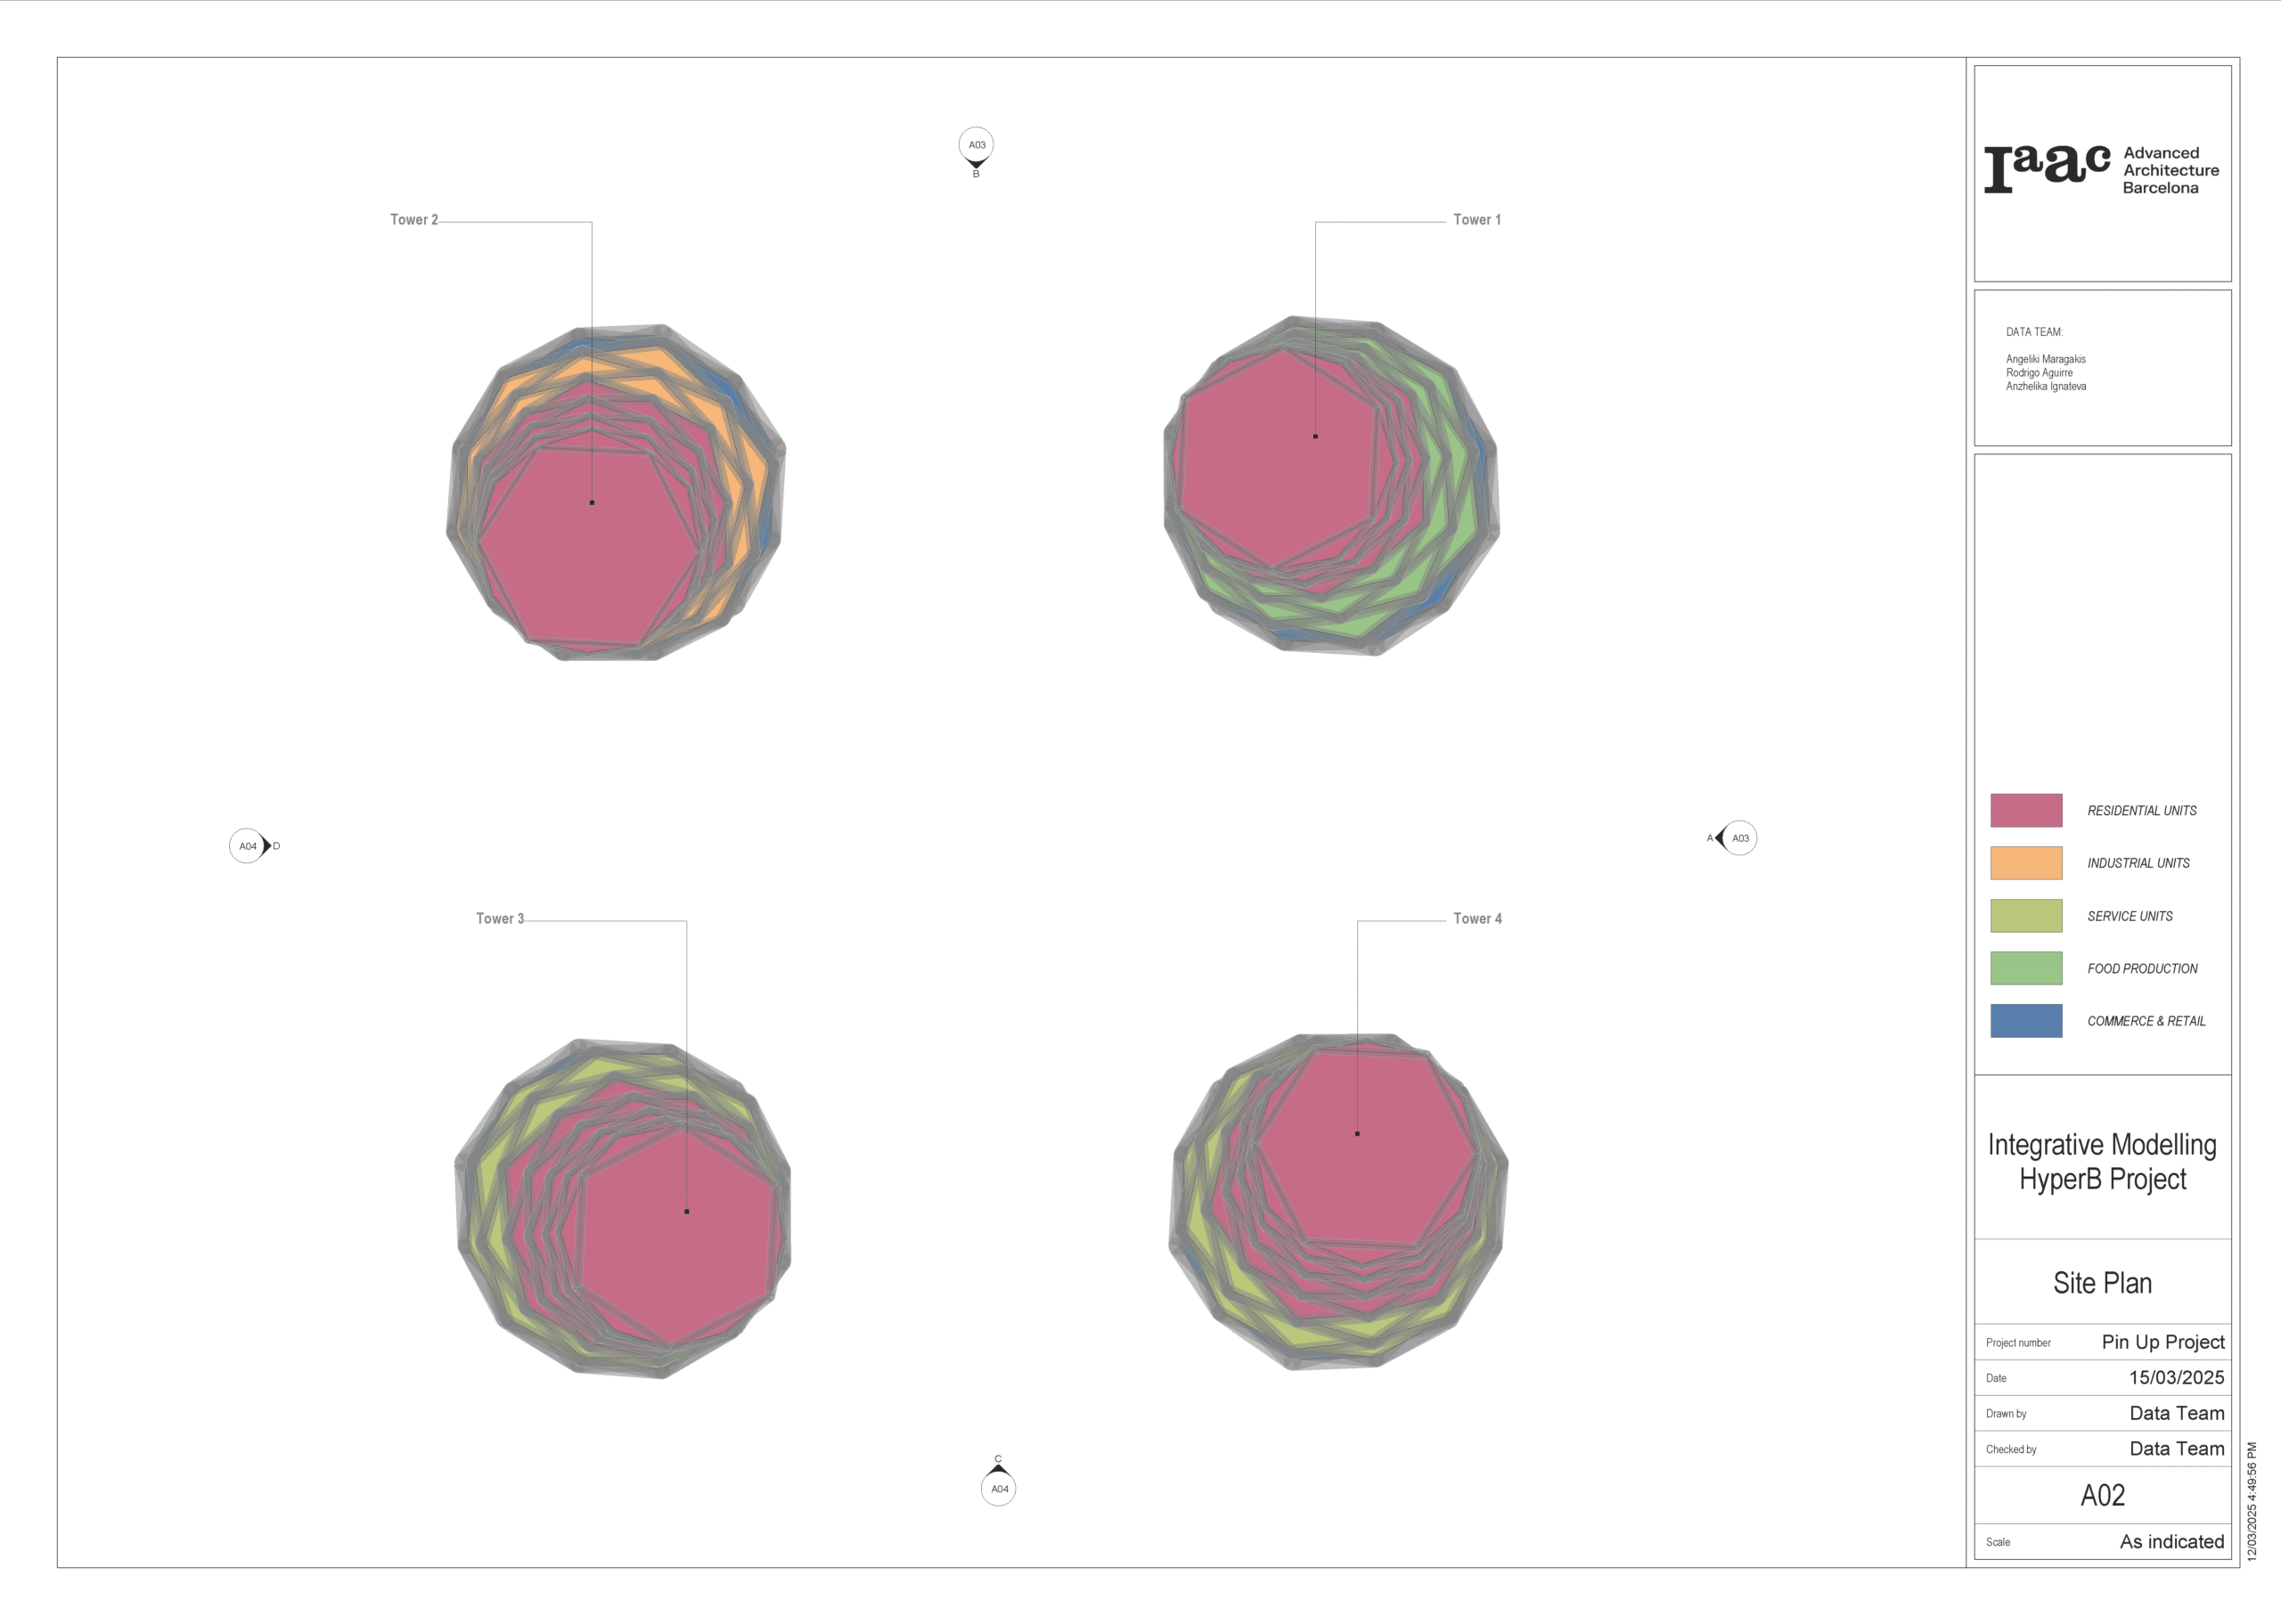
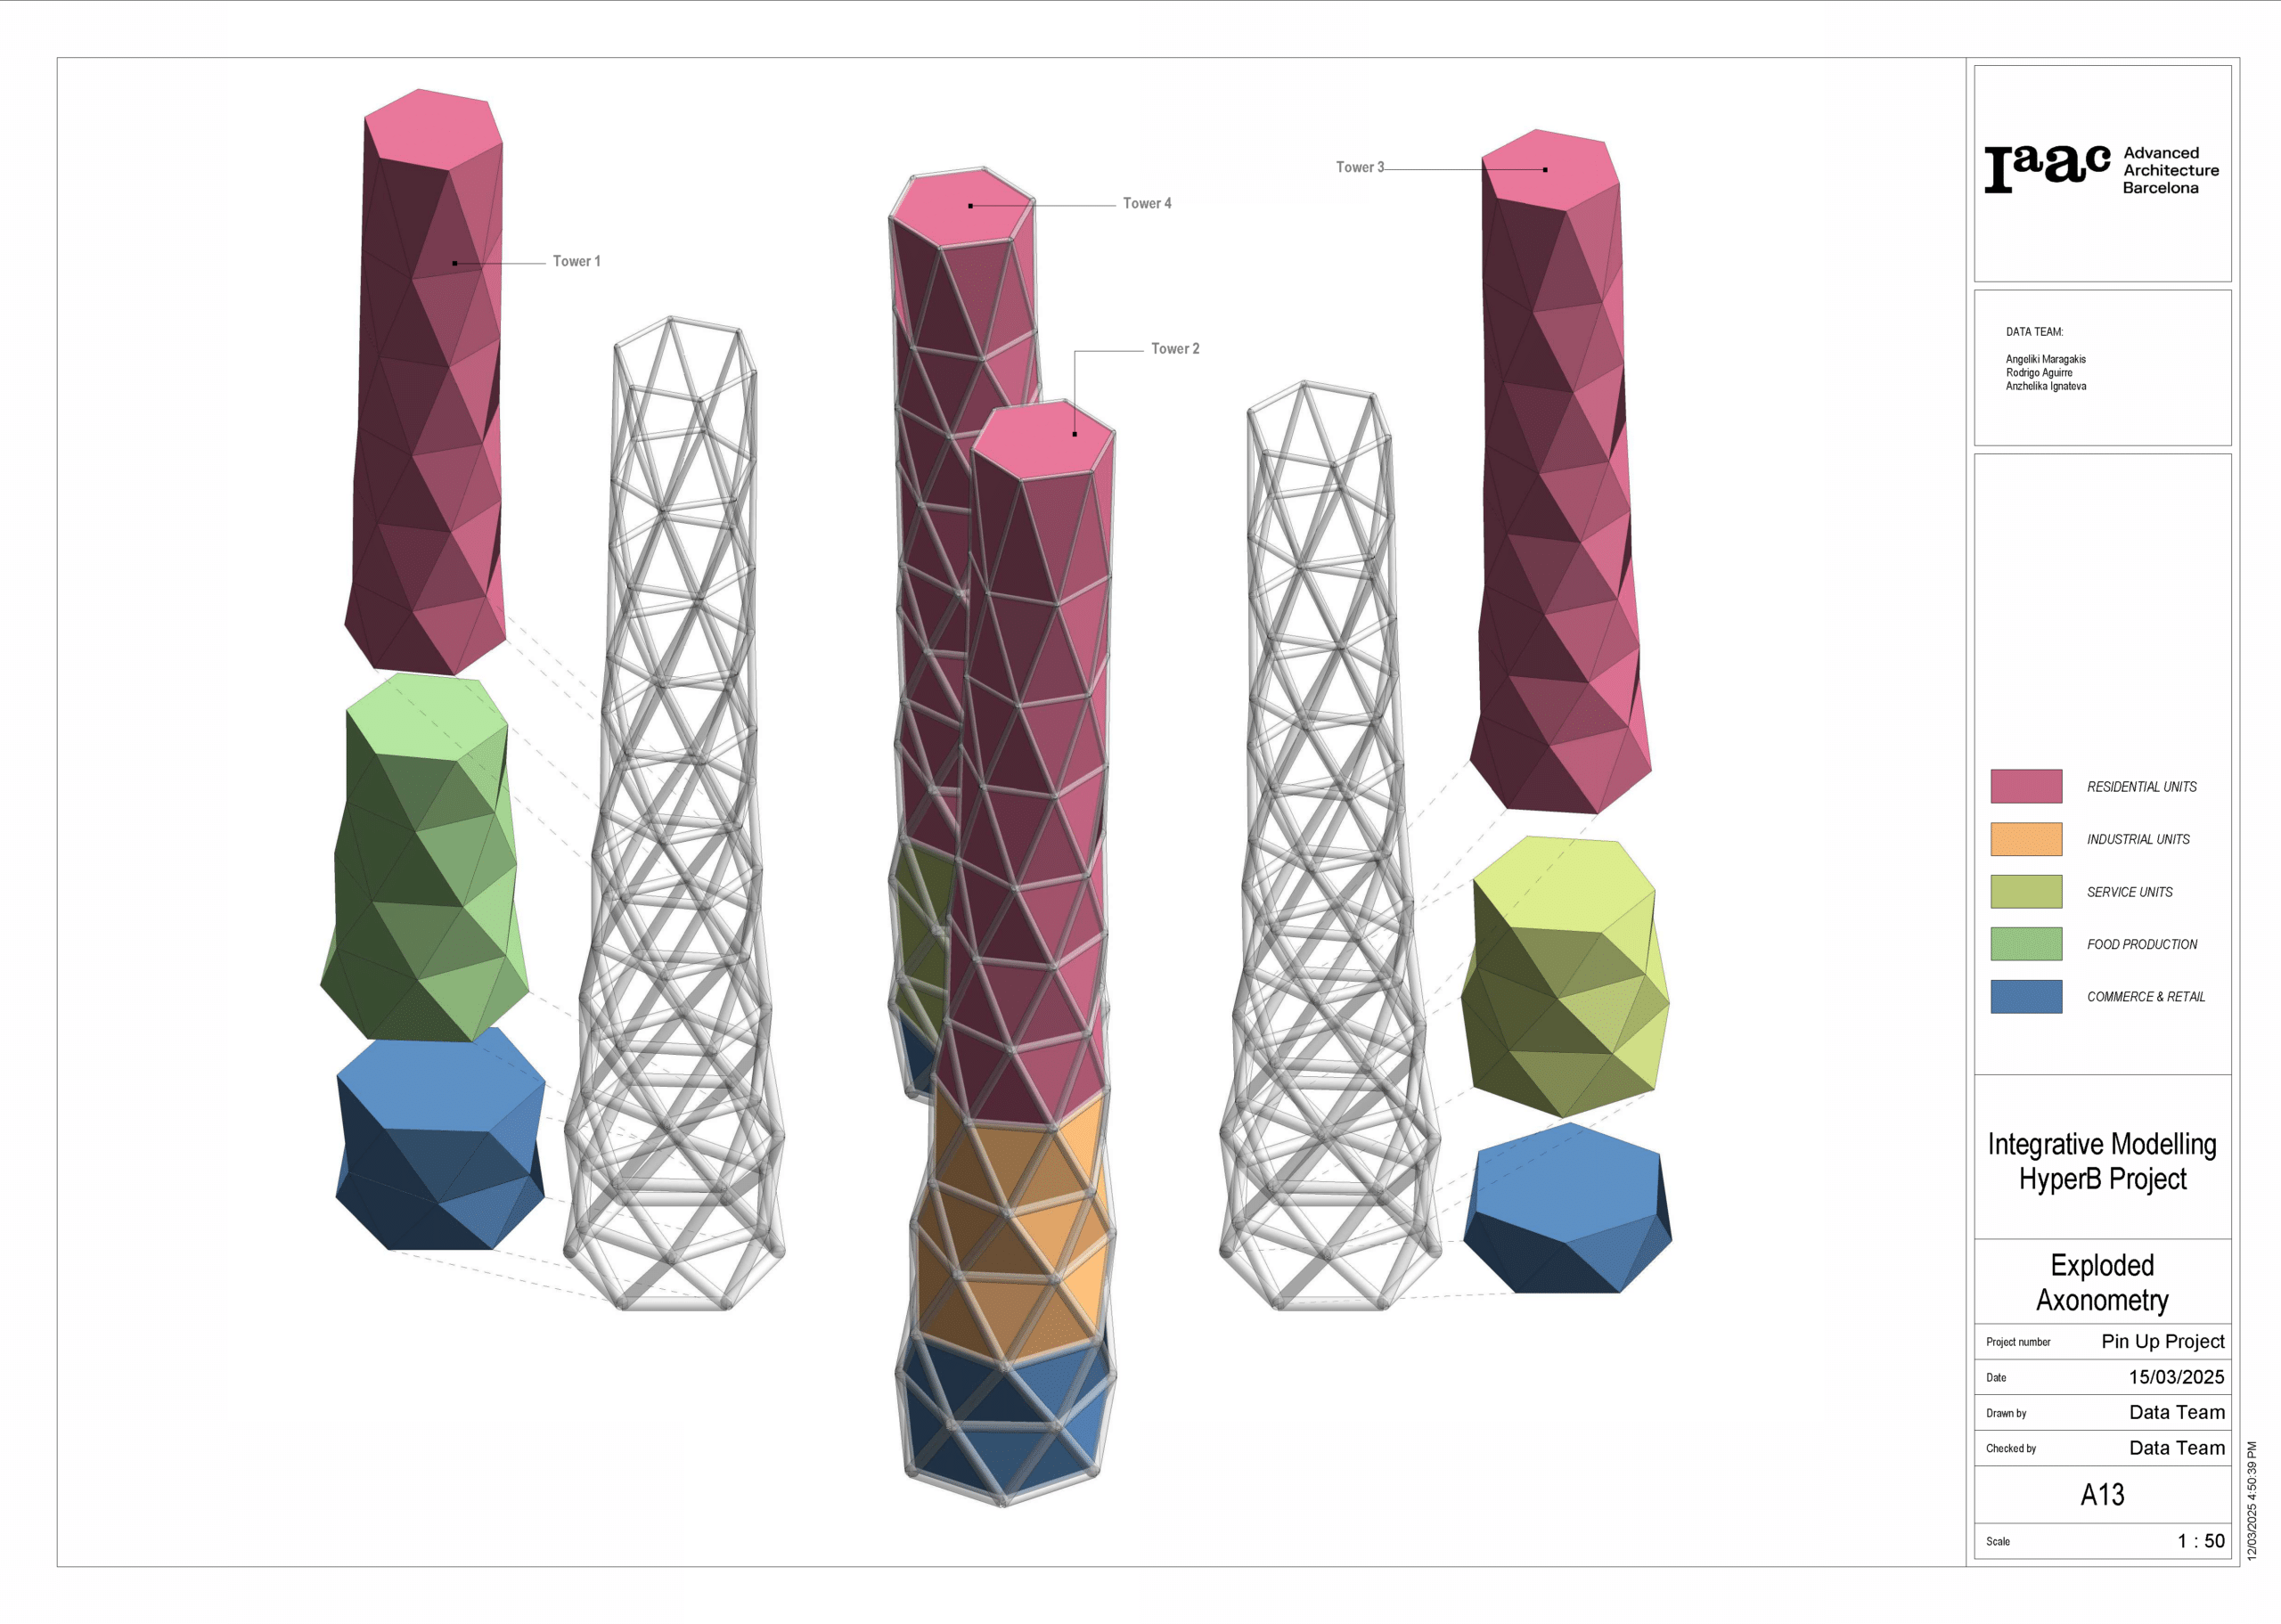
The team B hyperbuilding is a series of towers joined by lower floor podiums and bridges of fluid forms that all follow the same structural logic, resulting in a cohesive system. For this assignment, we omit the podium and bridges, focusing on the towers to suggest zoning dispersions for residential, industrial, service, food production, and commerce units.
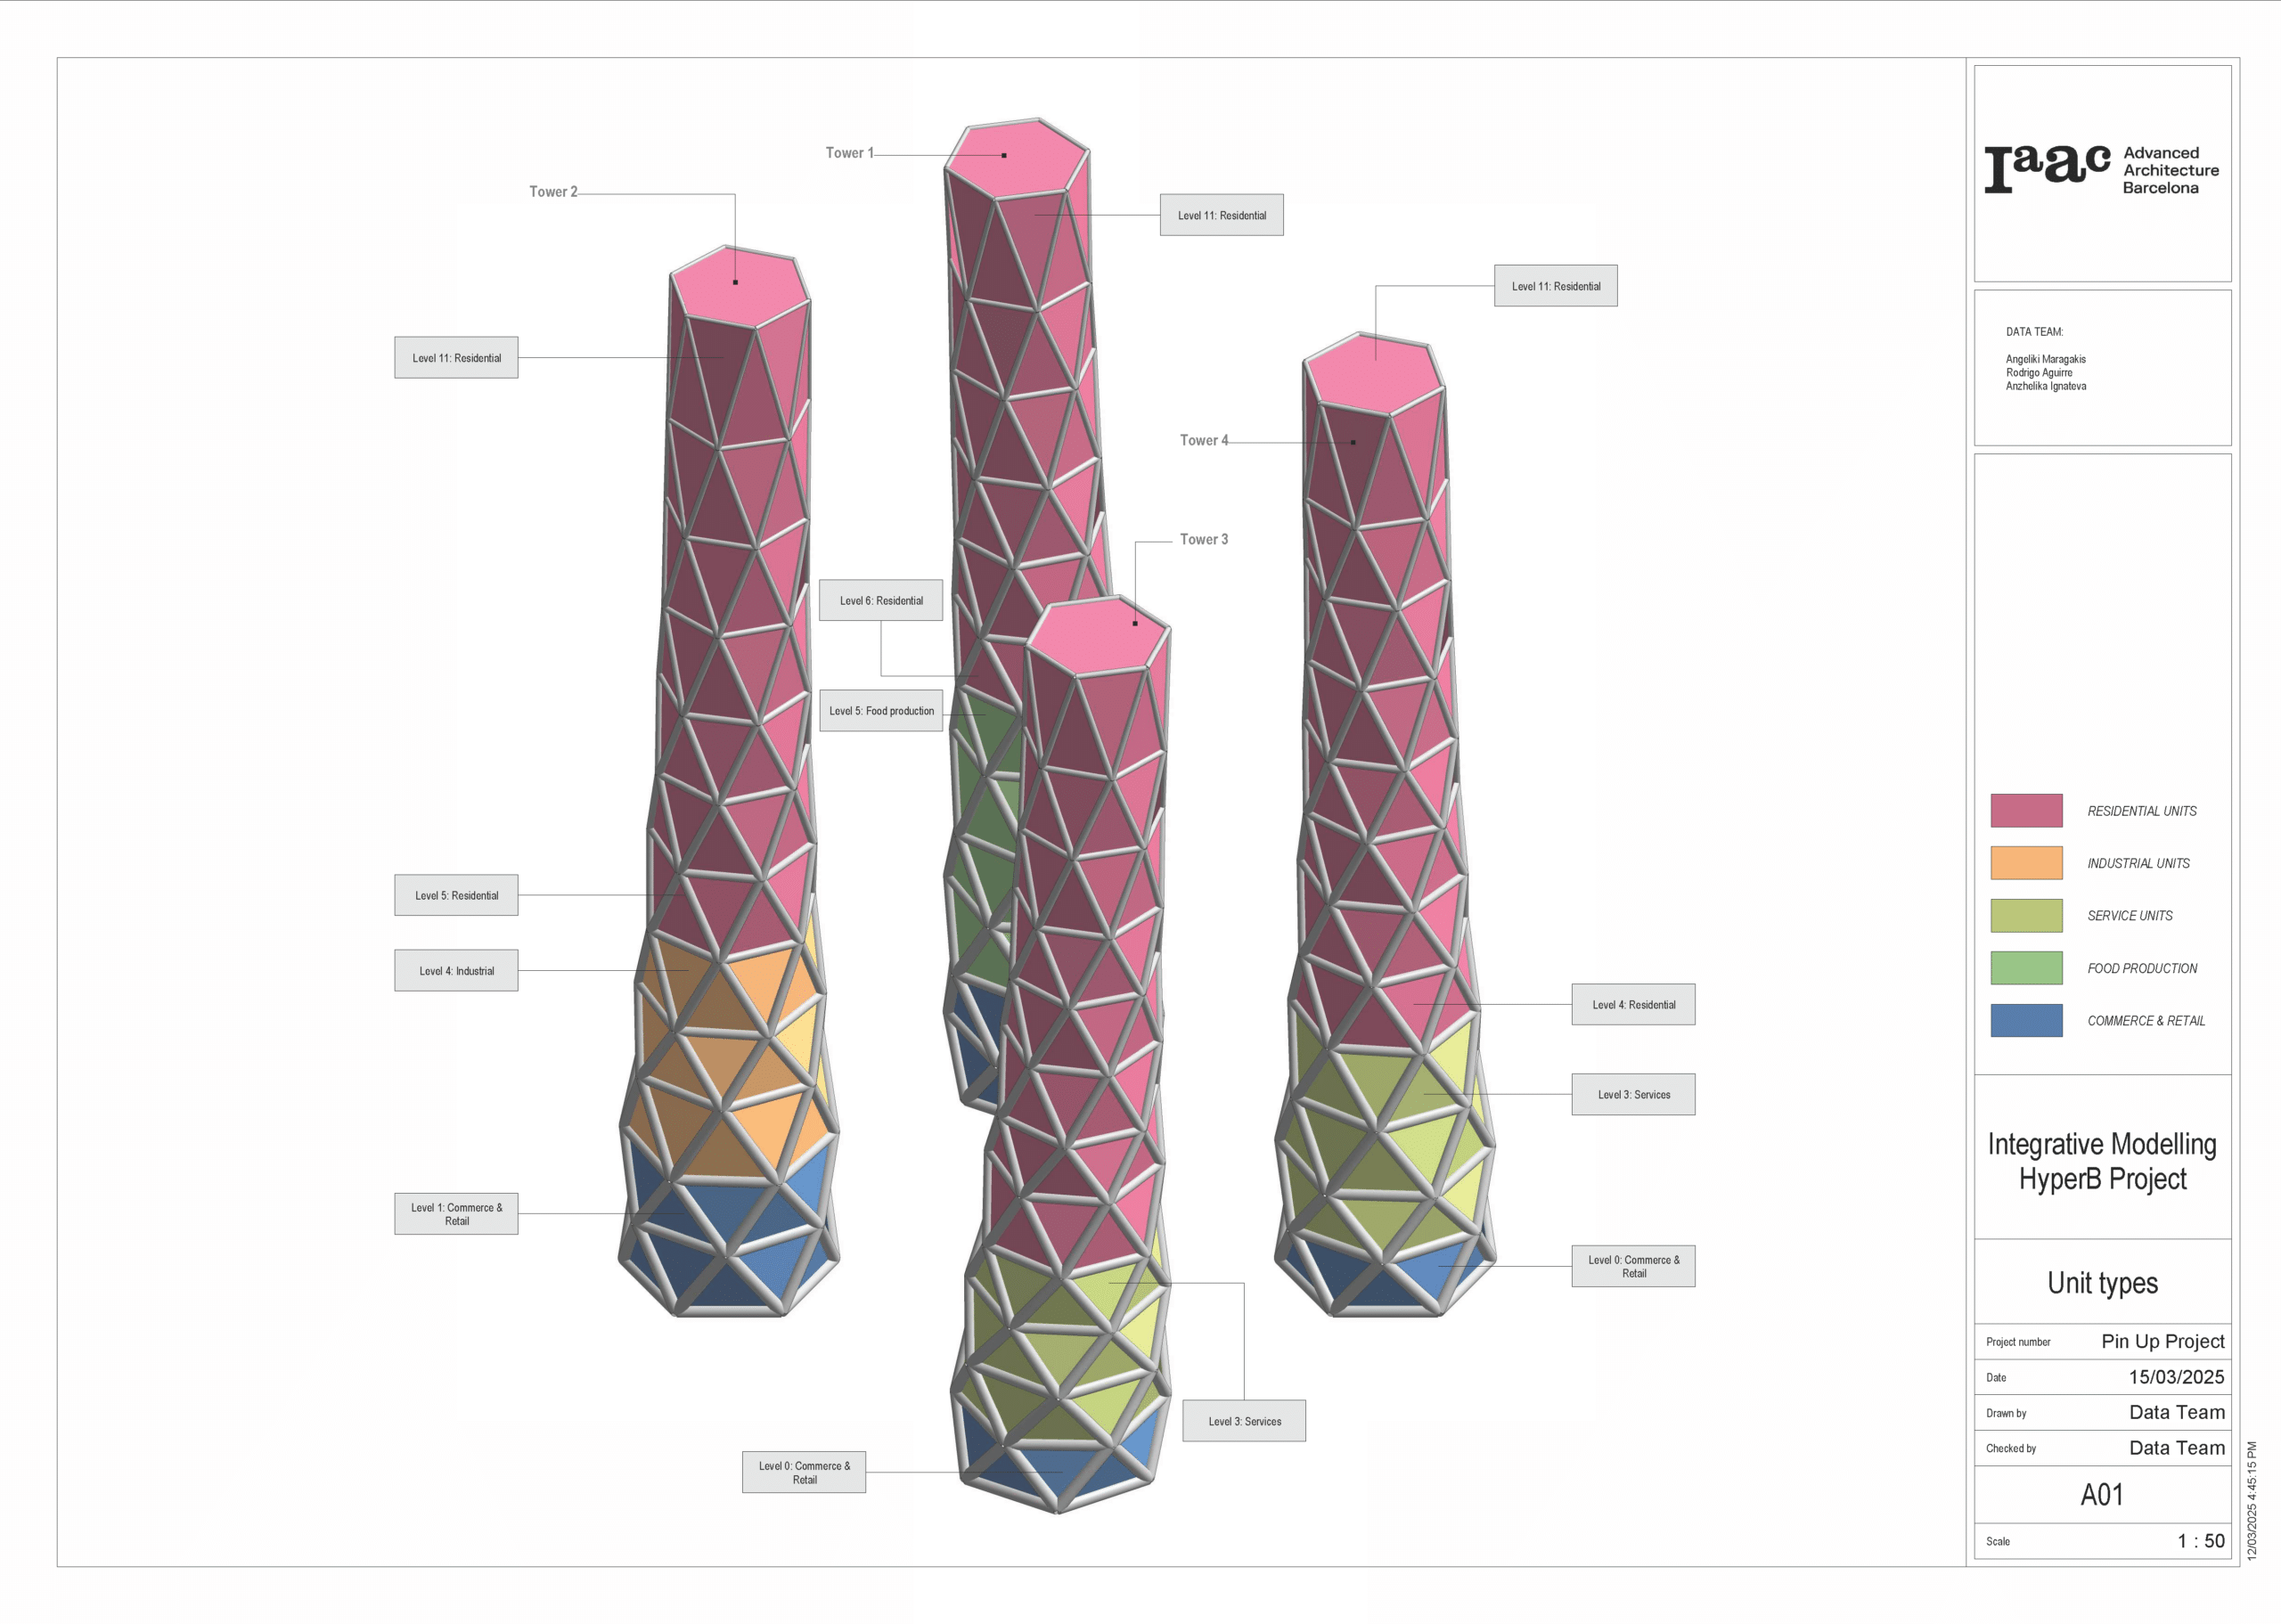
These towers have a fractal facade form for panel standardisation and adjacencies between functions are placed according to an adjacency matrix developed by the service team. The zoning of these elements is further informed by the relative position of each tower with regards to solar performance – for example, towers that capture more solar radiation are zoned to be mostly residential to maximise the amount of favourable residential modules.
Elevations
One modelling challenge we faced with this variable zoning is the difference in floor heights between functions. Commerce and industrial zones require taller floor-to-floor heights than residential zones to accomodate infrastructure. This meant that we have to adapt our approach to the building levels in Revit per tower rather than as a one-size-fits-all approach.
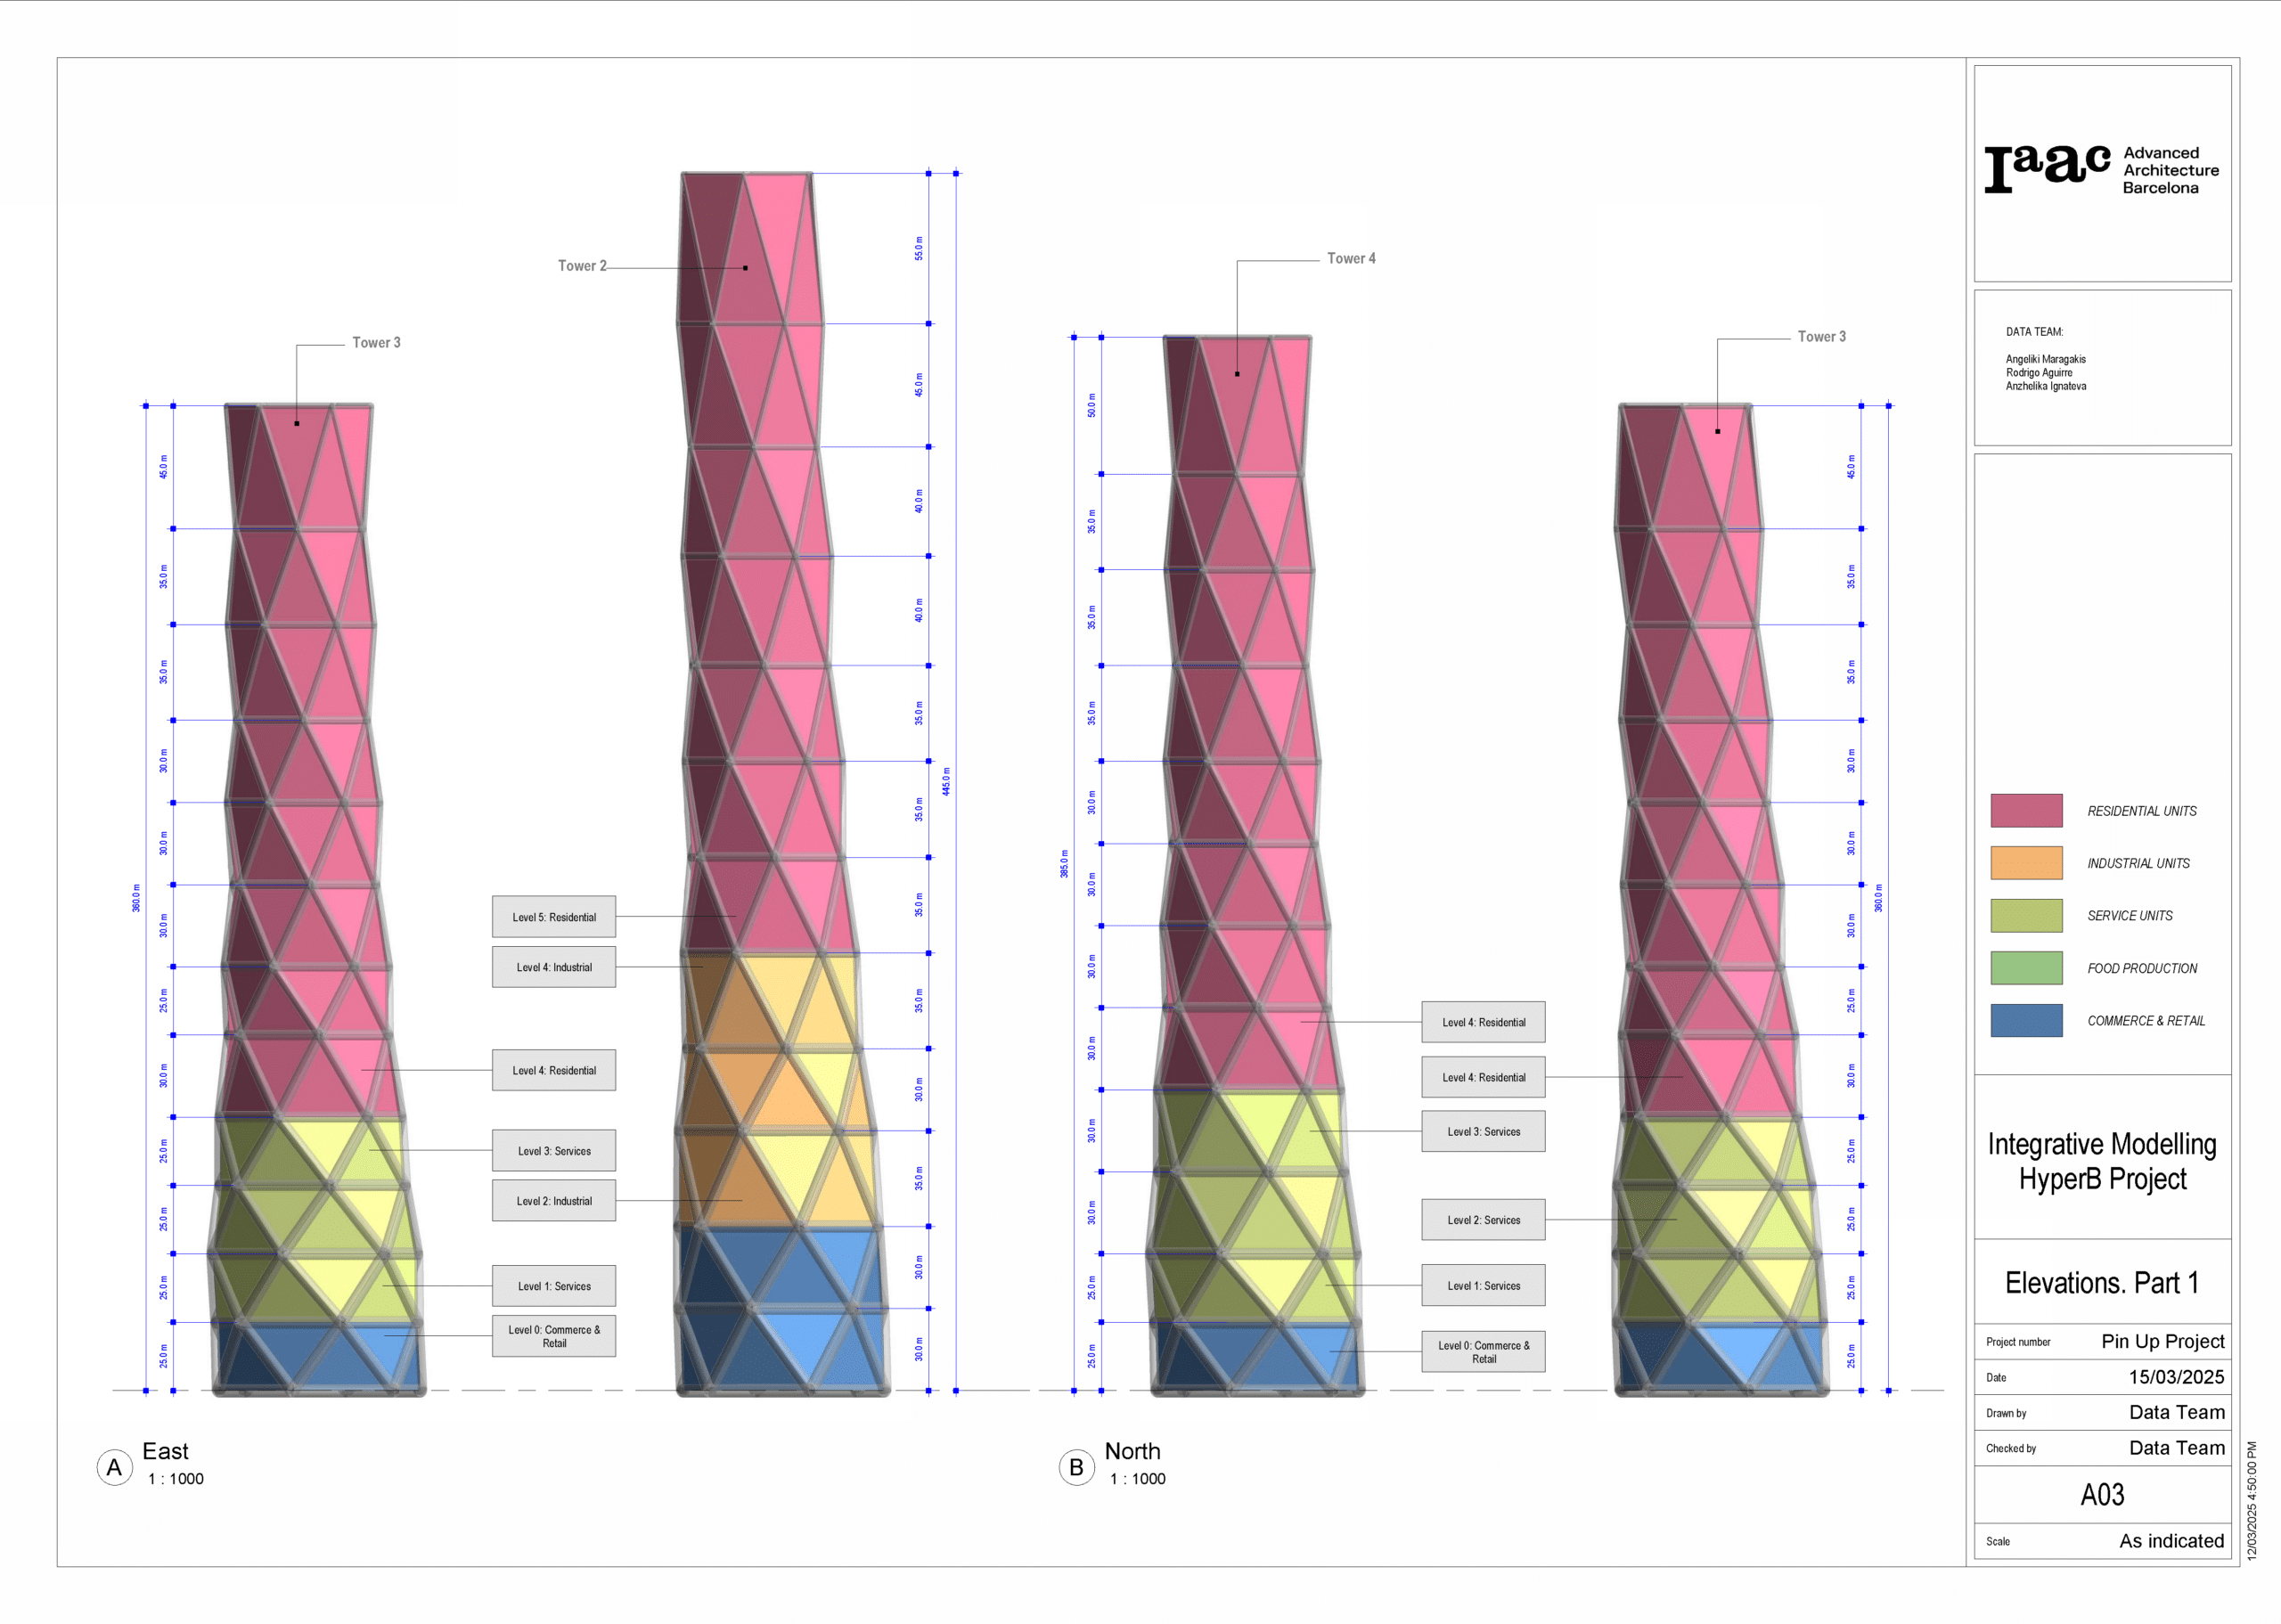
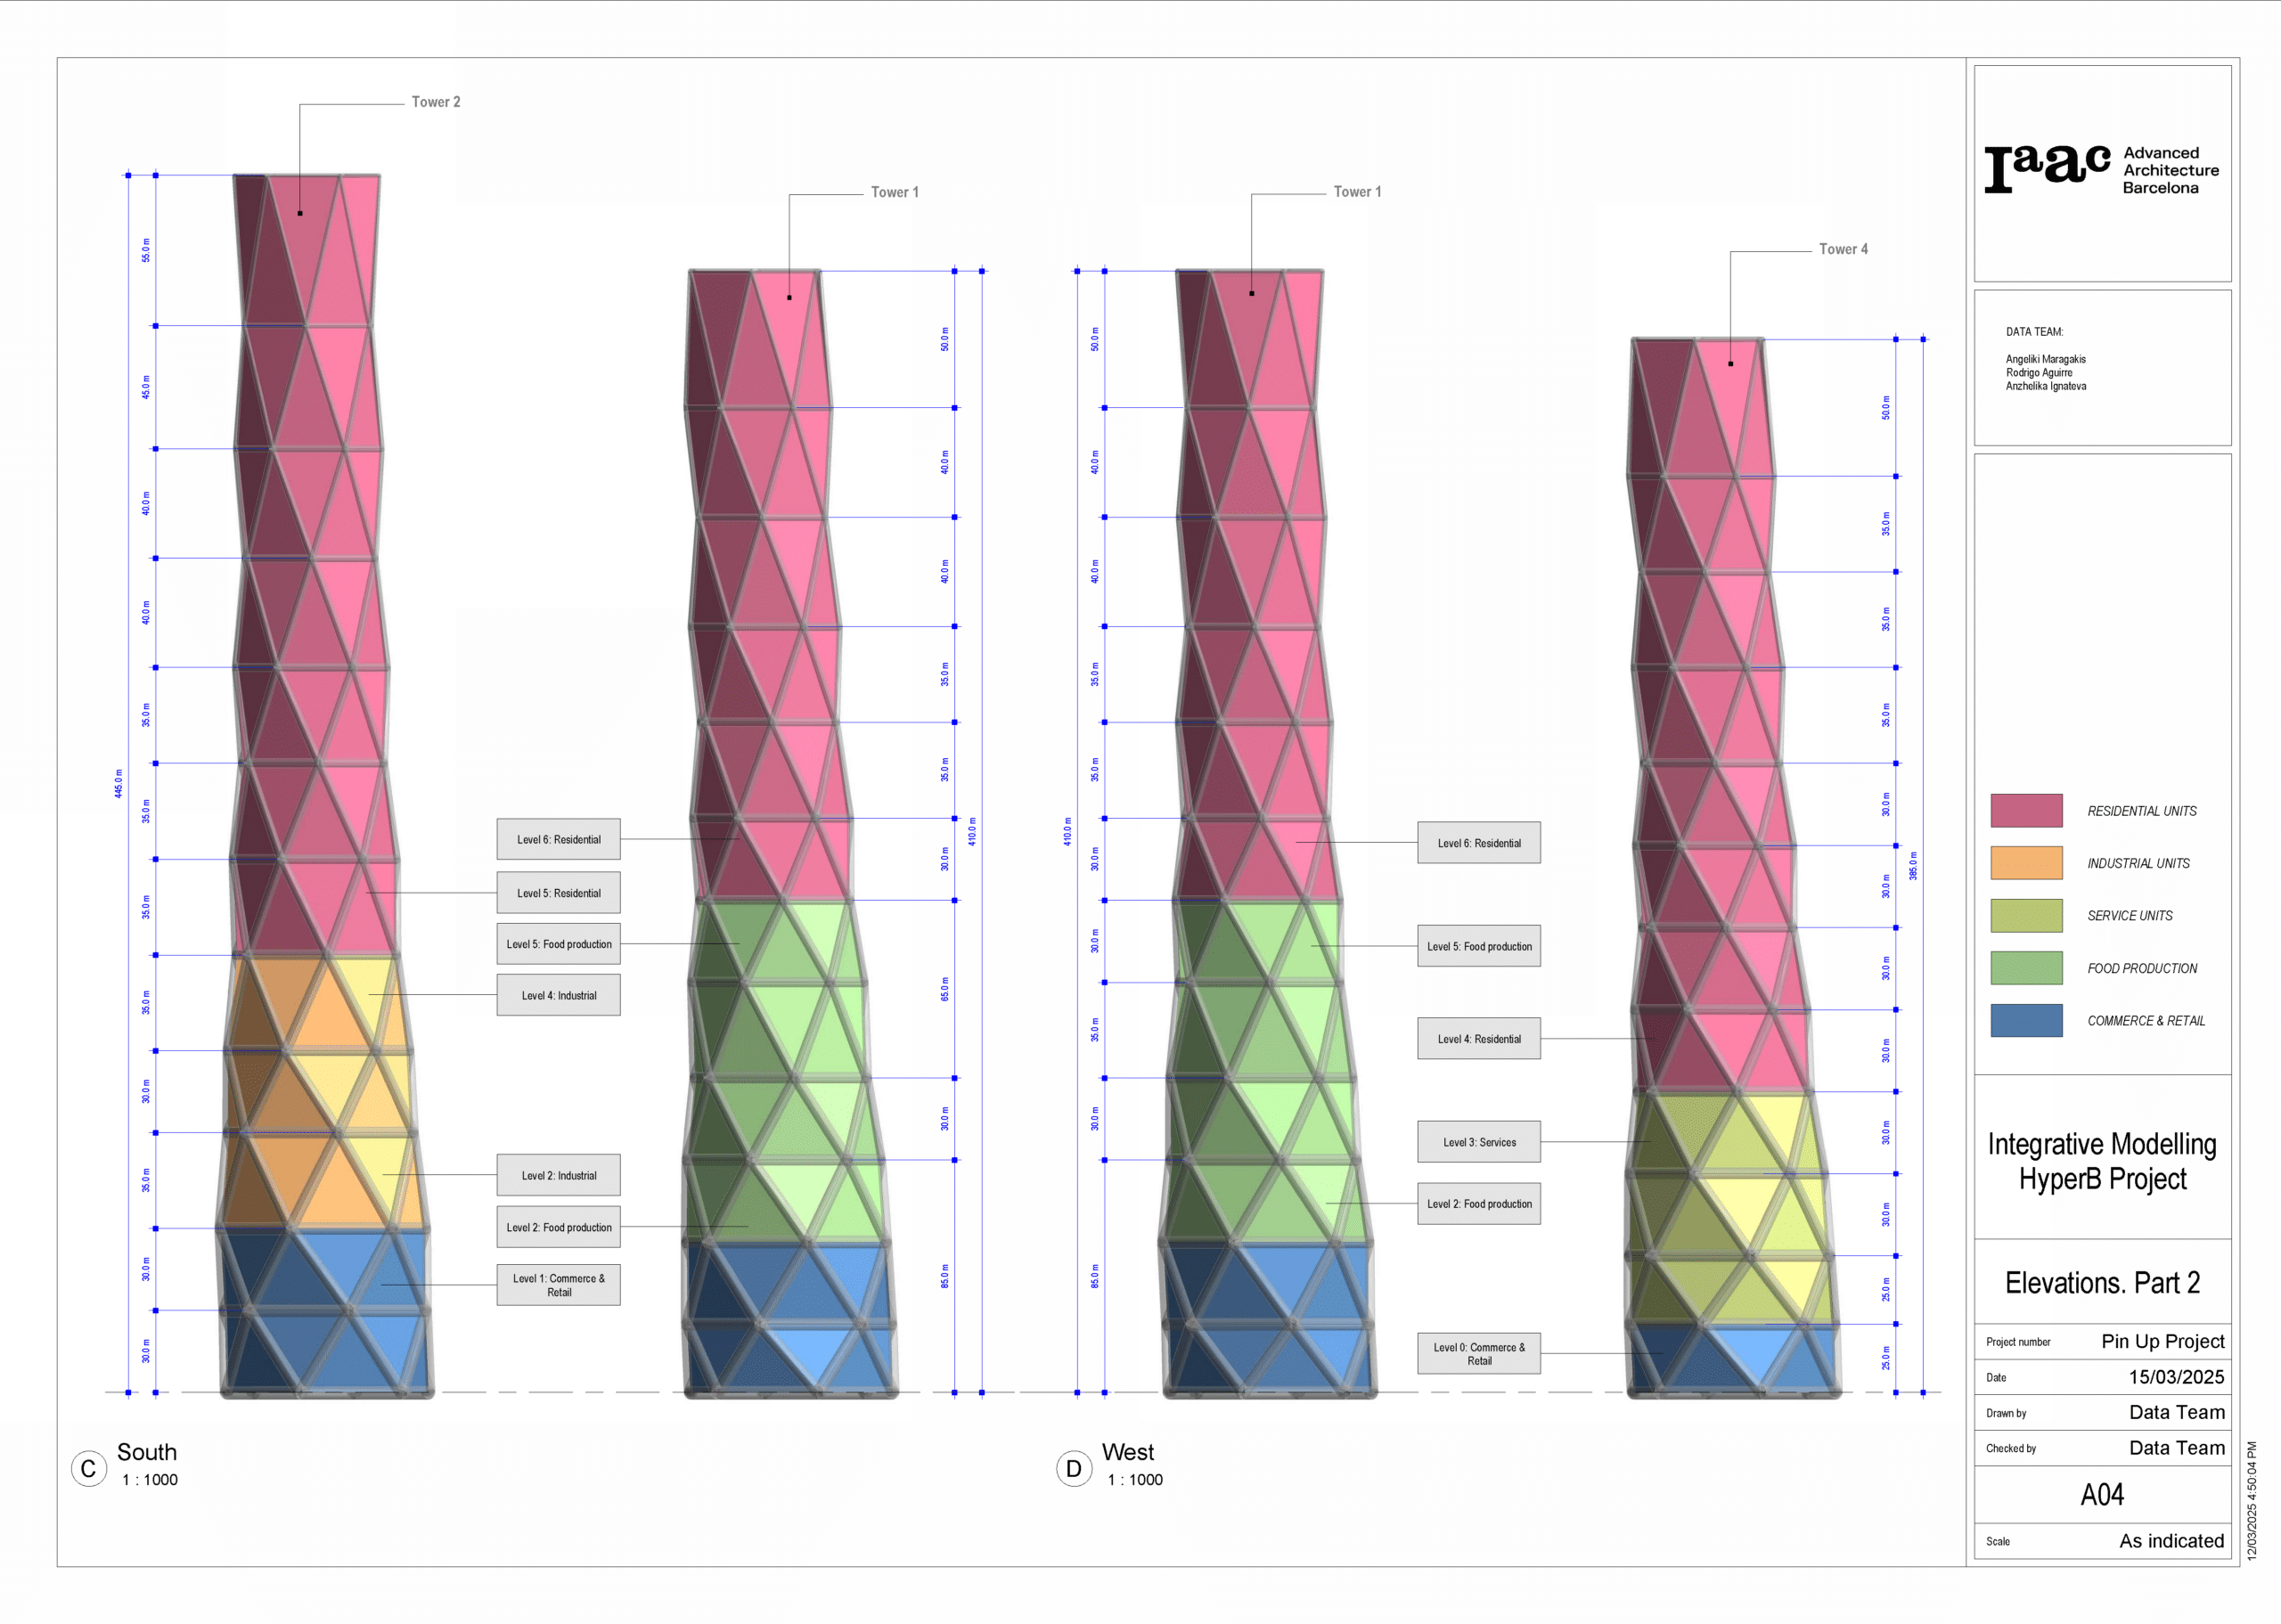
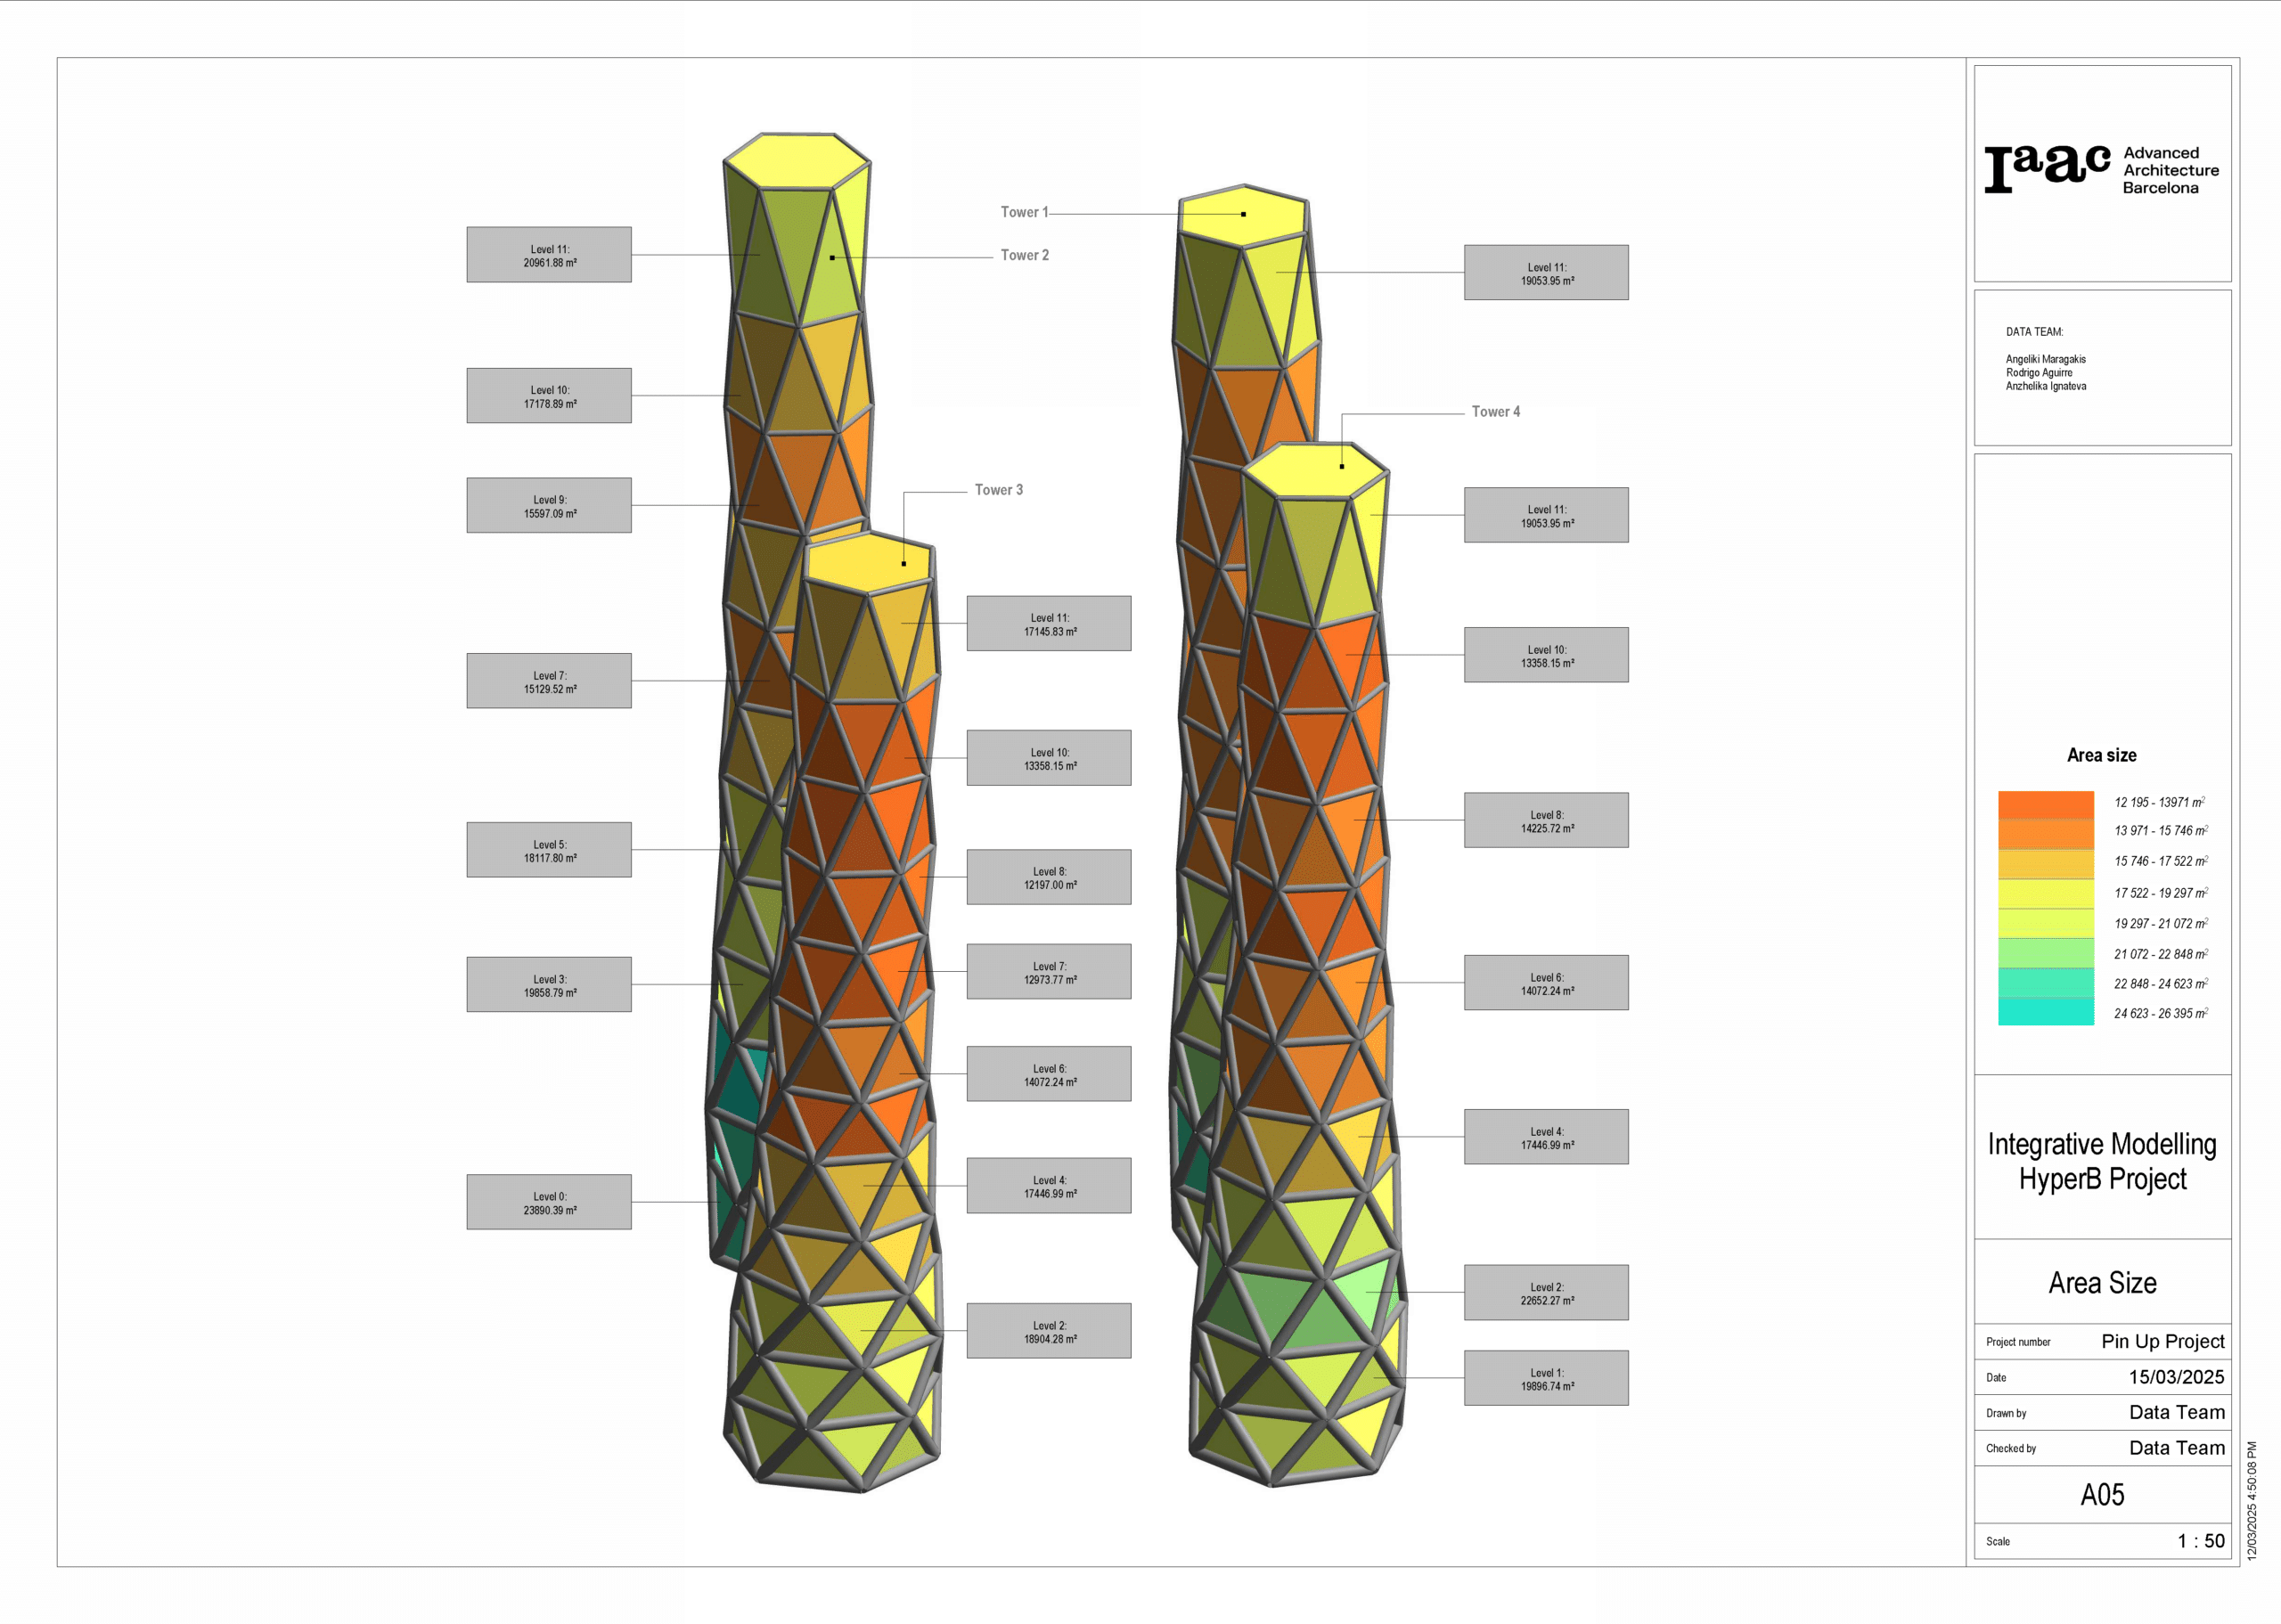
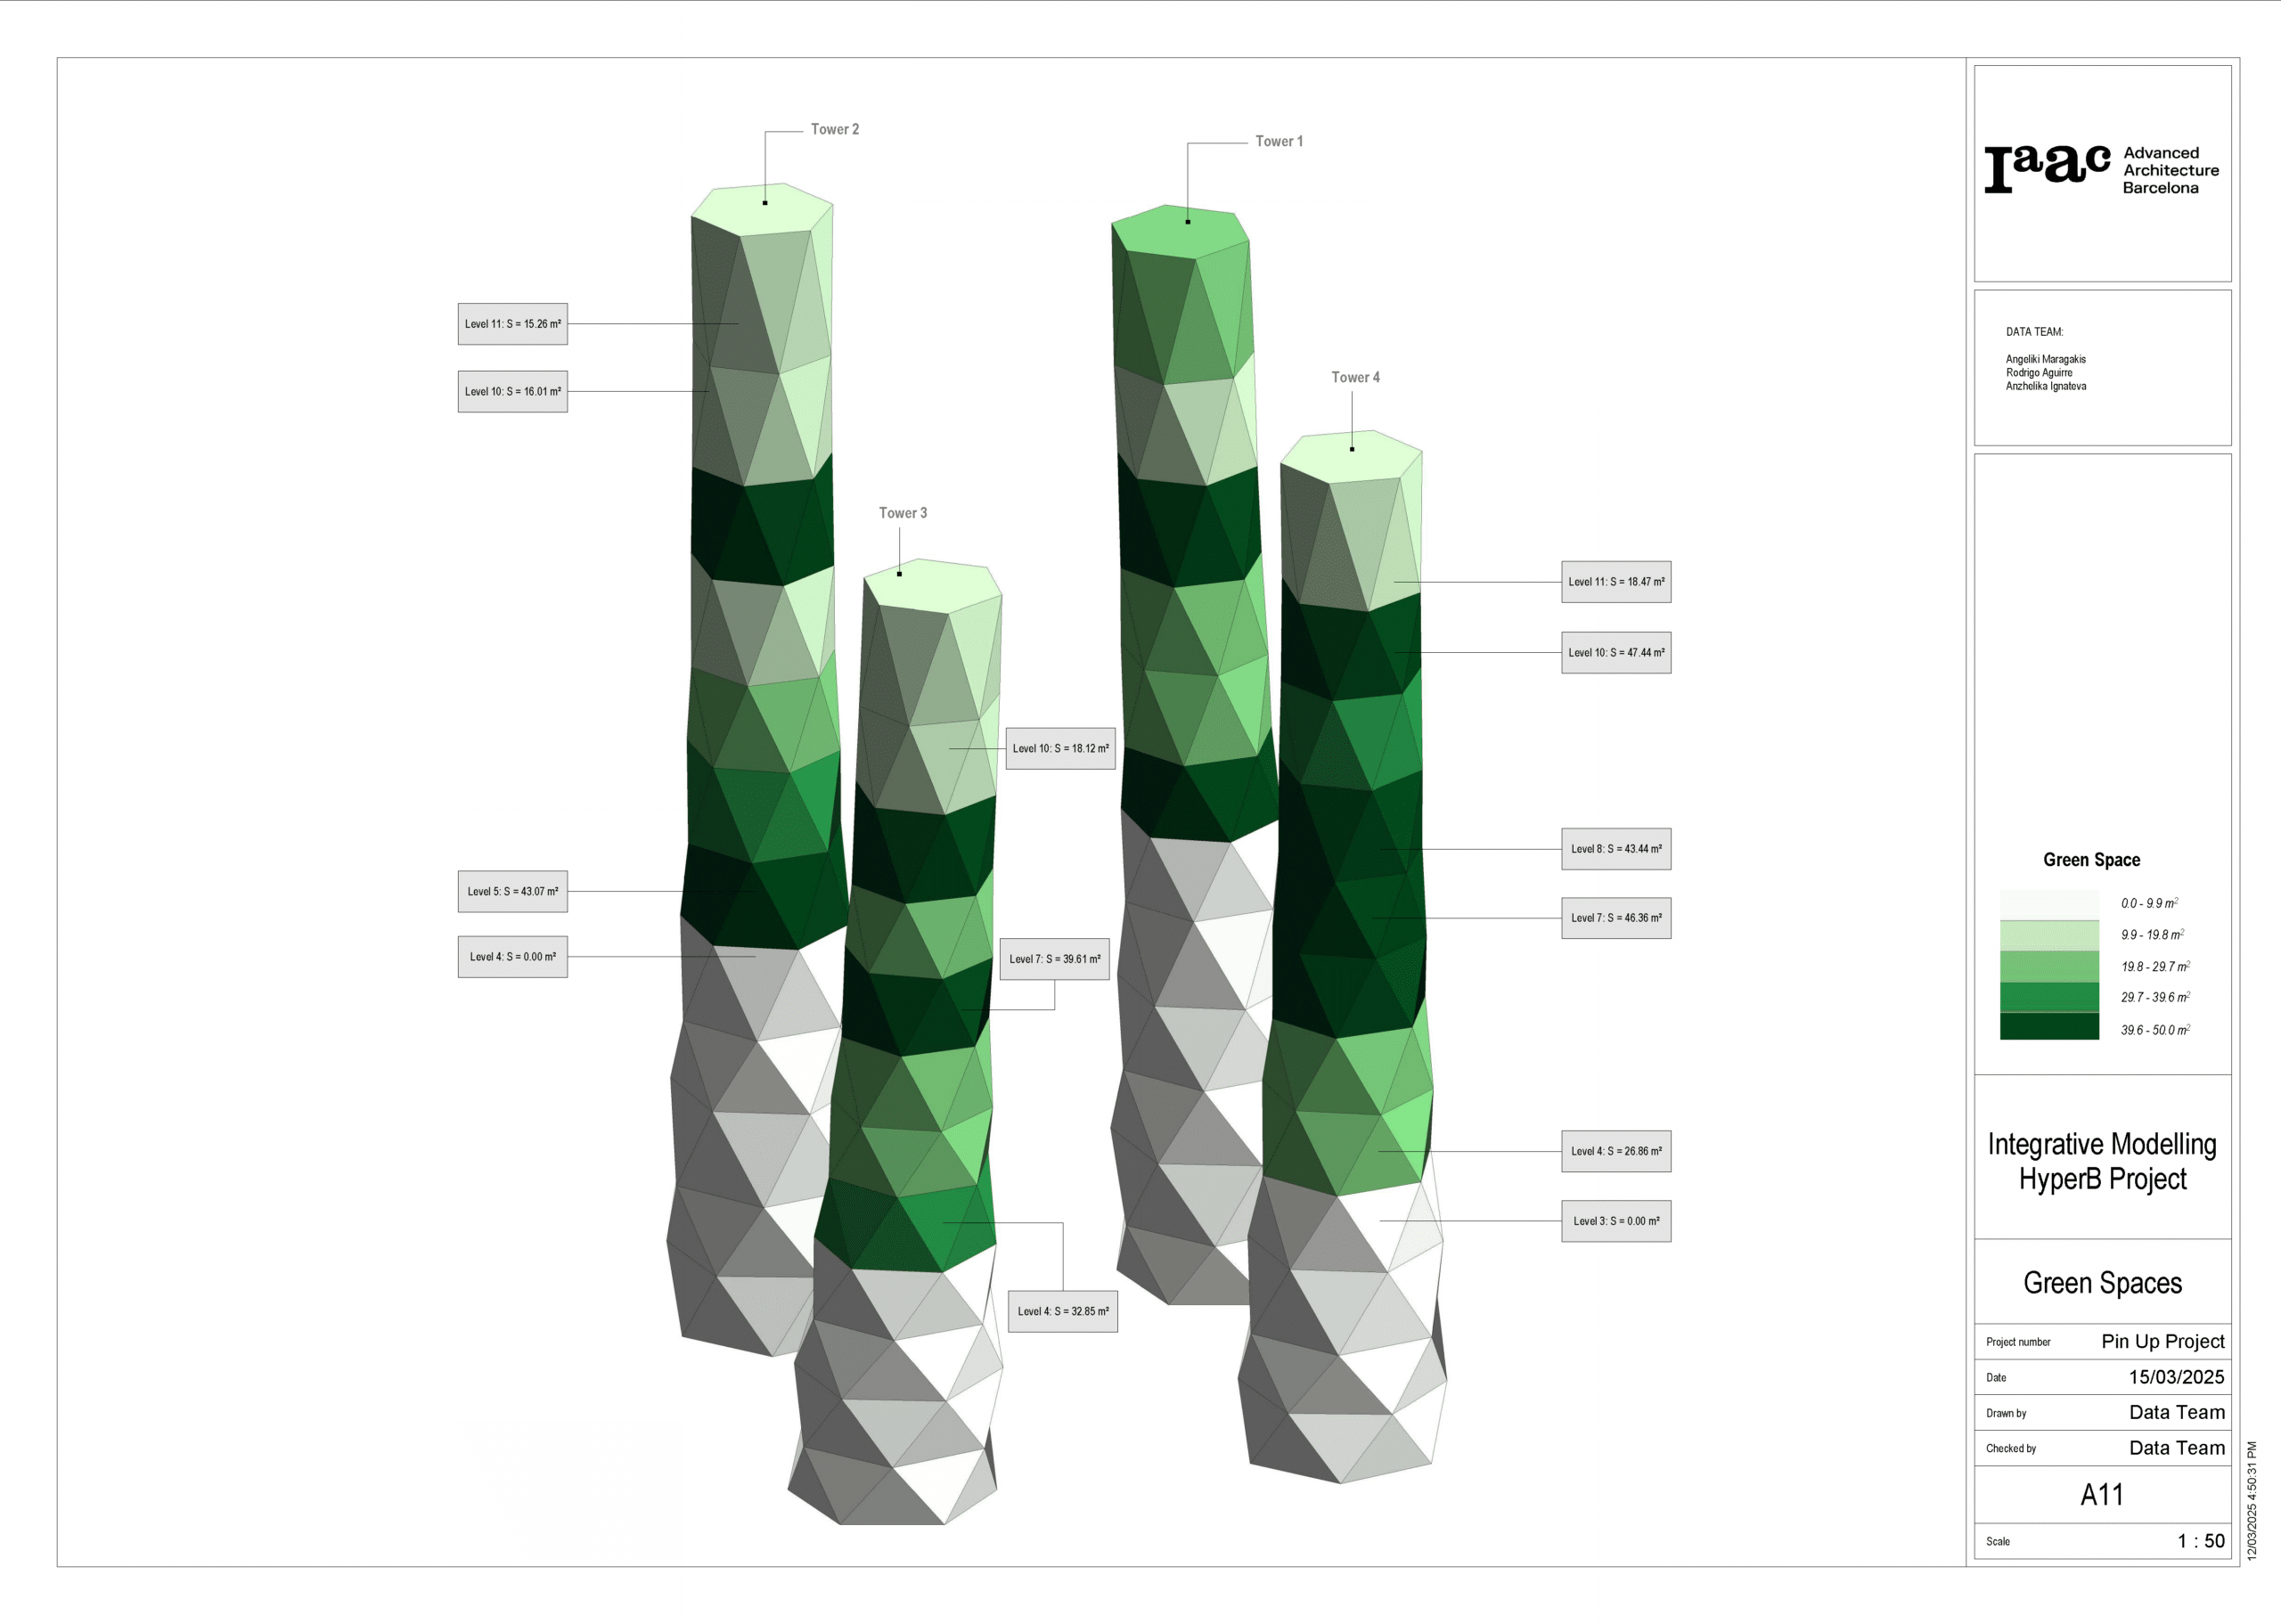
The variable heights is evident in the area sizes diagram, where even though the building is tapered toward the top, variable zoning heights have a big effect on the functional floor area for these zones.
Structural Considerations
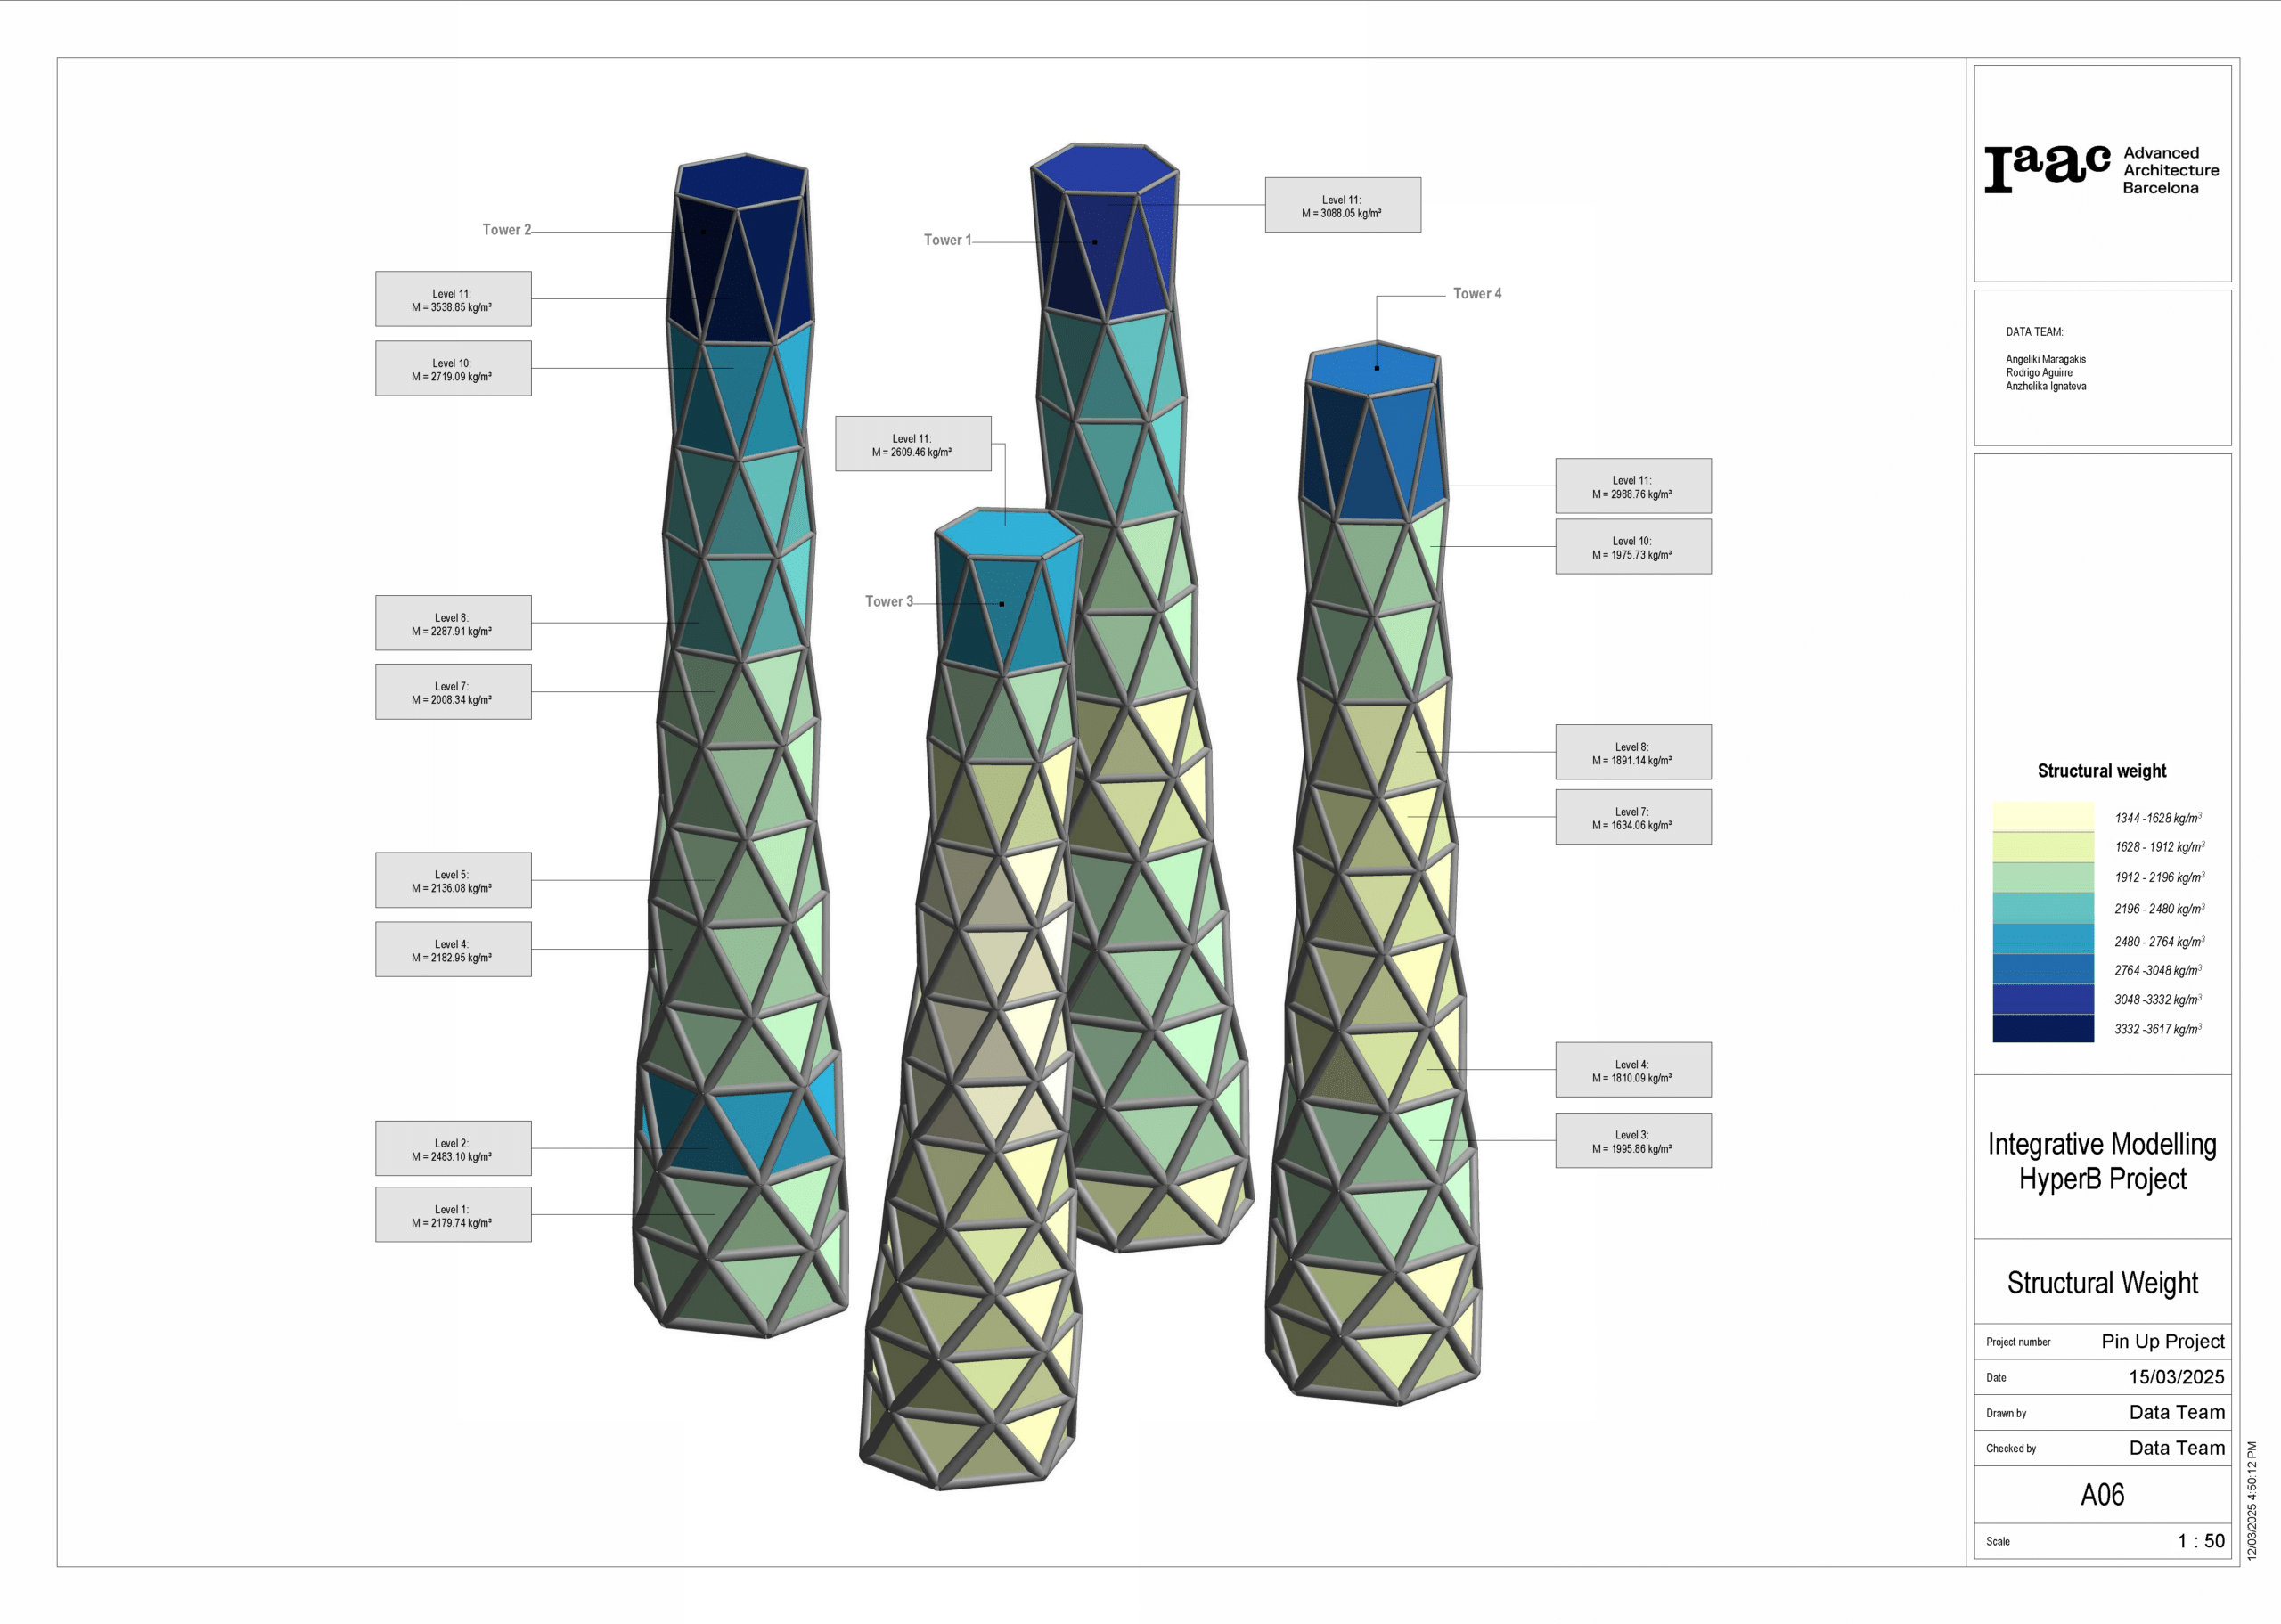
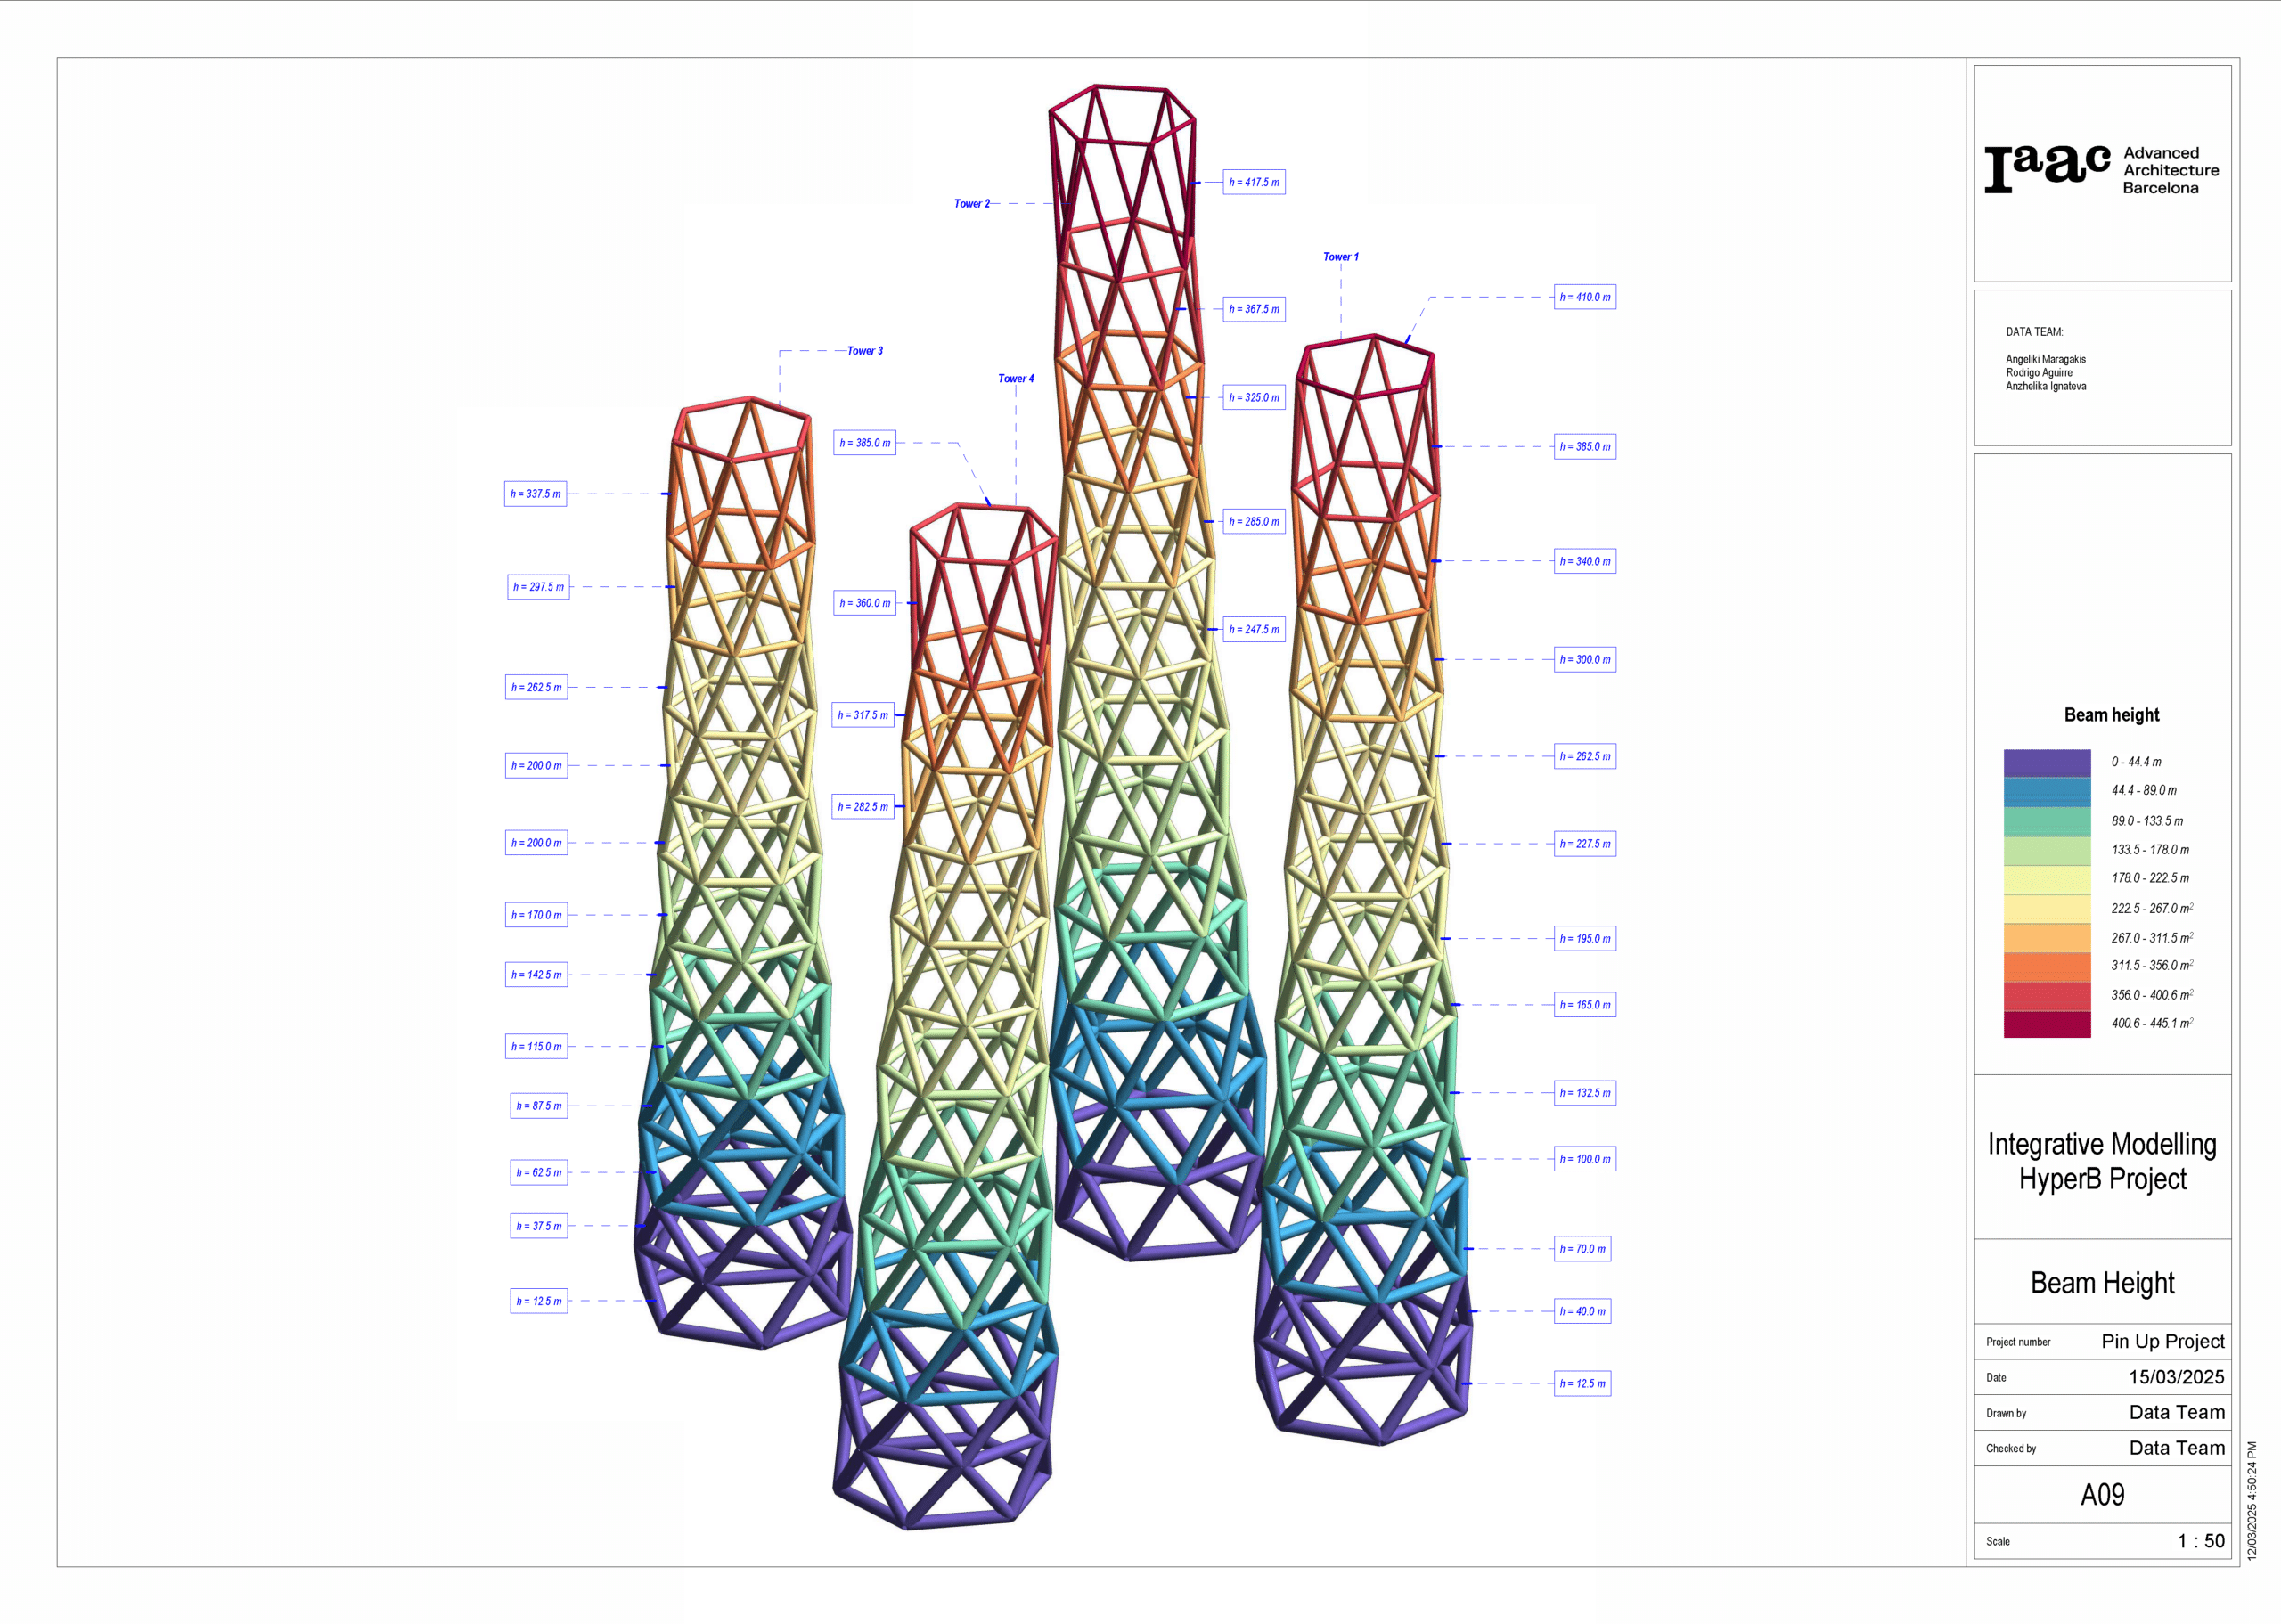
This in turn effects the structural weight of each zone, and as a result we have adapted our structural geometries in revit to become thicker towards the bottom of the building.
To achieve this, we created an adaptive beam family that varies with the z-position of the beam placement.
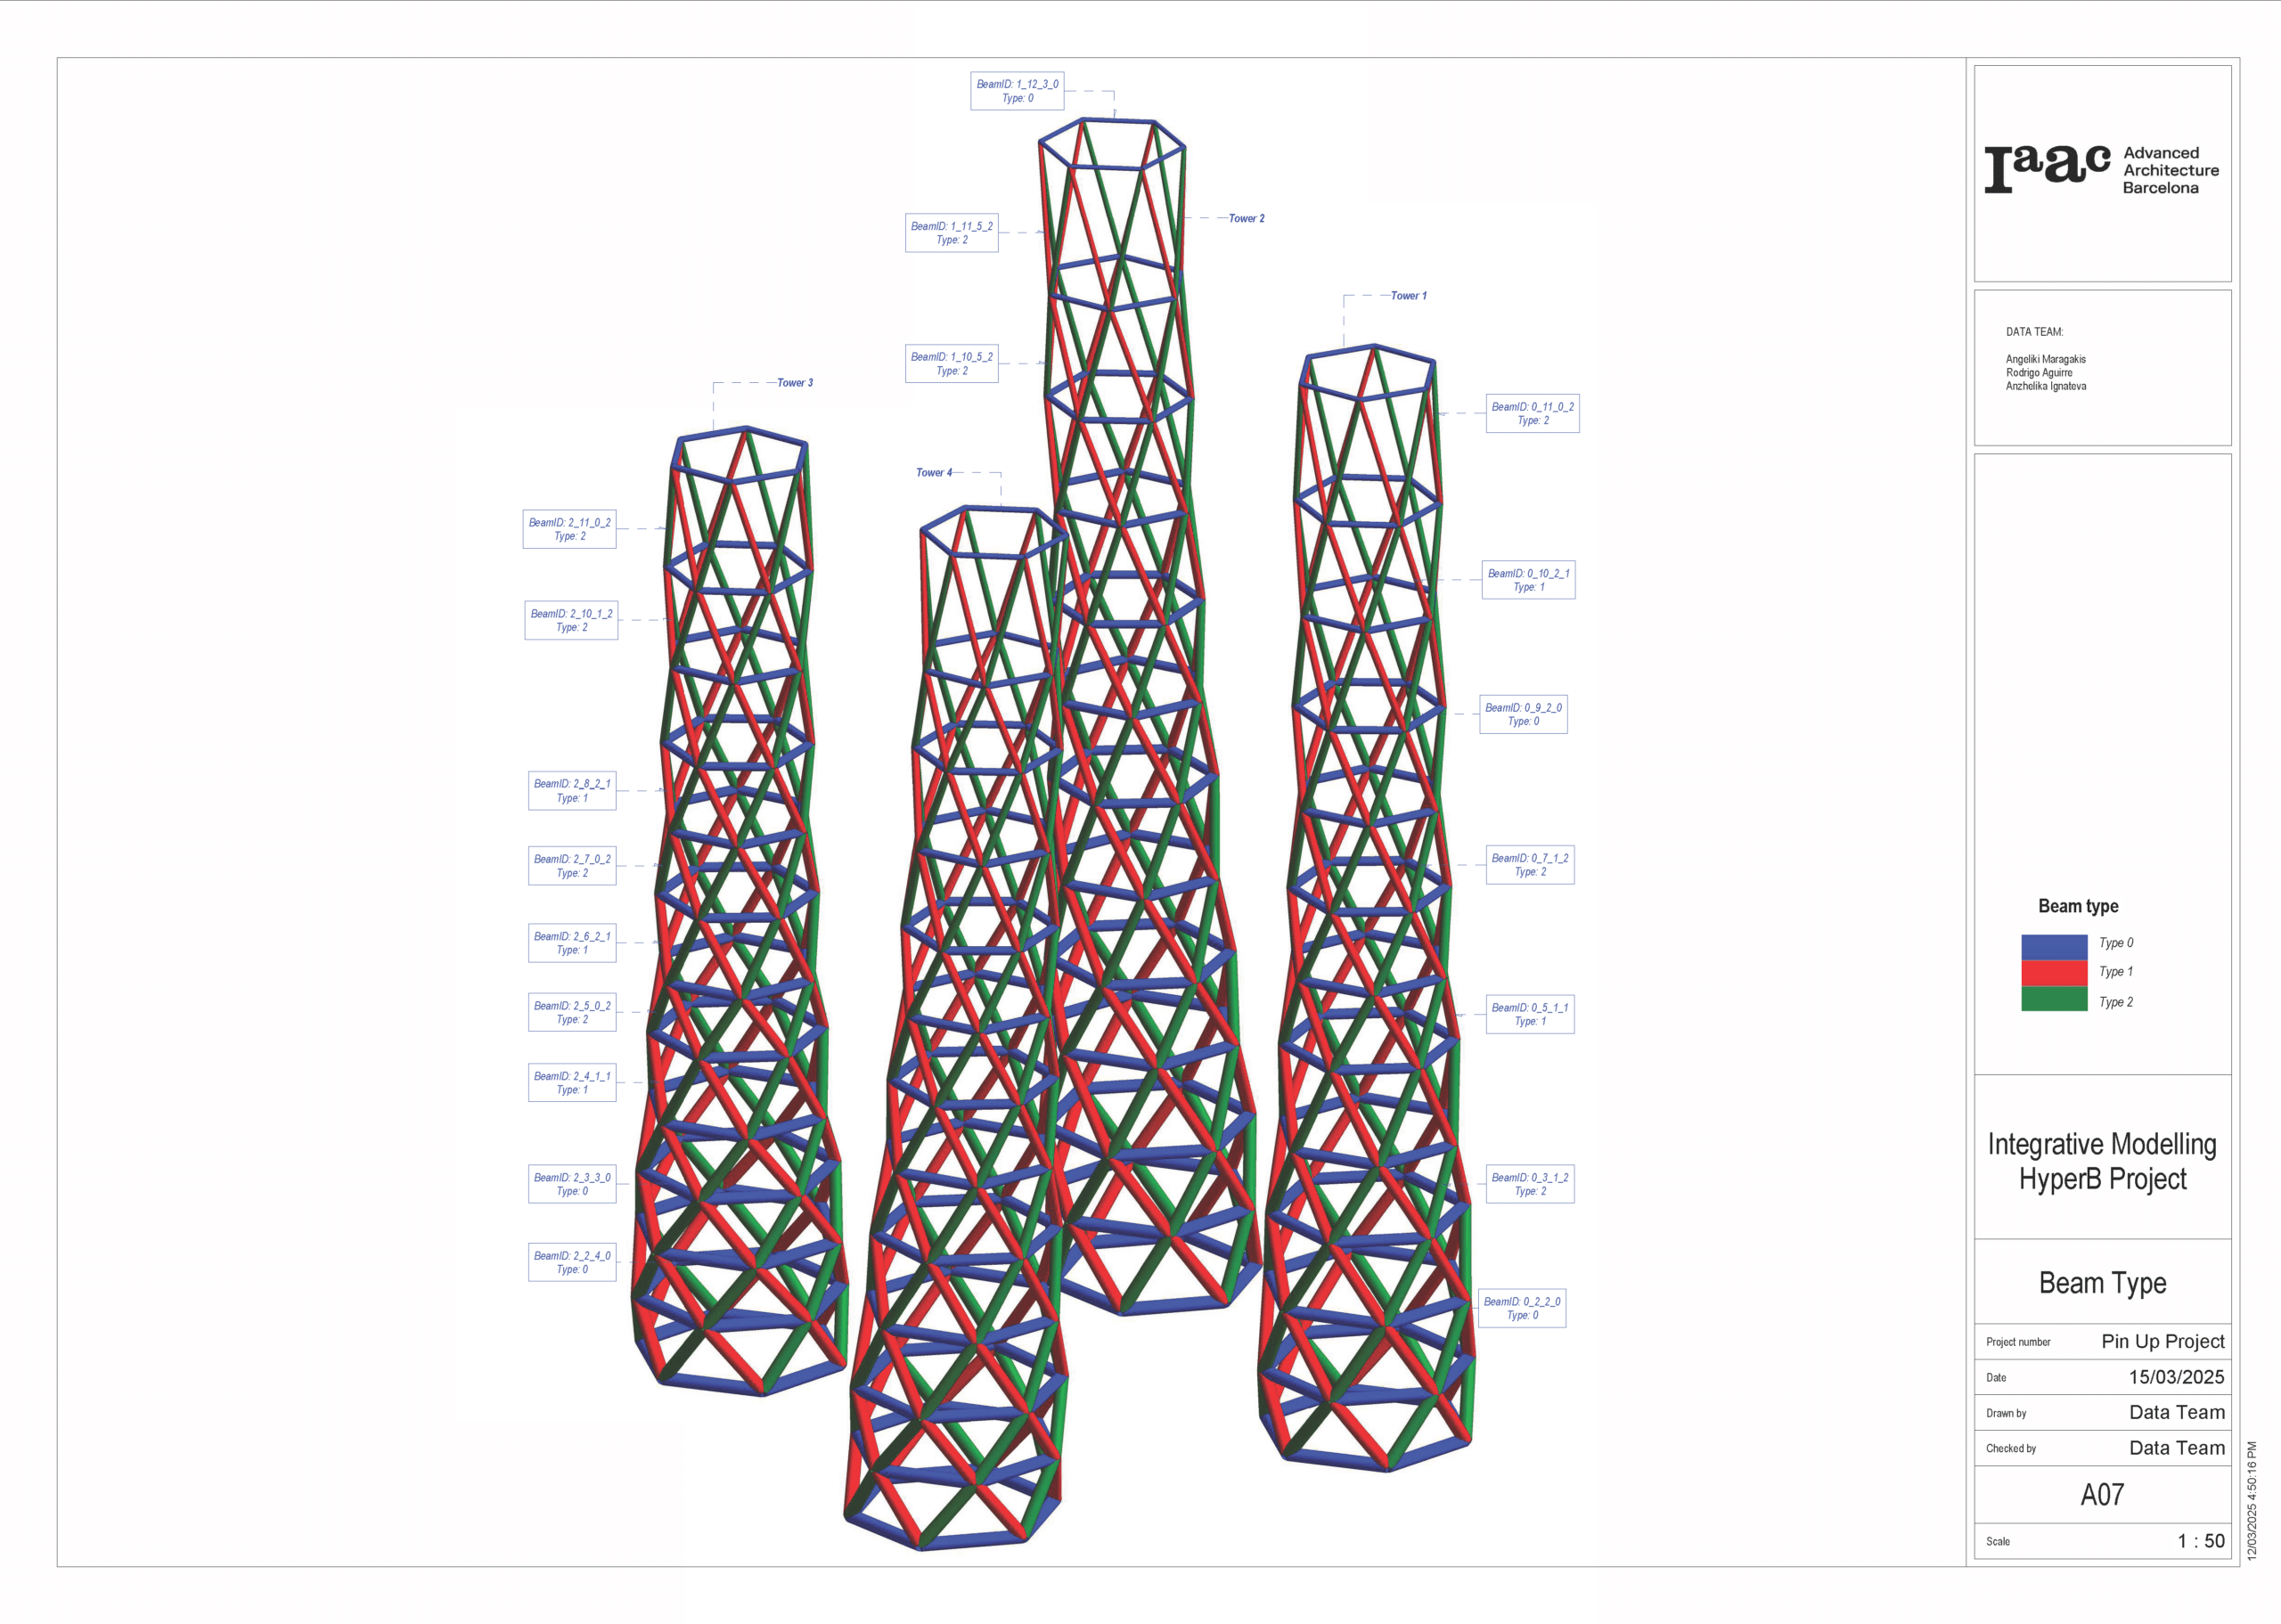
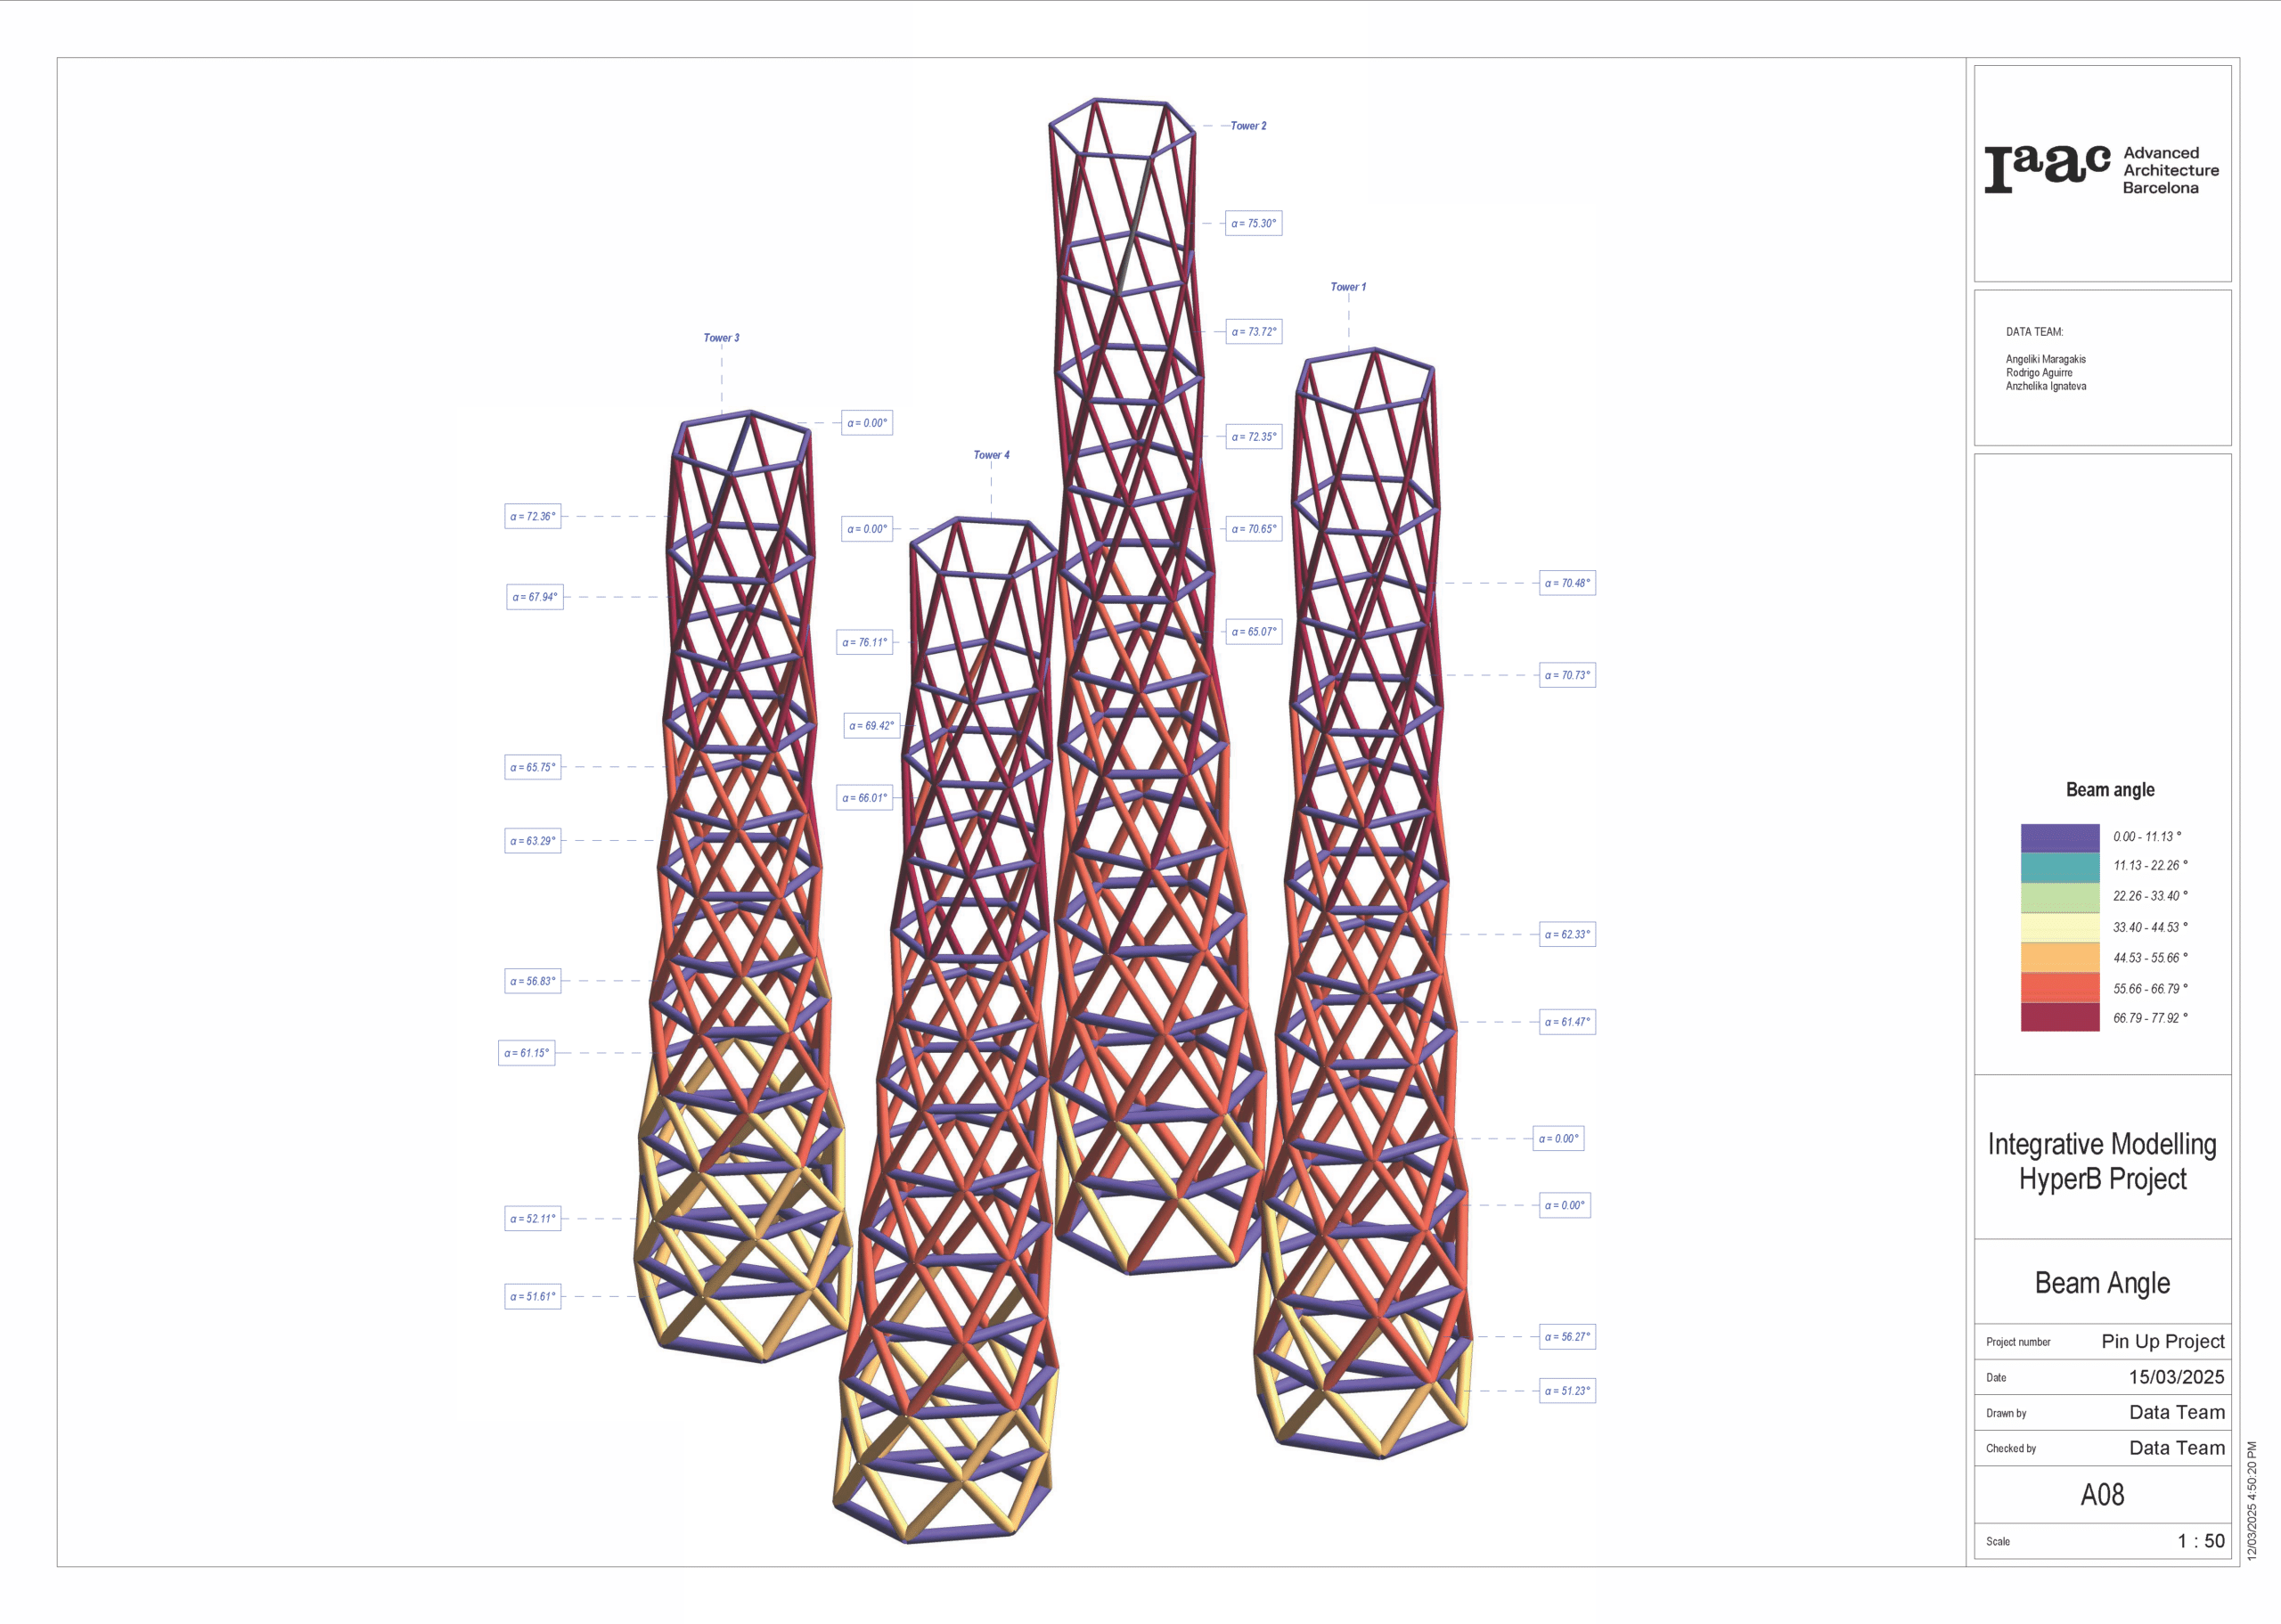
These beam geometries are created using rhino.inside so that we are able to measure the beam angle and export it as project metadata.
Our beam heights diagram colour codes these varying beam thicknesses to give a sense of the structural implication of this system.
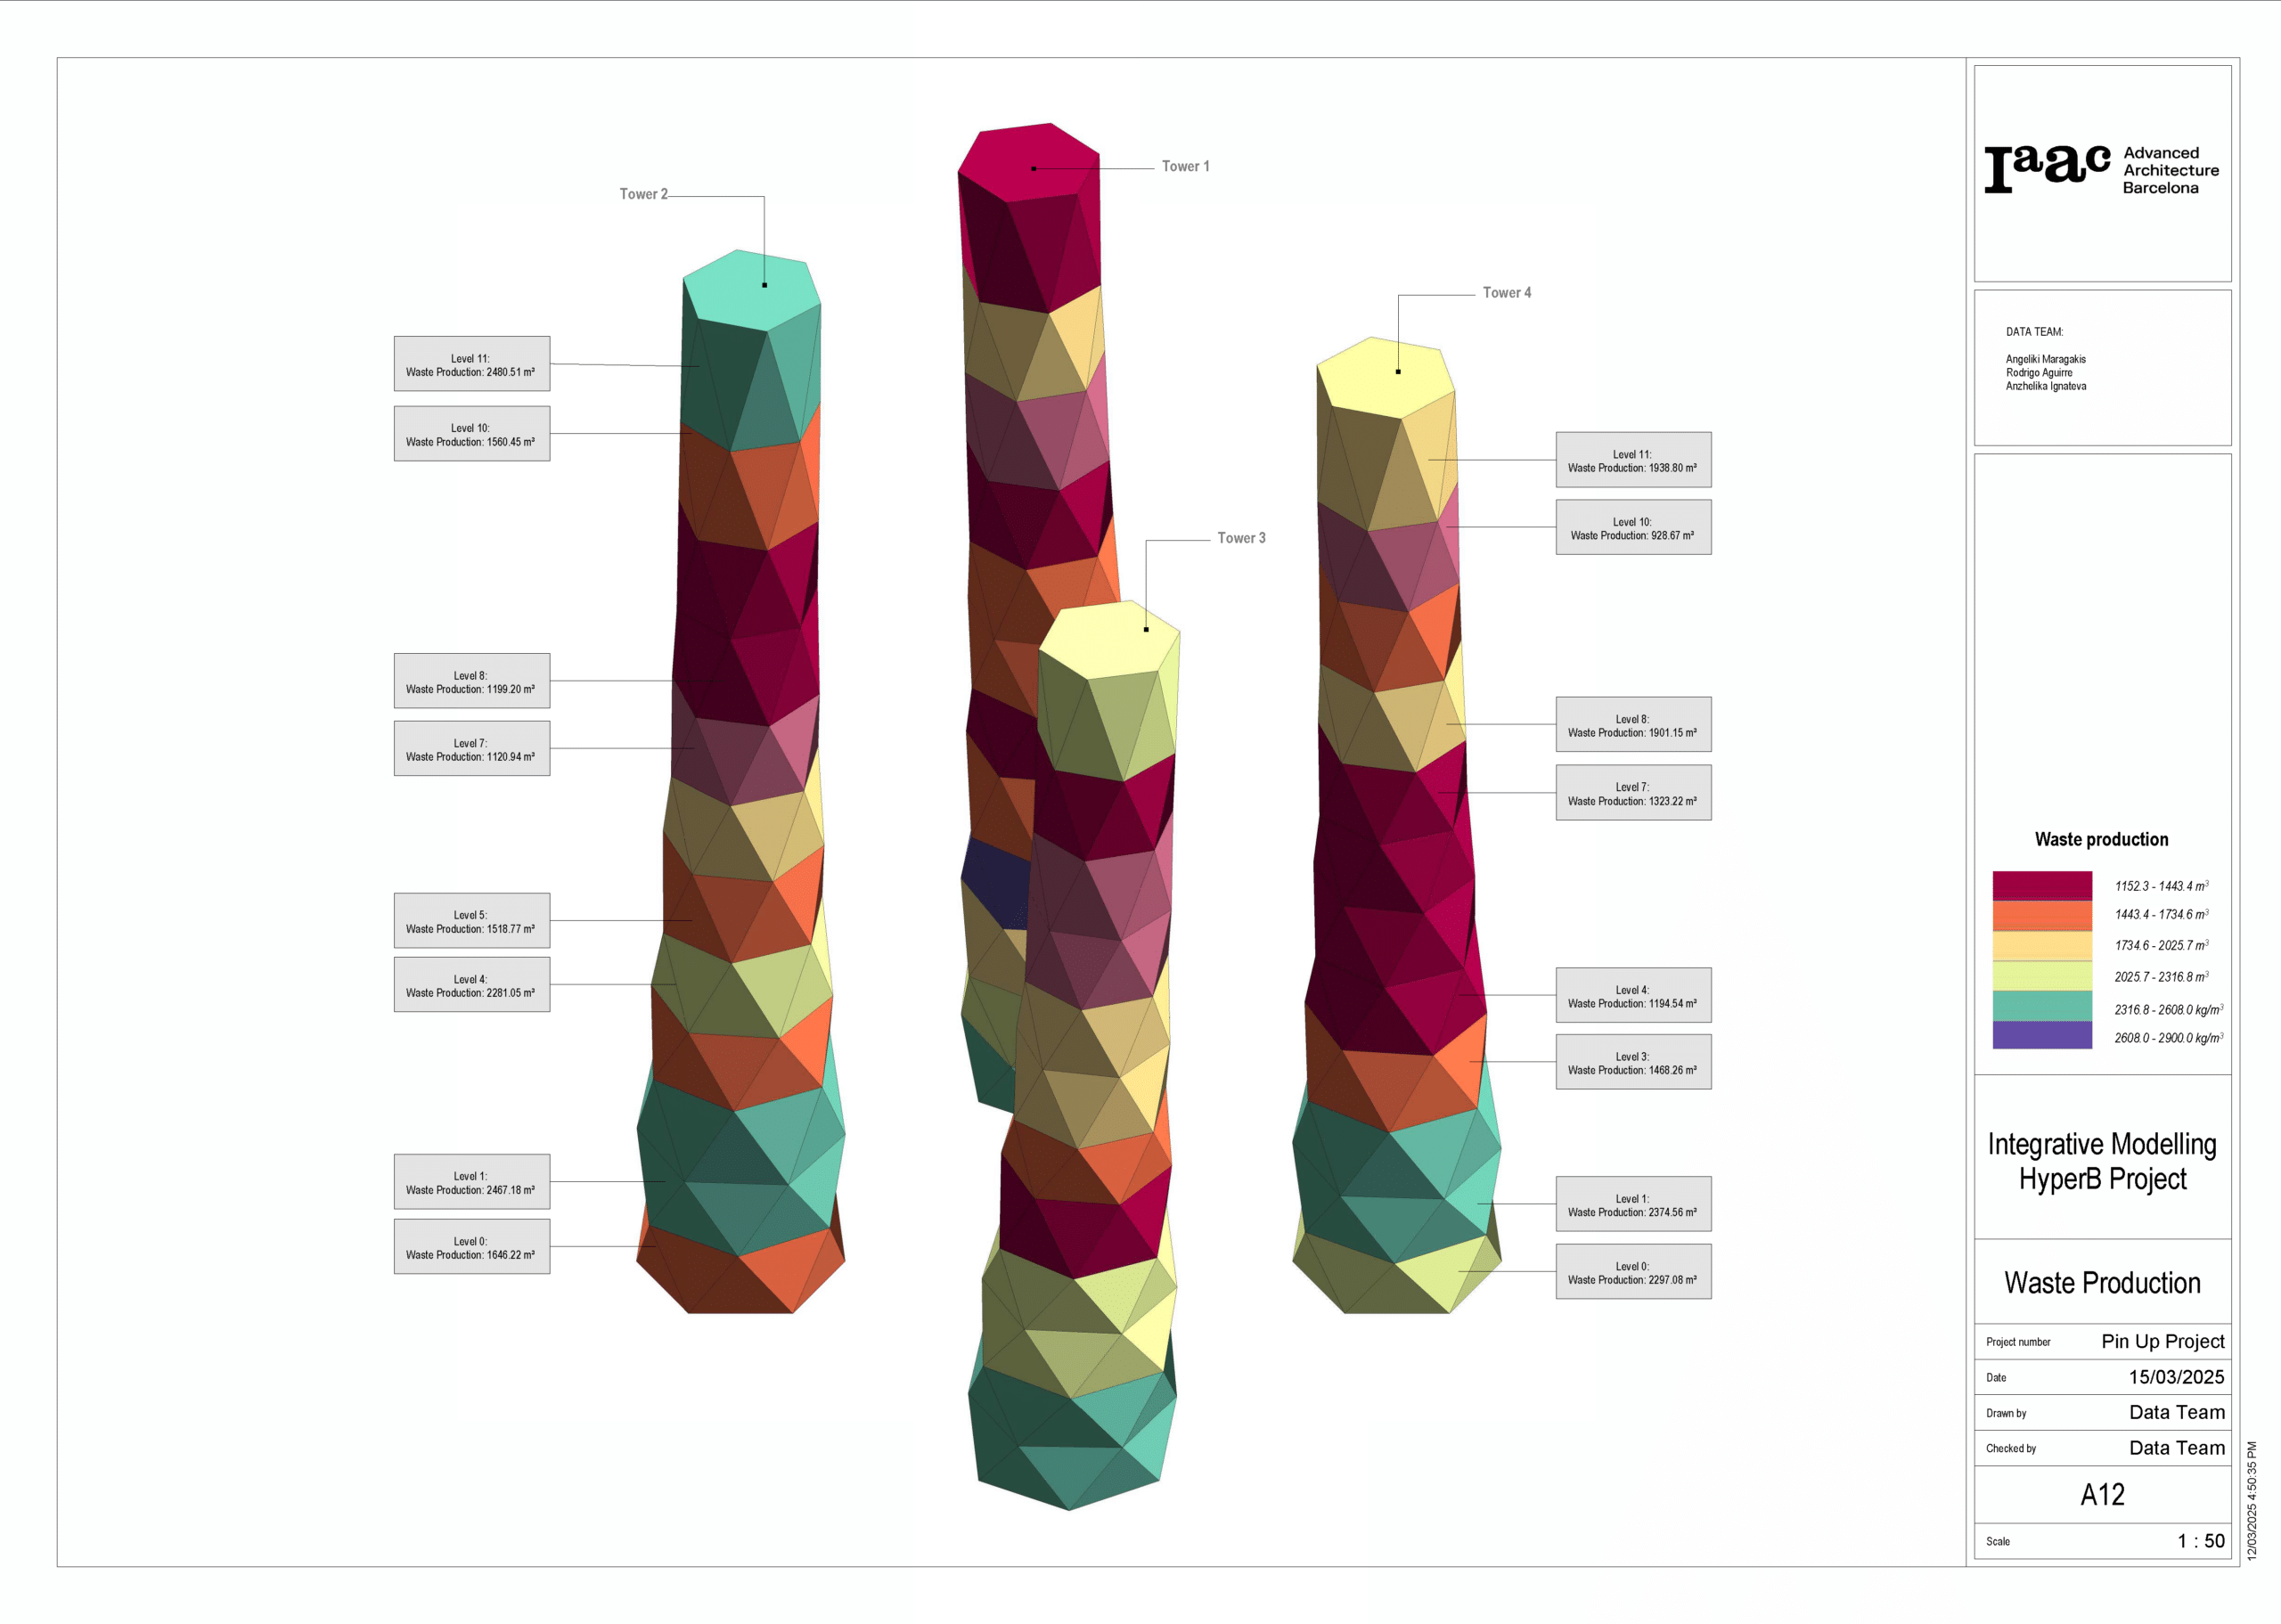
Energy Expenditure
We then implement the energy expenditure per functional zone within our Revit project. We calculate the energy usage based on size and usage of the spaces.
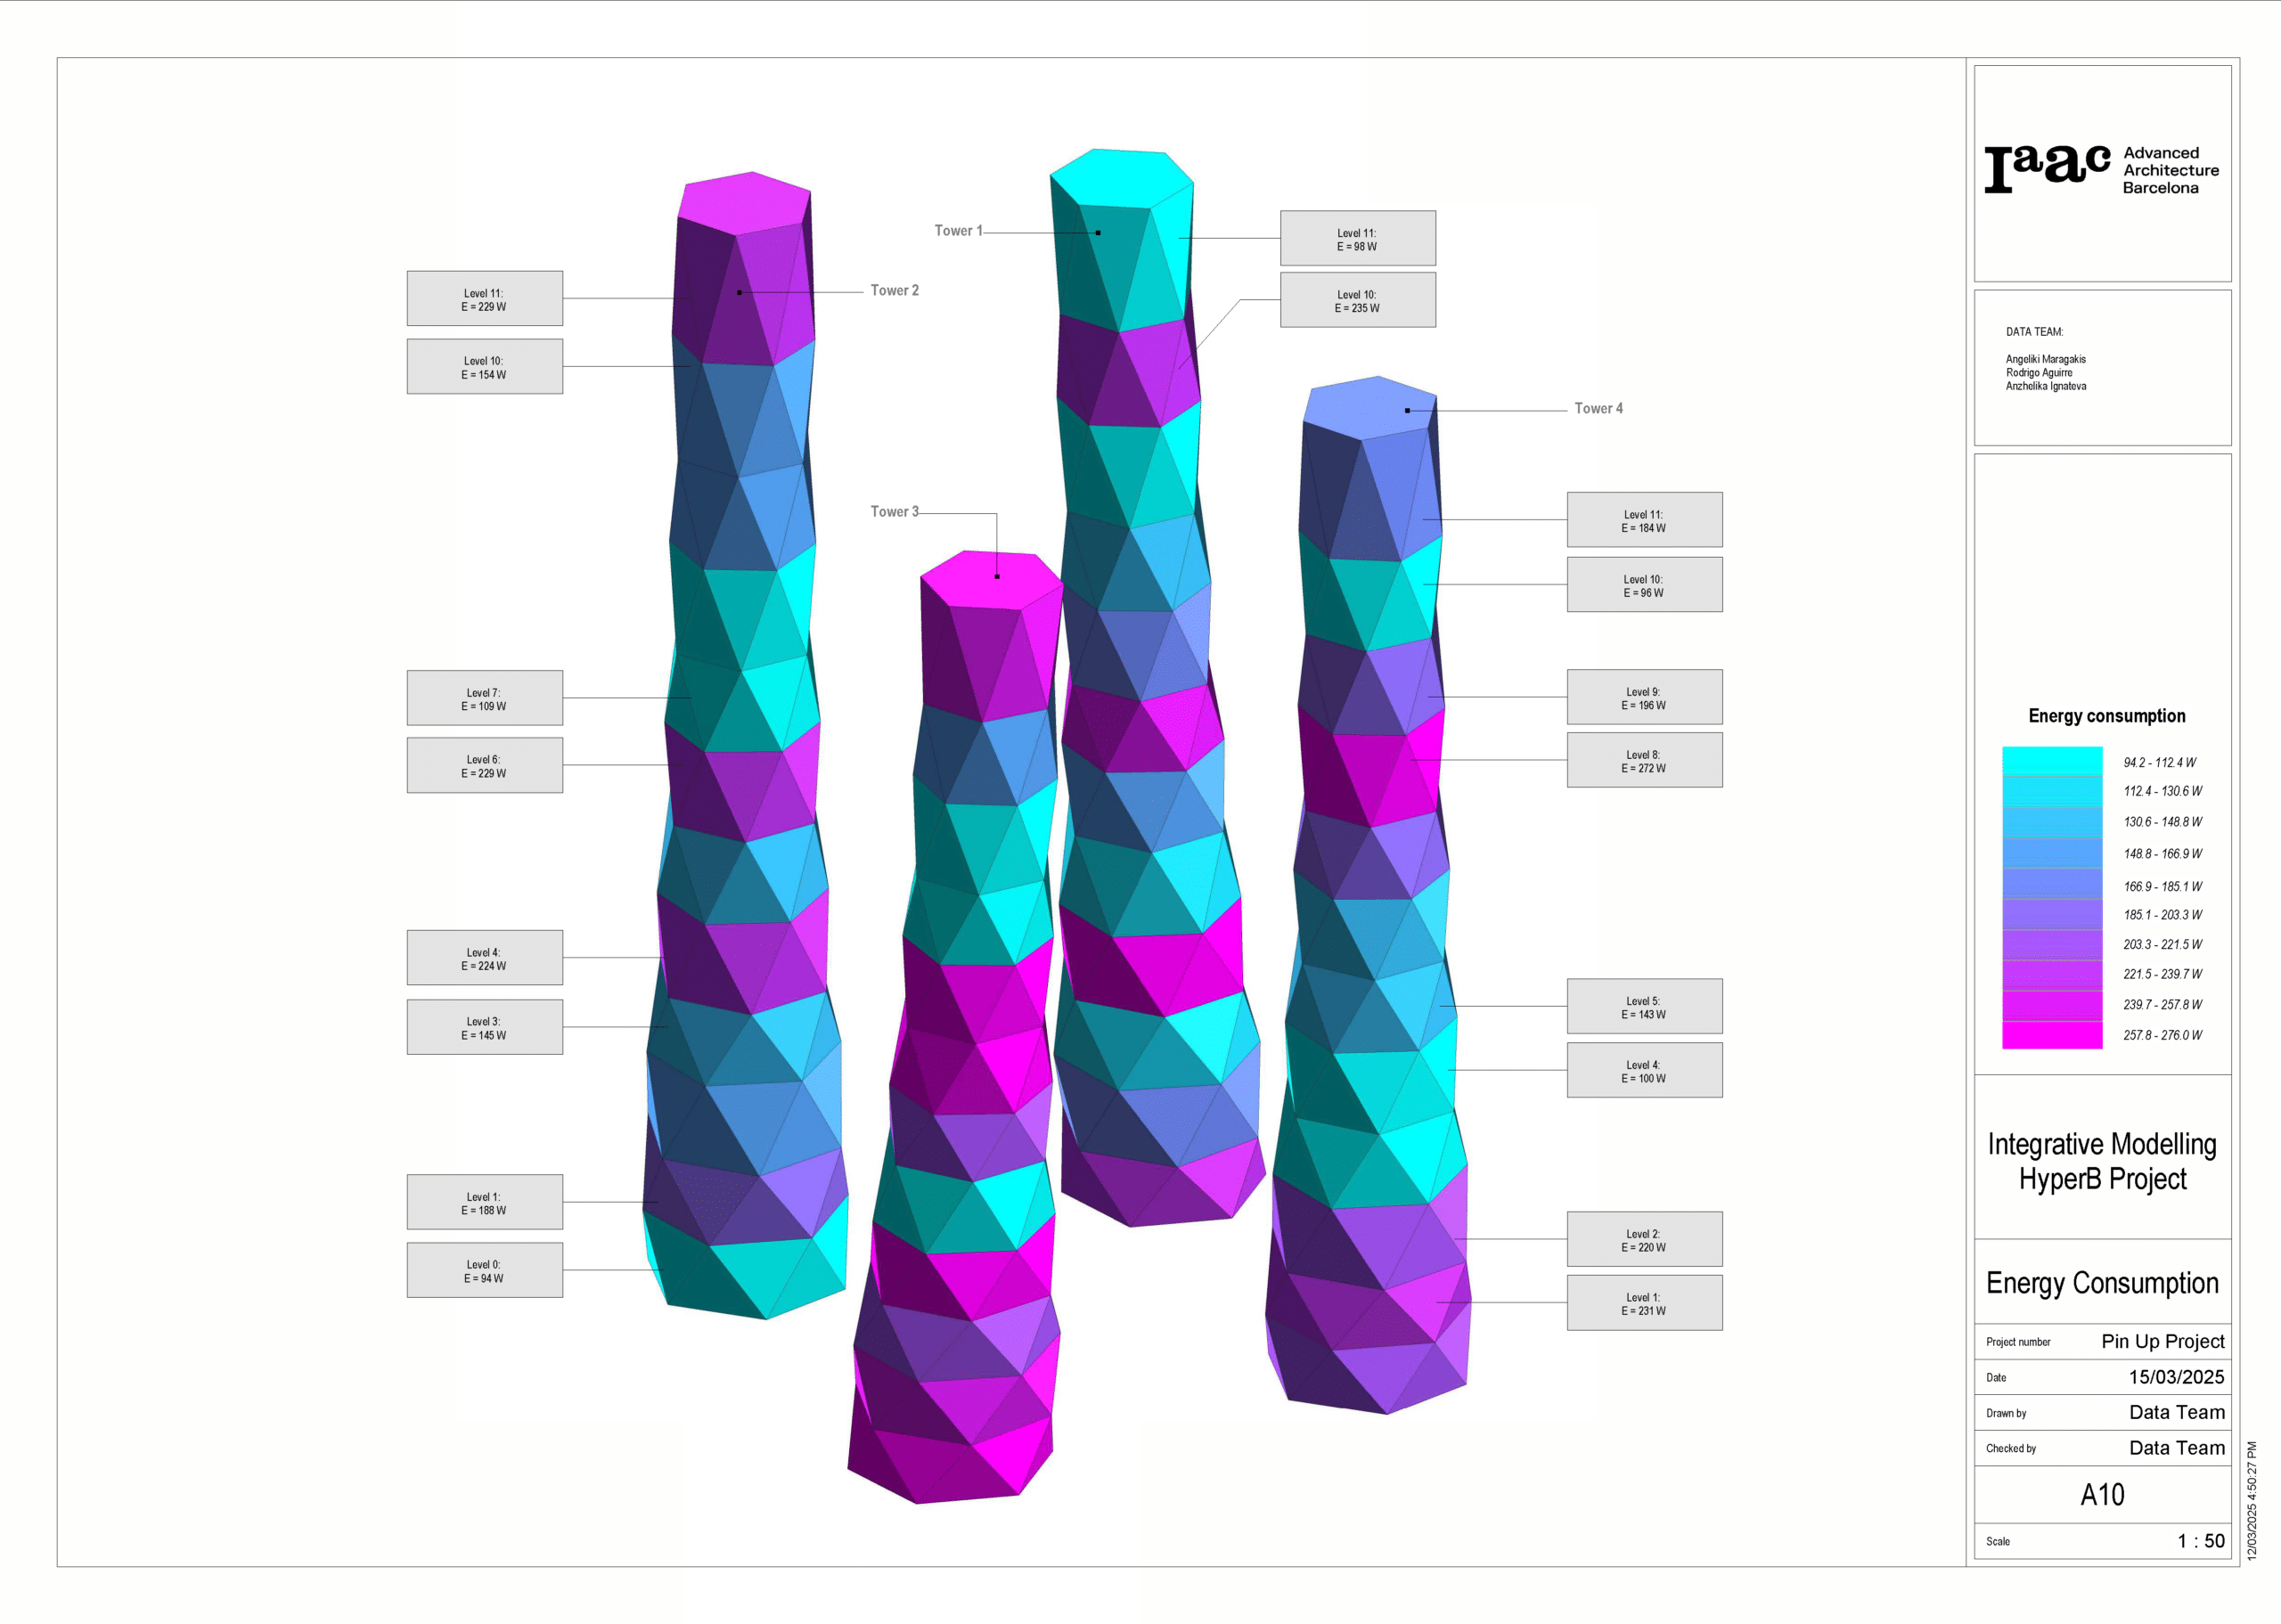
Throughout the day, we see how consumption shifts from residential areas to service, industry, and food production. Larger spaces have different consumption patterns, reflecting their impact on overall usage.
Secondary Project Metadata
We also incorporate metadata with the aim of monitoring the KPIs provided by each design team. Some examples of this metadata are provided.
Project Breakdown and Scheduling
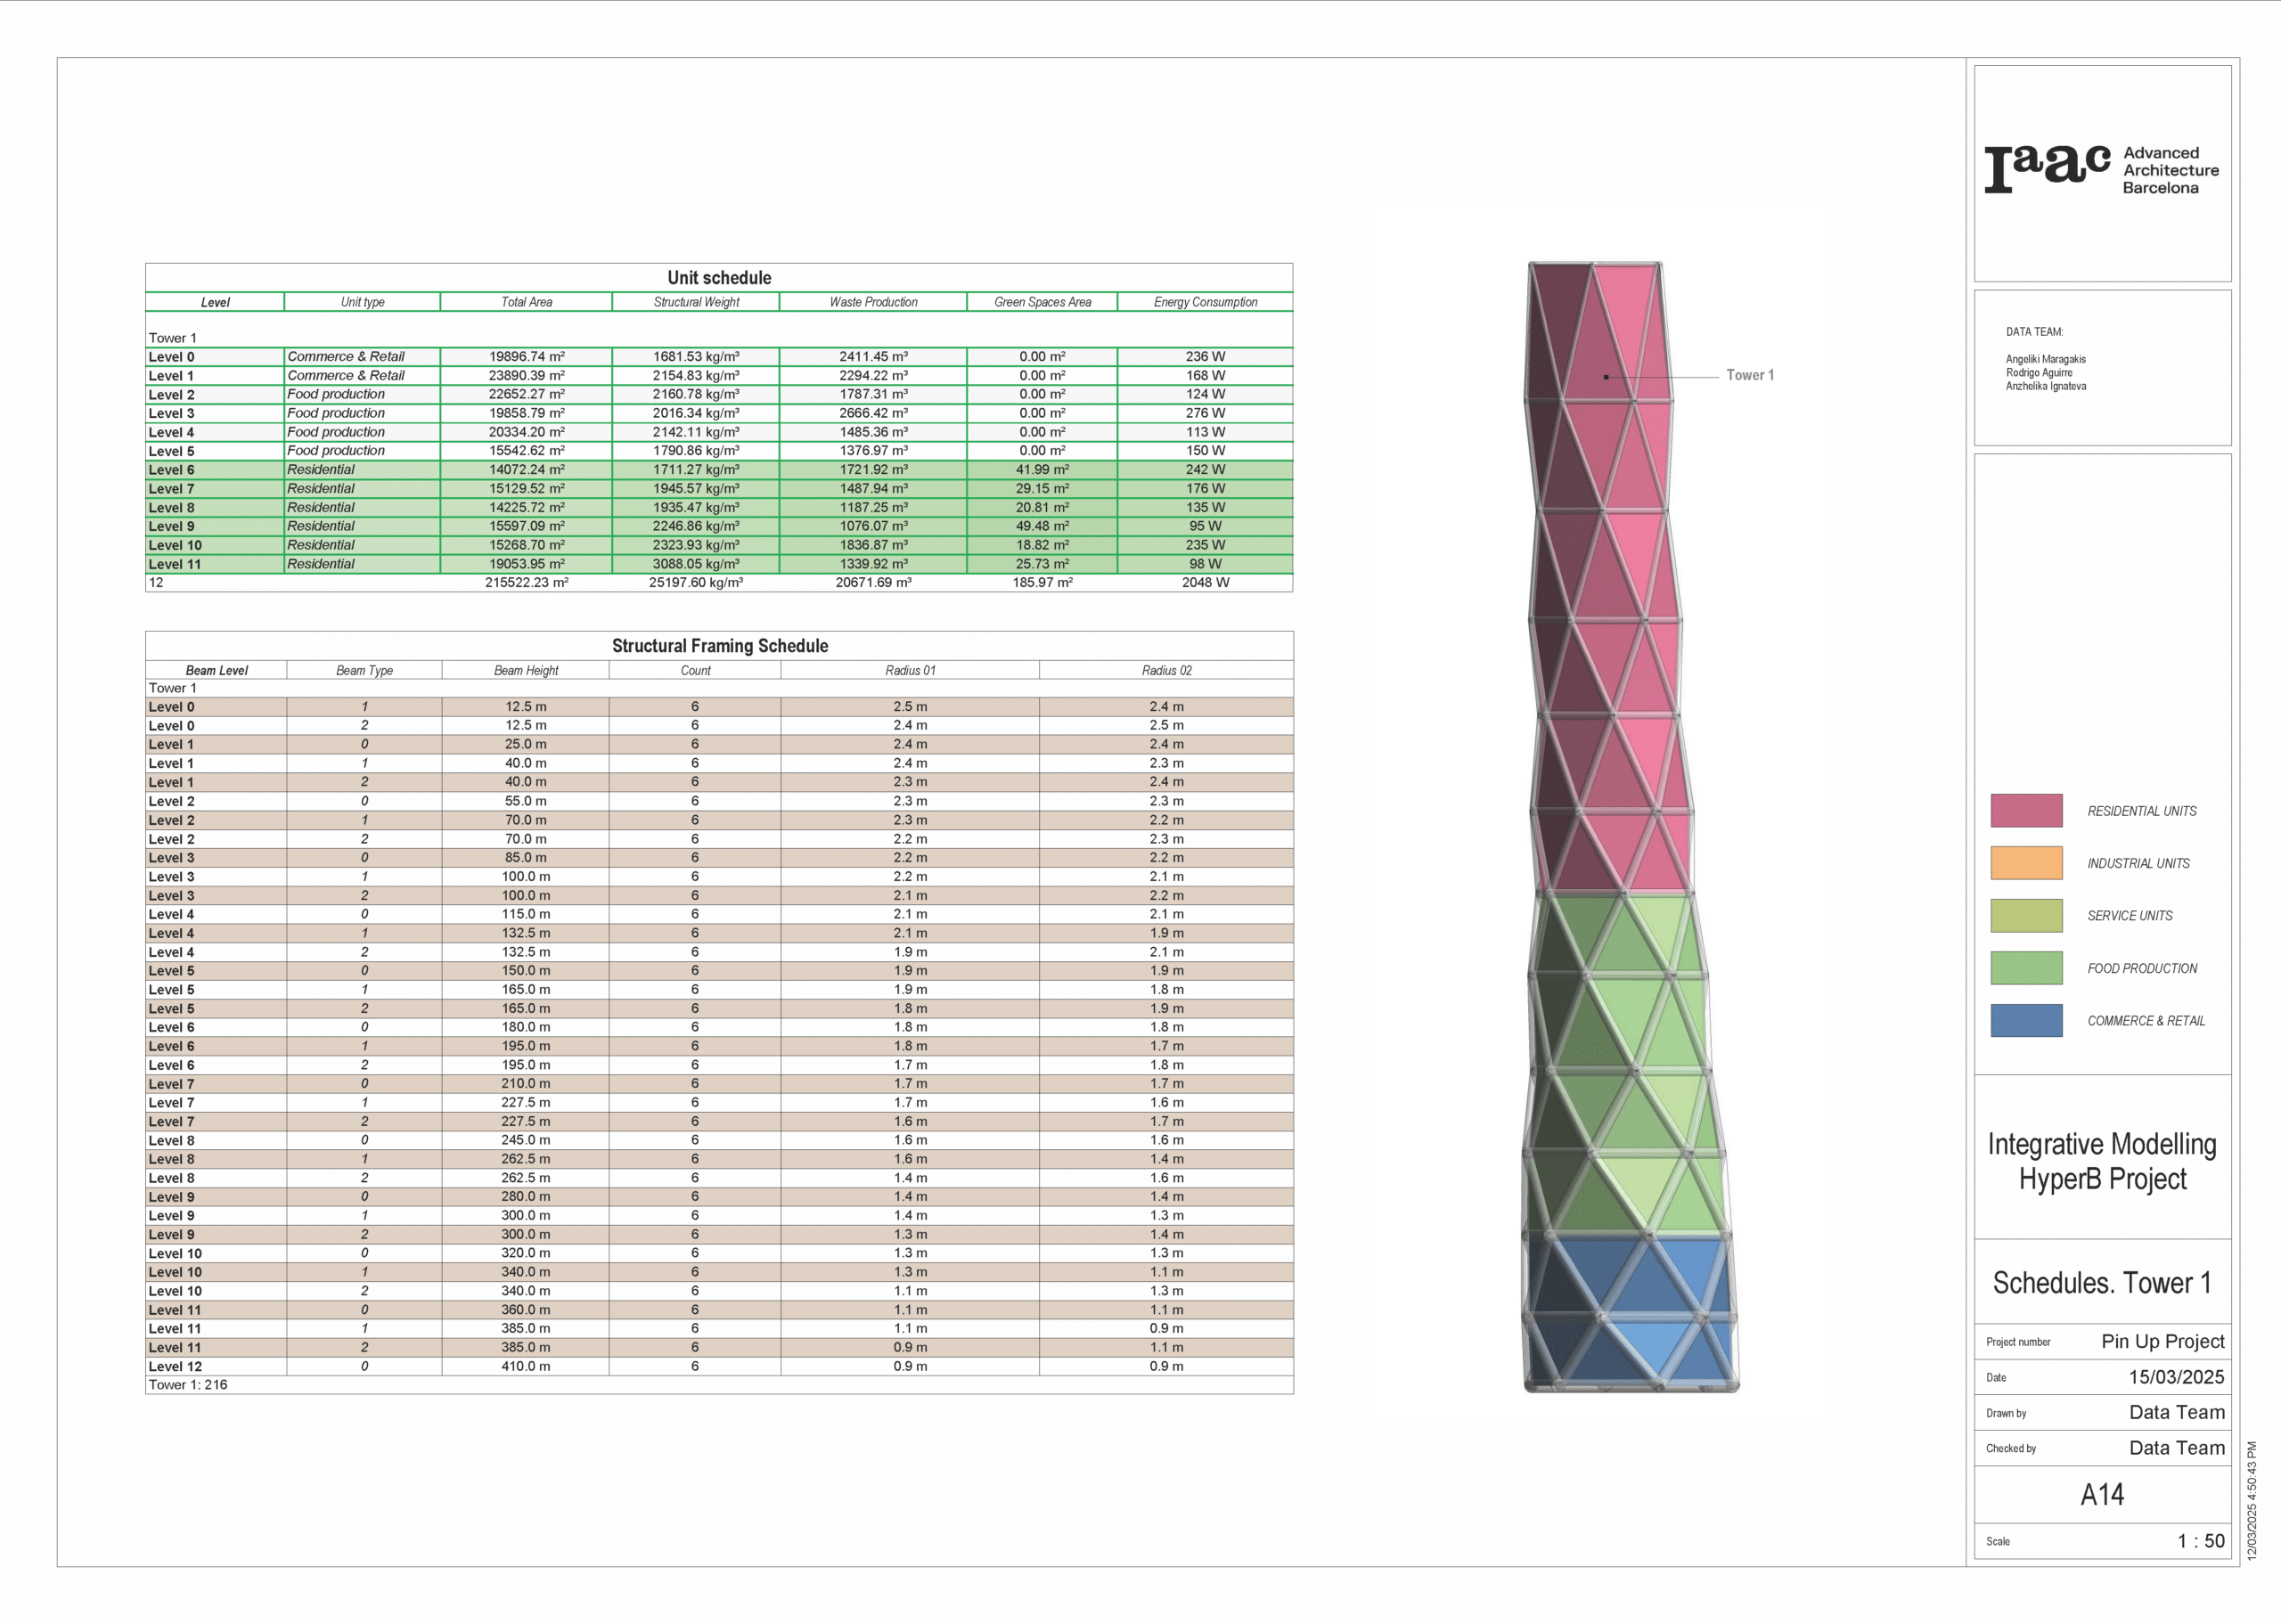
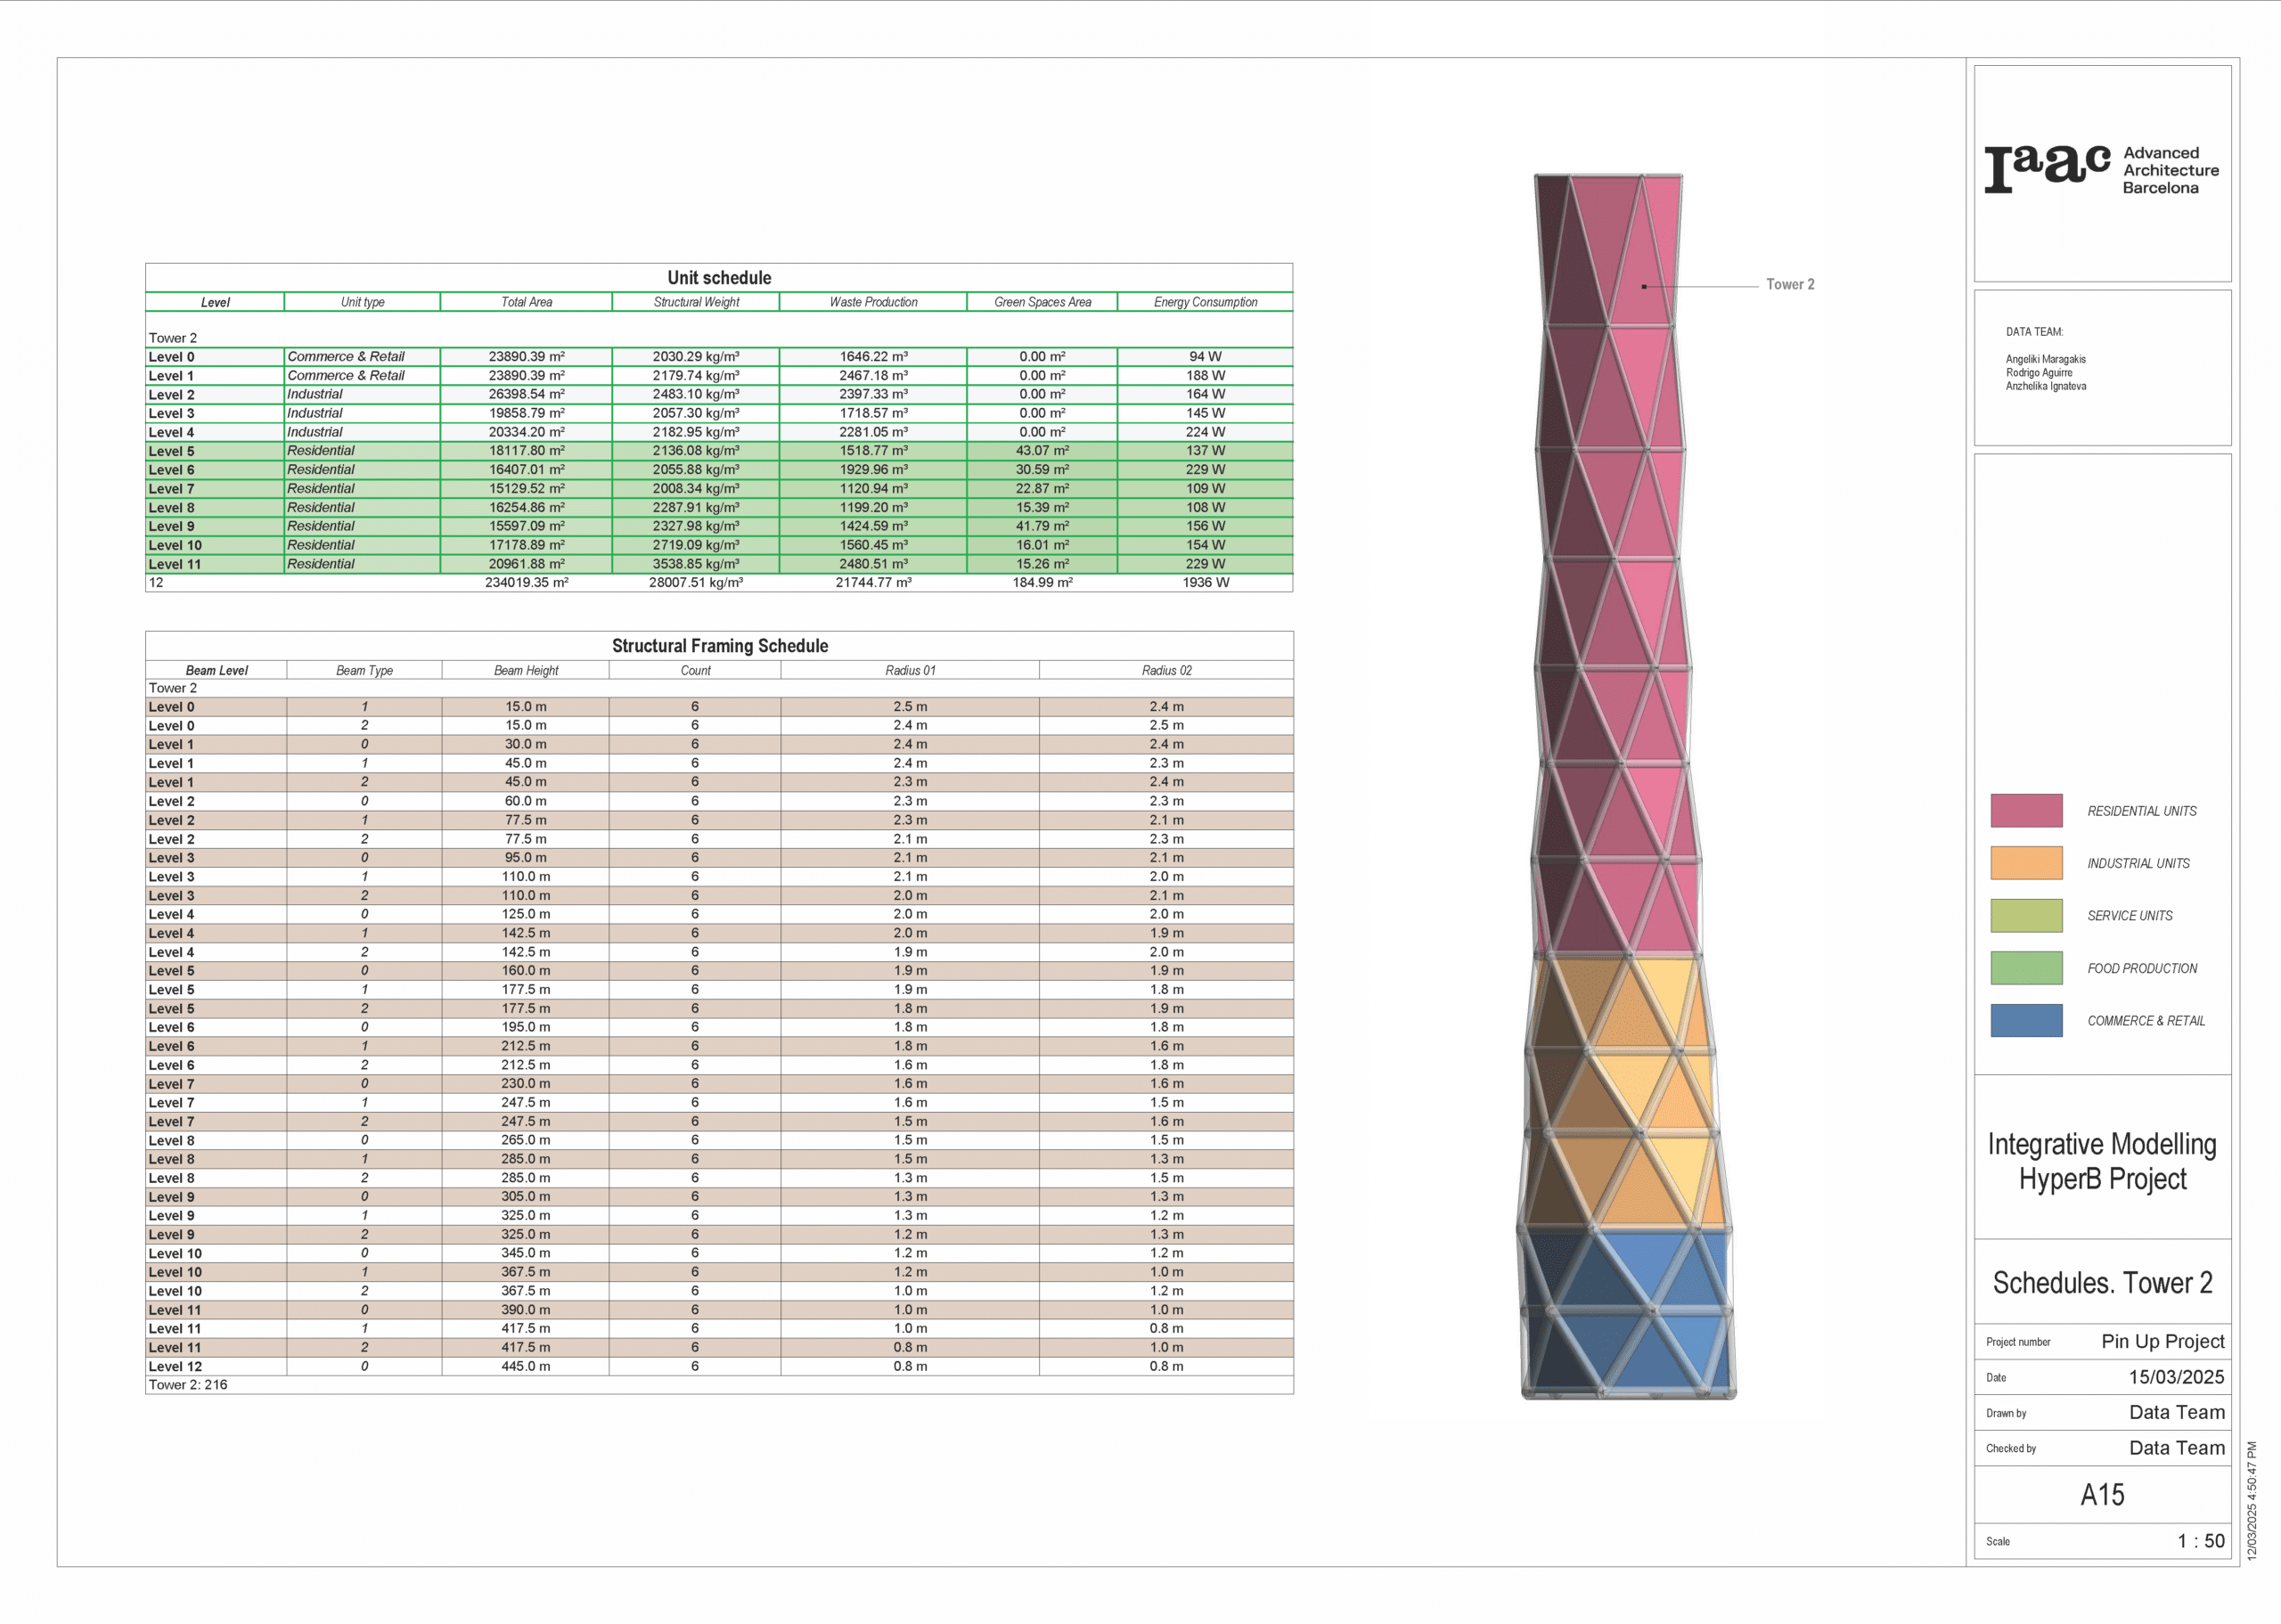
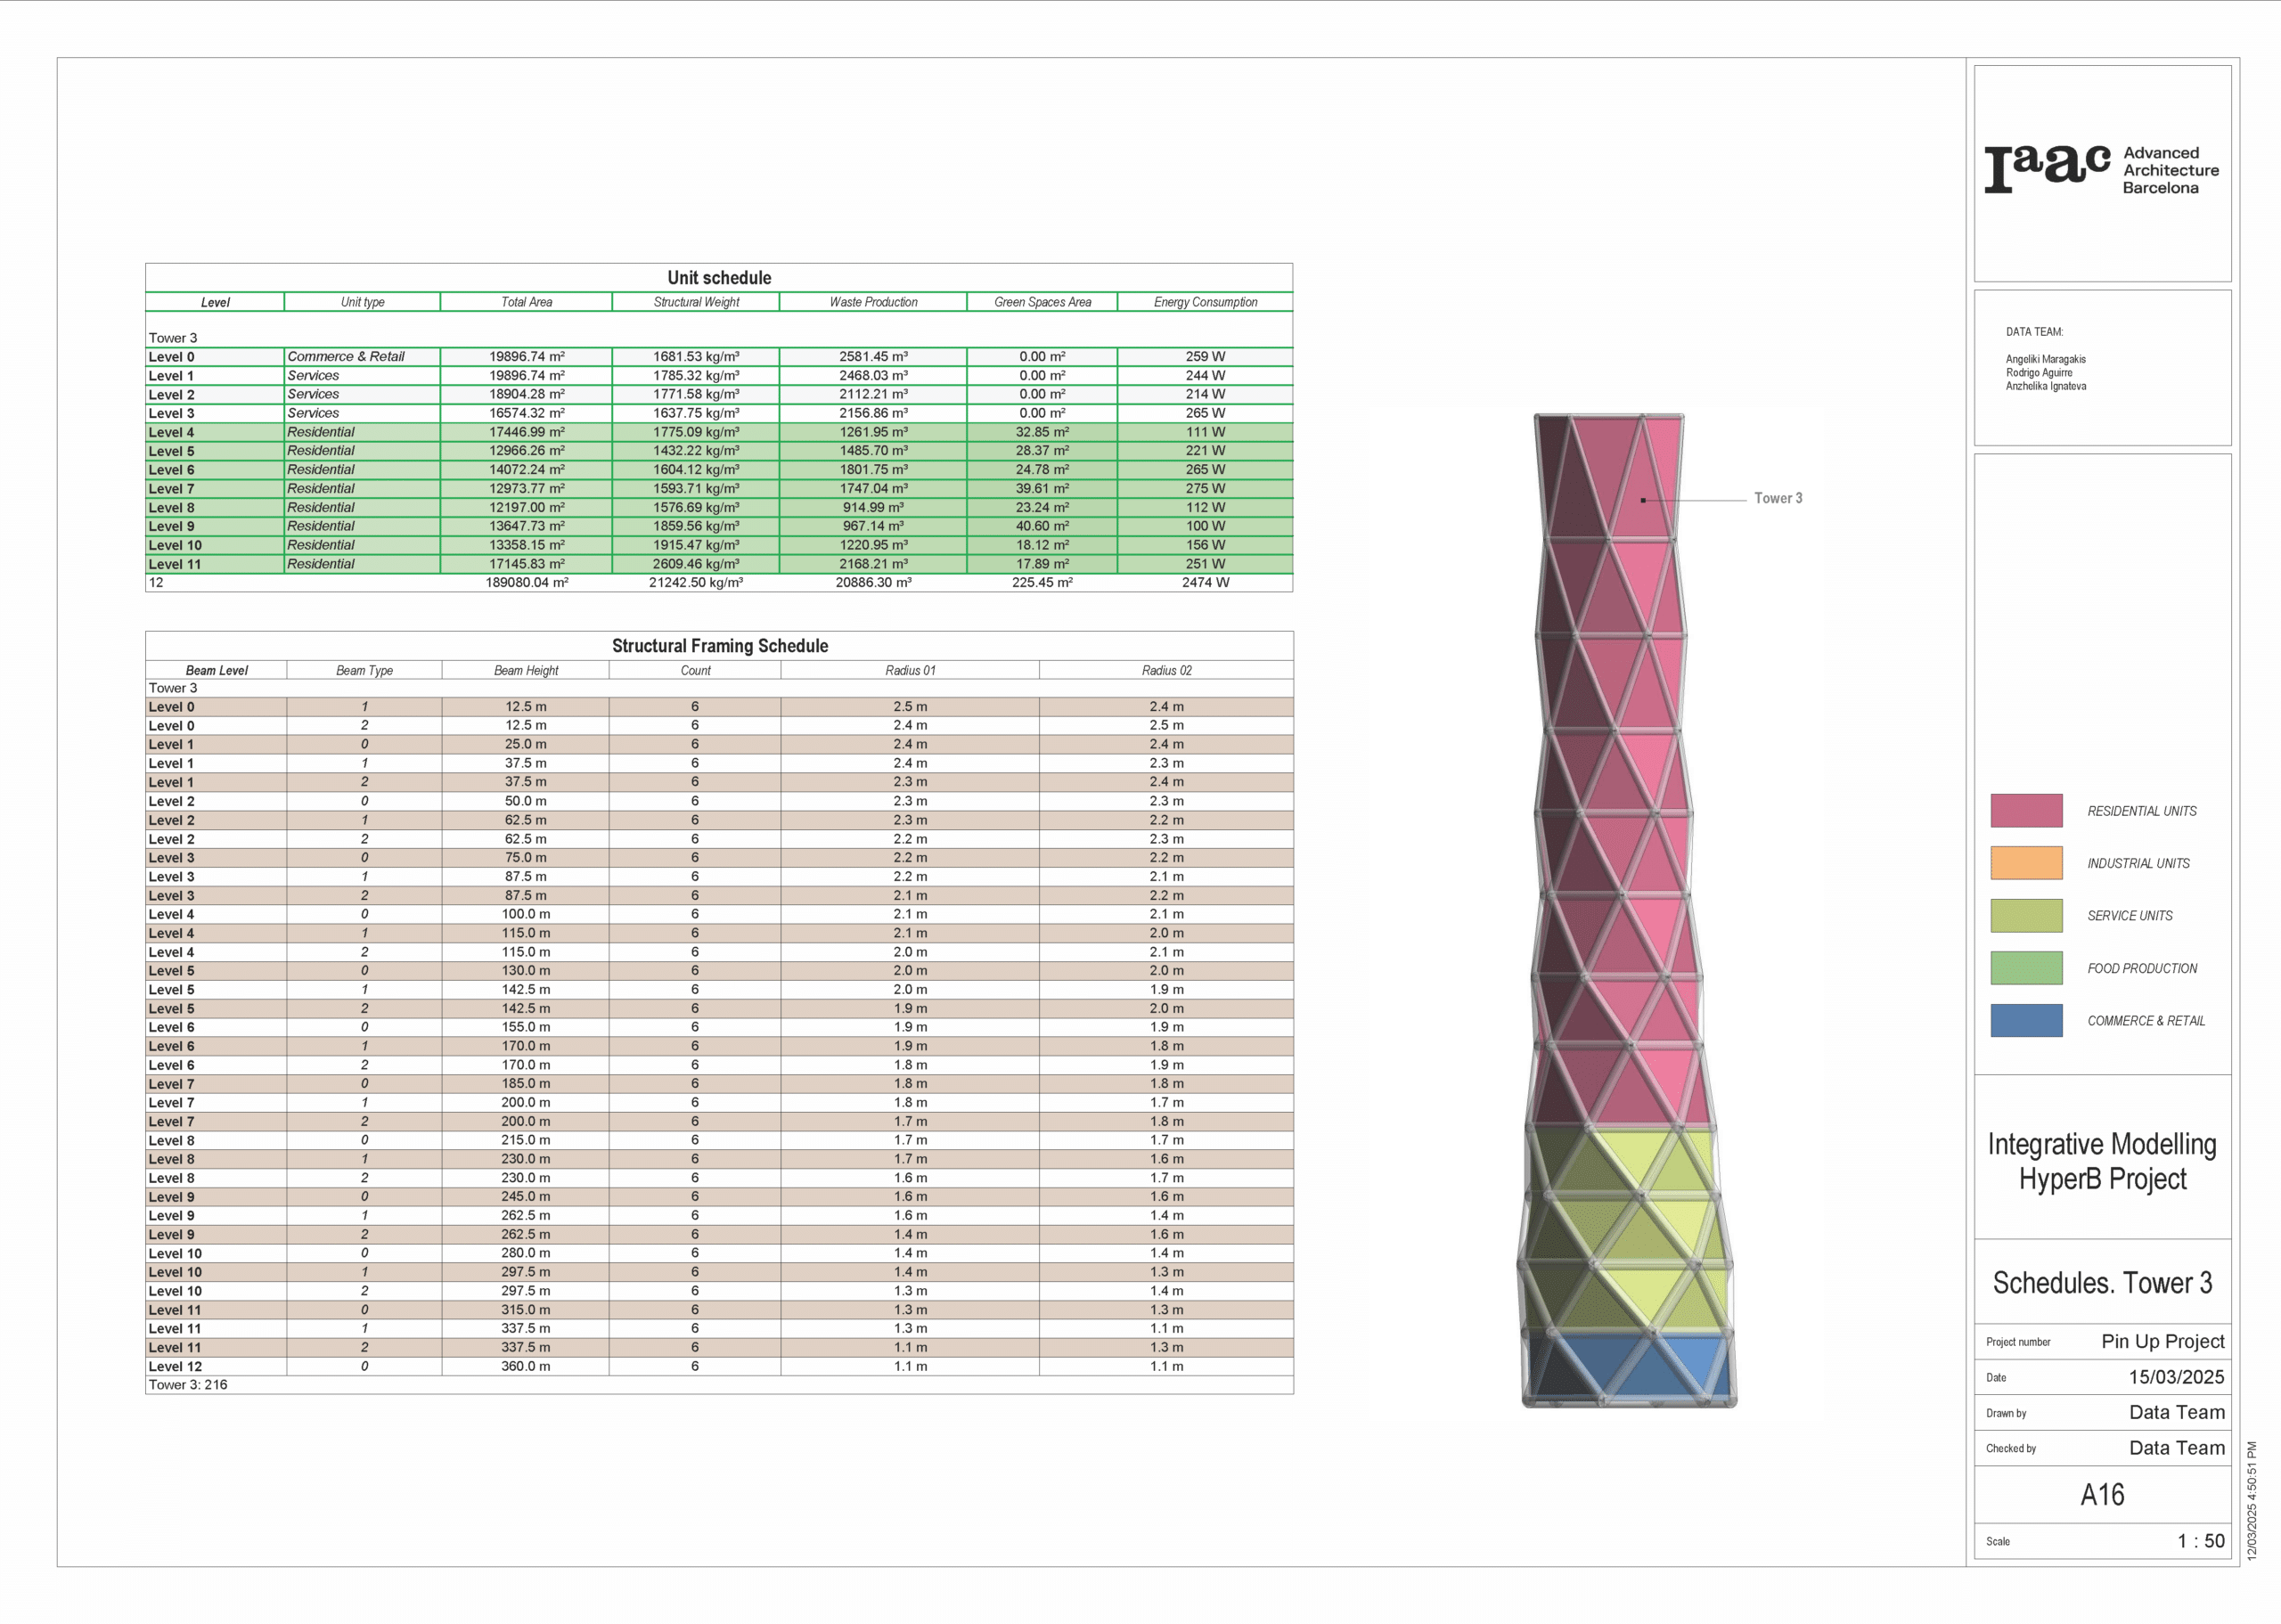
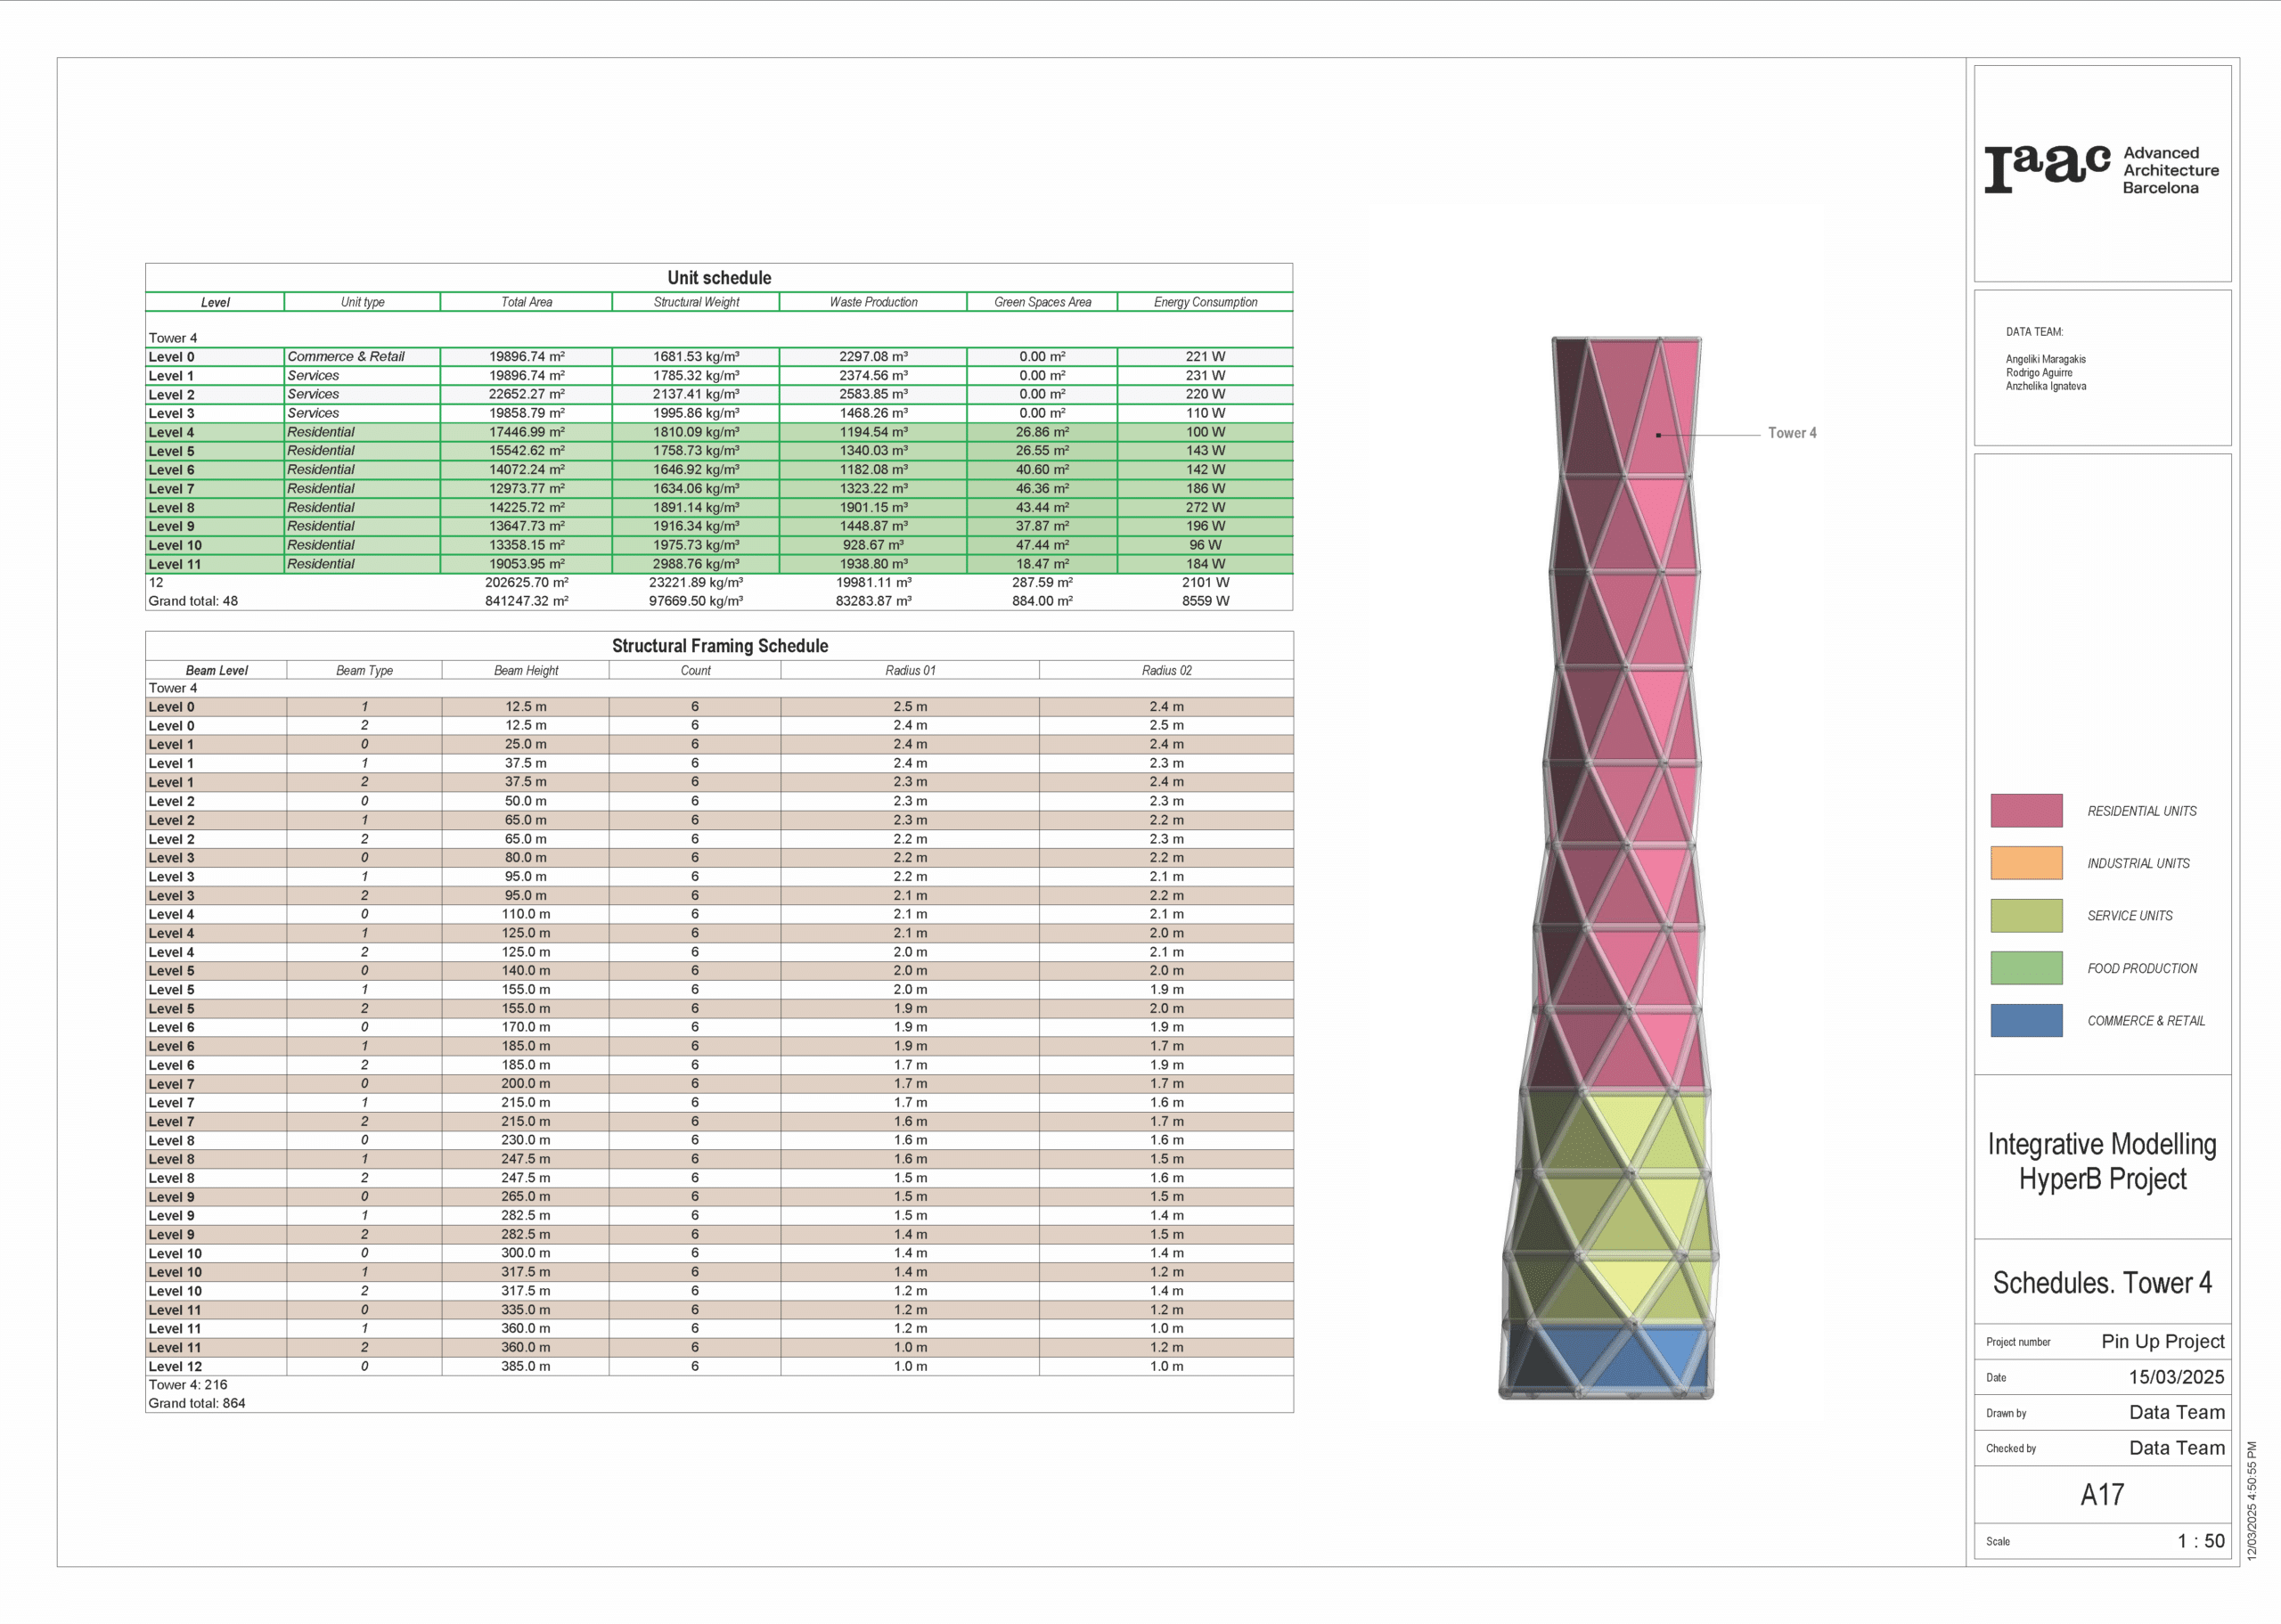
Here we can see a breakdown of this zoning geometry, and the following slides schedule our shared parameters that we collect from each design team.
Each schedule is organised by tower and provides both a unit schedule showing the spatial and environmental statistics, and a structural framing schedule for the beam type, radius, and count.