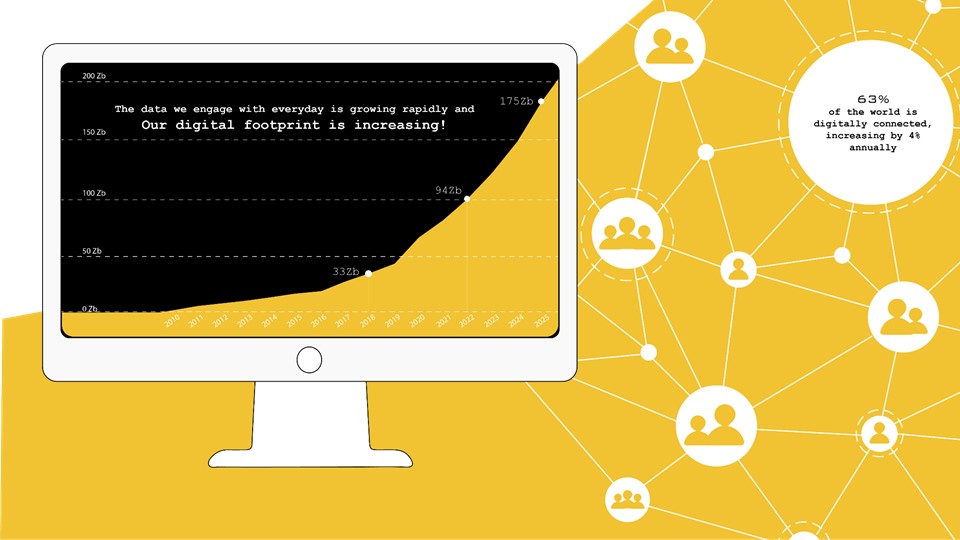
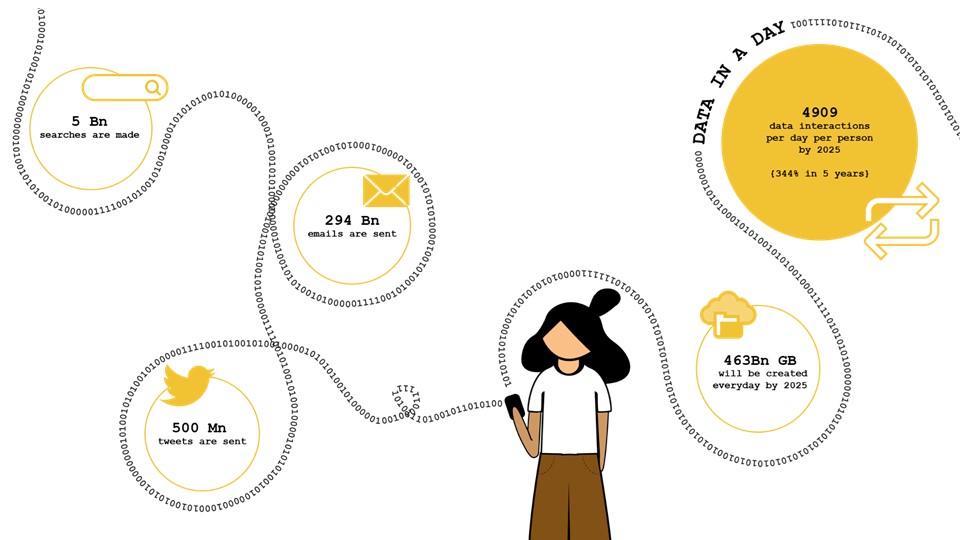
The data we engage with everyday is growing rapidly, and our digital footprint is increasing! With the cyber-physical convergence and the fast expansion of the Internet, Volume of information created, copied, captured, and consumed worldwide went form 33 zettabytes in 2018 to an expected 175 zettabytes in 2051! That’s close 500% increase in 5 years. By 2025, 463Bn GB will be created everyday. Due to tighter interactions between human users and their devices, we will have roughly 5000 interactions per day per person by 2025 which is roughly 350% increase from 2018.
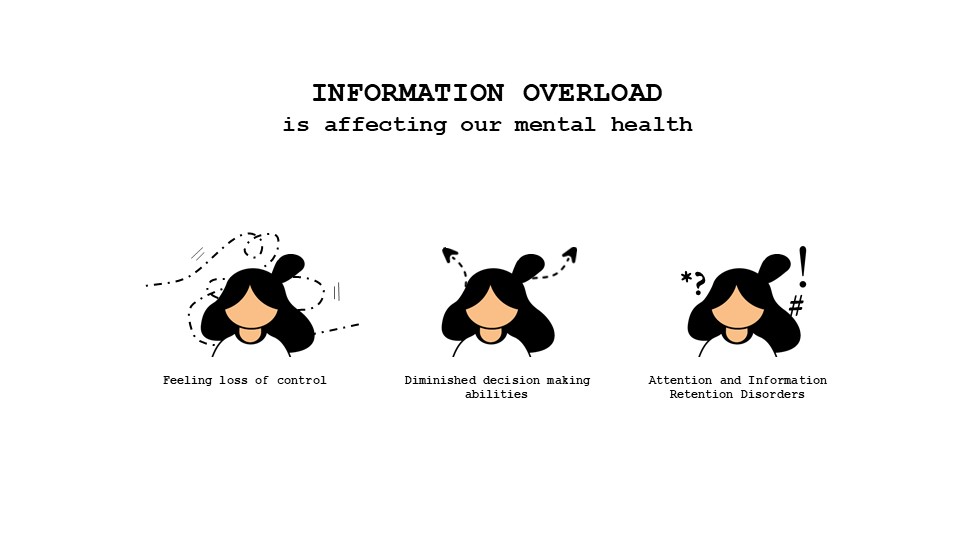
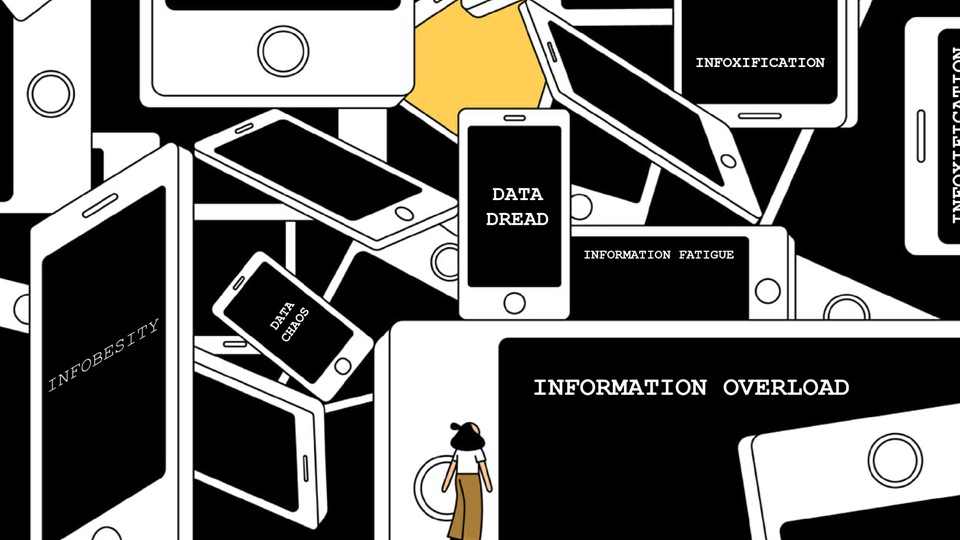
Information Overload
With increasing cyber physical convergence and more access to data, a survey concluded that 80% people experience information overload – which contributes to daily stress and impacts cognitive processes.
There are 4 pressure points when people and online systems interact which cause the overload : the attention economy – due to which we are bombarded withy new information in short spans. ; choice architectures – which decides and manipulates the choices we make for consumption; online algorithmic curation – which taps into our behaviour to curate content that we cant control and therefore may be accessed to irrelevant information; And us being prone to misinformation. The limitations of attention resources and need/demand for algorithmic curation of information has created a relationship between platforms and users that is asymmetric – Platforms have deep knowledge of users’ behaviour and data consumption patterns and choices while citizens know little about what data the platforms hold and how they are used to customize our online experience and what they consume digitally.
1.LOSS OF CONTROL:- 70% Europeans feel they aren’t in control of their digital identity. the overabundance has made people cognitively challenged. People understand that digital footprint is not only linked to social media but also to their activities through emails and navigation, and they should have more control on their data.
2.DECISION MAKING – No decision is made in an informational void – so with too much information, we have too many choices that confuse us with a lack of data contextualization, and redundant content. We have access to tools to select, to store and archive all the data, while our ability to retain less, and of not being able to access it or find it
3.ATTENTION DEFICIT DISORDERS -Due to attention economy or dopamine economy, Attention has become a commodity online with platforms vying for user engagement. The explicit goal is quantity, screen time and clicks, independent of the content itself. This has lead to increased ADD issues in the society.
There is an Imbalanced relationship between platforms and users! while they understand our behaviour and choices, we don’t have access or understanding of it.
Digital Wellness
‘Our common agenda’ – global digital compact by UN has declared greater focus on working towards greater internet accessibility, inclusivity, literacy and privacy. 1 in 4 People have made changes to their technology use to gain a greater sense of digital wellness. As digital wellbeing gains traction, people will increasingly examine their digital activities. We are becoming more curious about the information we consume.
Information Sense-making
The idea that many things we consume that we are interested in knowing, retaining and searching back to when we want – not directly straightforward/easy. One way to address some of the imbalance is with interventions that empower users to gain some control over their digital environments – by boosting their information literacy and their cognitive sense- making .Our current relationship with information is measured in quantity and time.
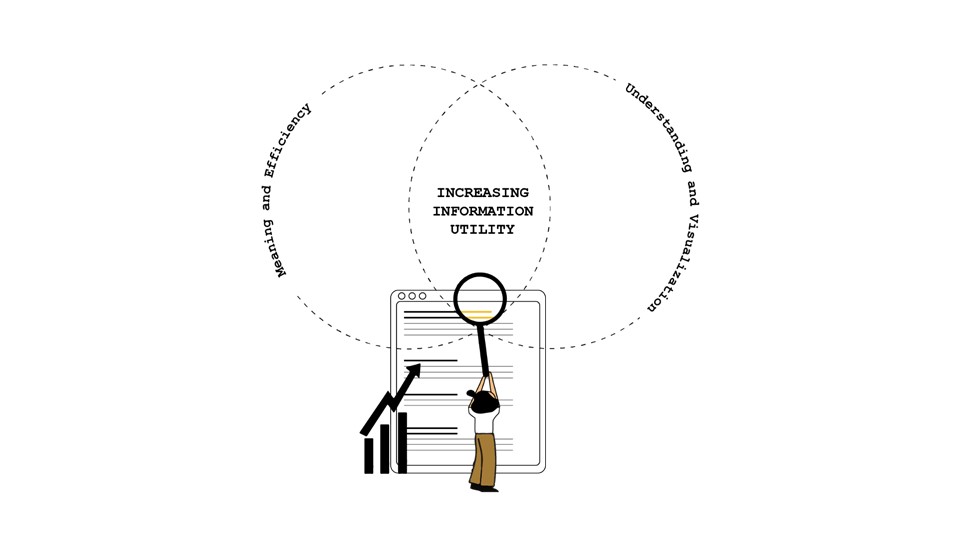
How do we improve information utility?
State of Art
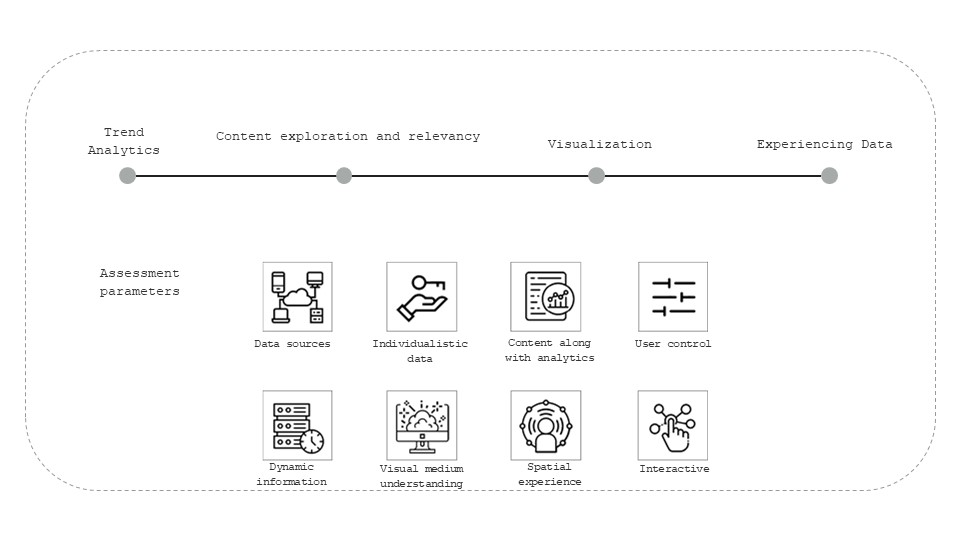
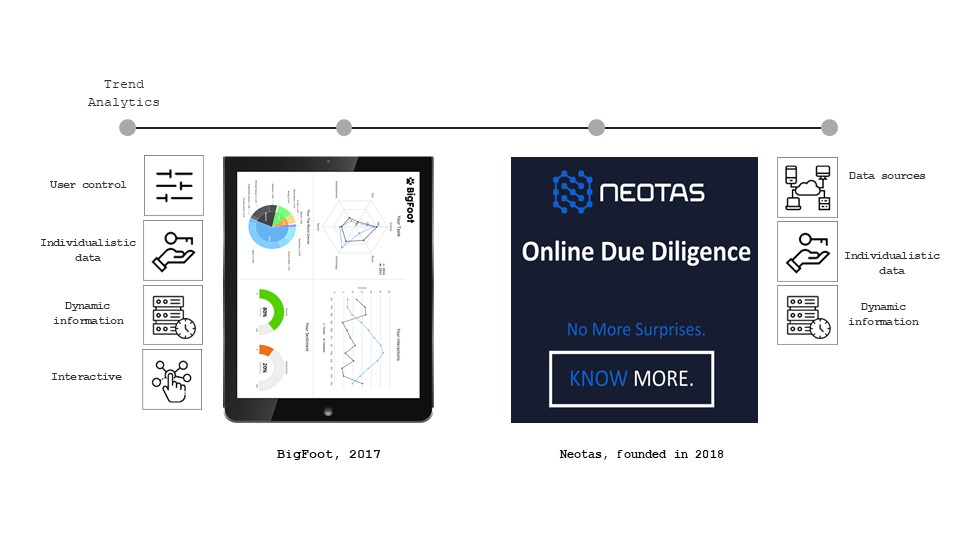

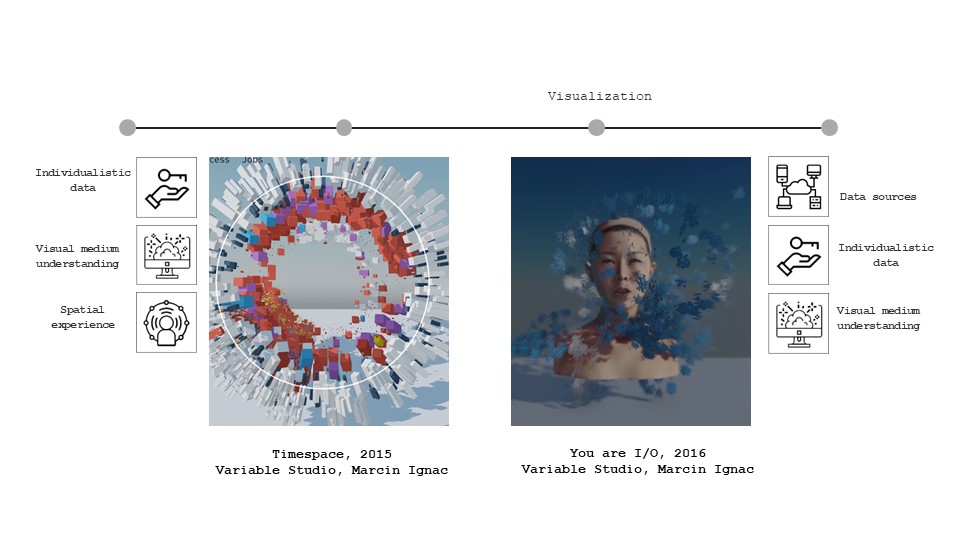
Proposed workflows of collection + Analysis are usually limited to a dashboards, Data visualization wrt to spatial context is less explored and Potential of AR as an experience tool for personal data visualization is not common. Looking at the Issues regarding Information overload, current relationship scenario between society and platforms, its crucial to have better relationships with technology, user-centric systems of data organizing and sensemaking incorporated into our daily lives.
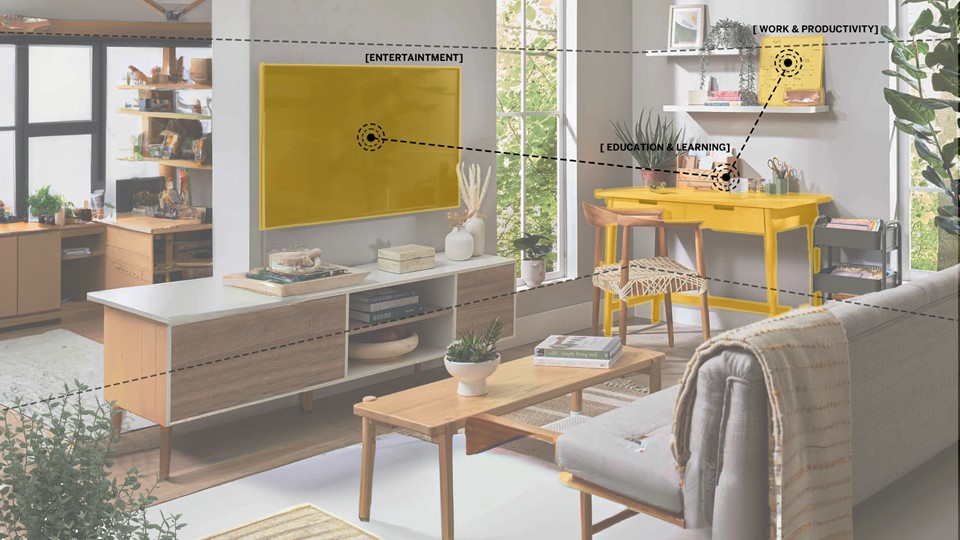
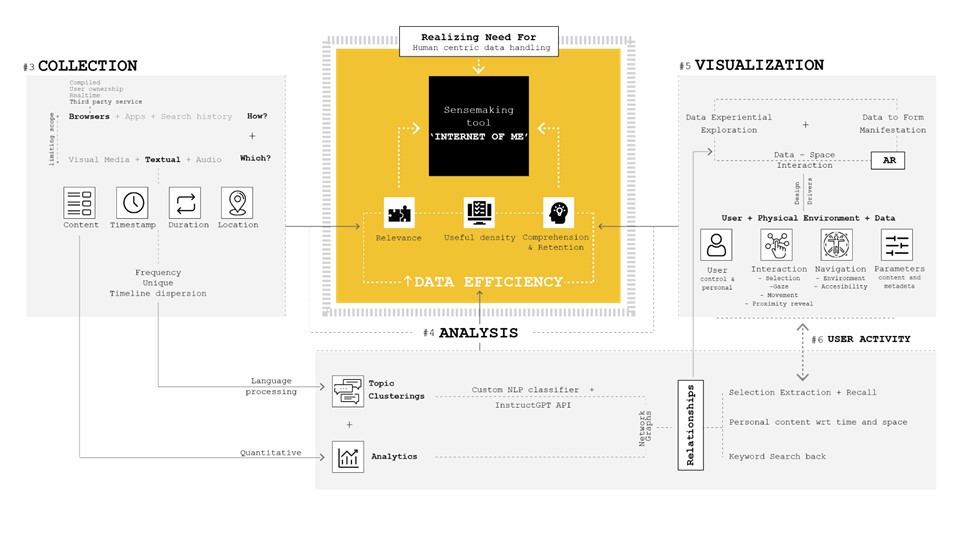
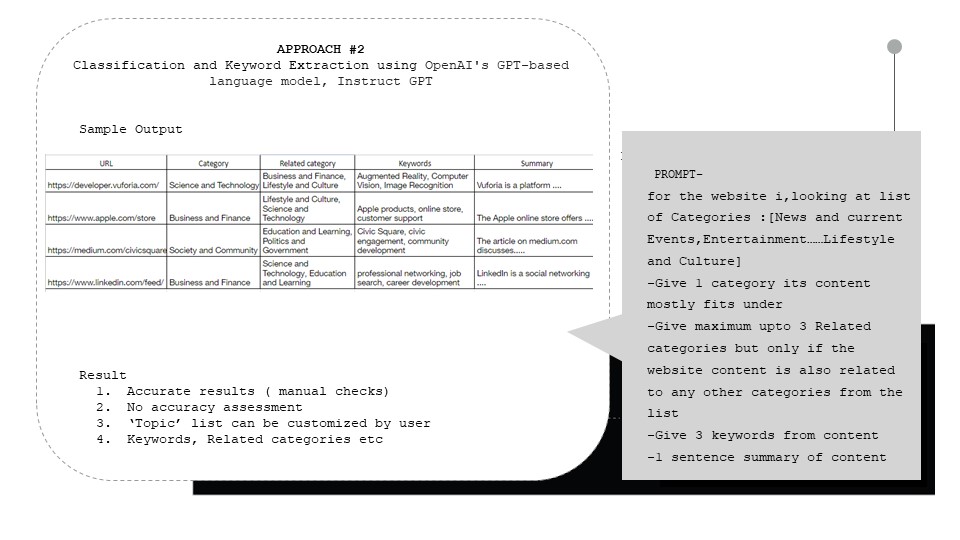
‘Internet of ME’ aims to create a personal sense-making tool that will enable users to self reflect using their data. The intent is to analyse and understand user digital consumption, by categorizing and extracting textual information consumed. The project will focus on AR visualization as a means of experiential understanding, approaching it from a spatial designer’s perspective.
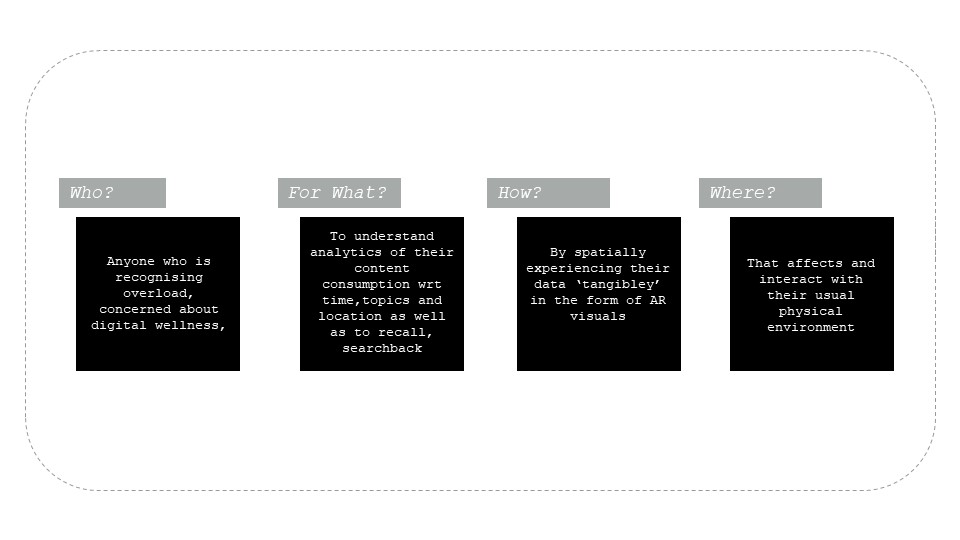
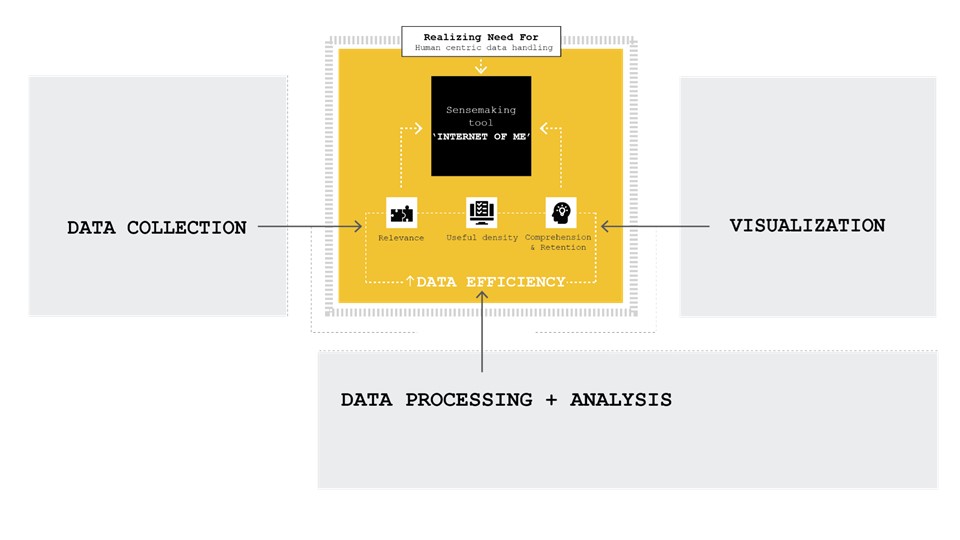
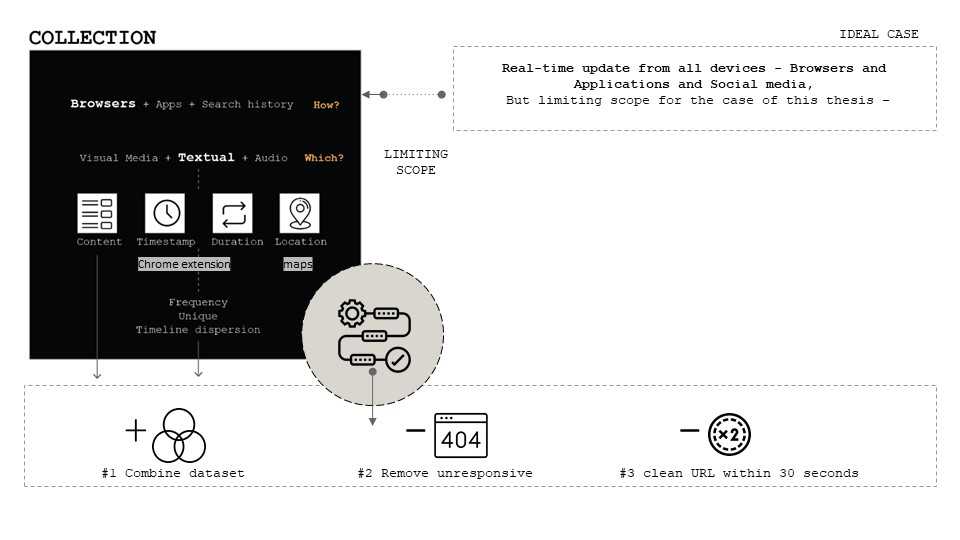
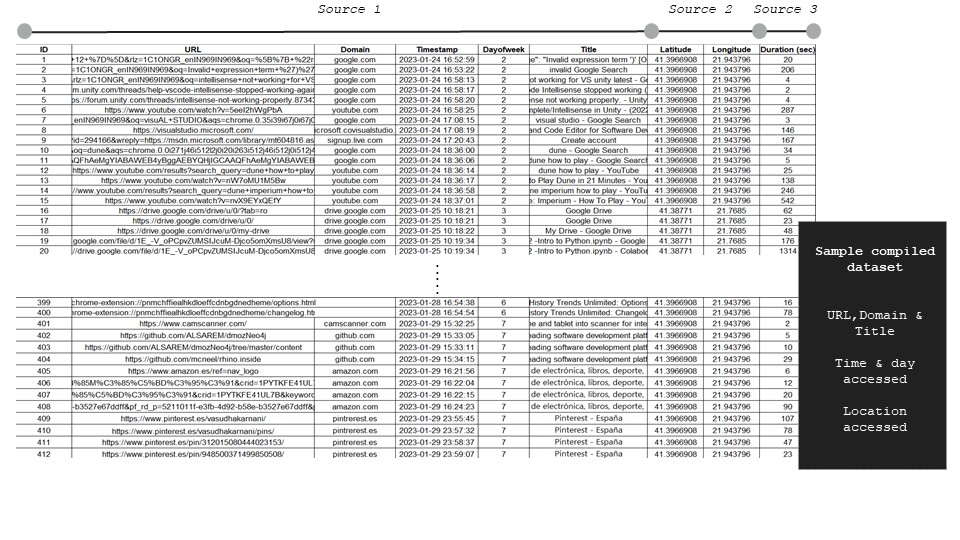
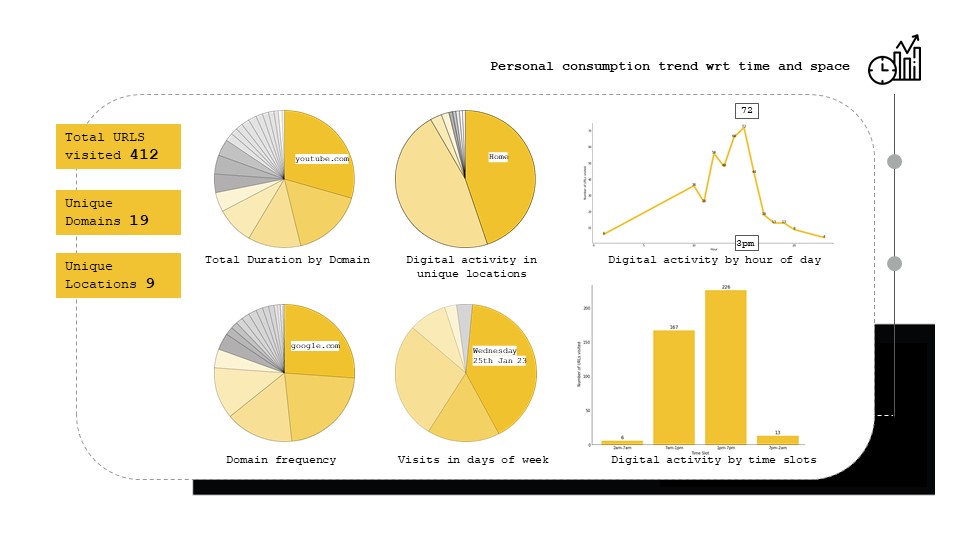
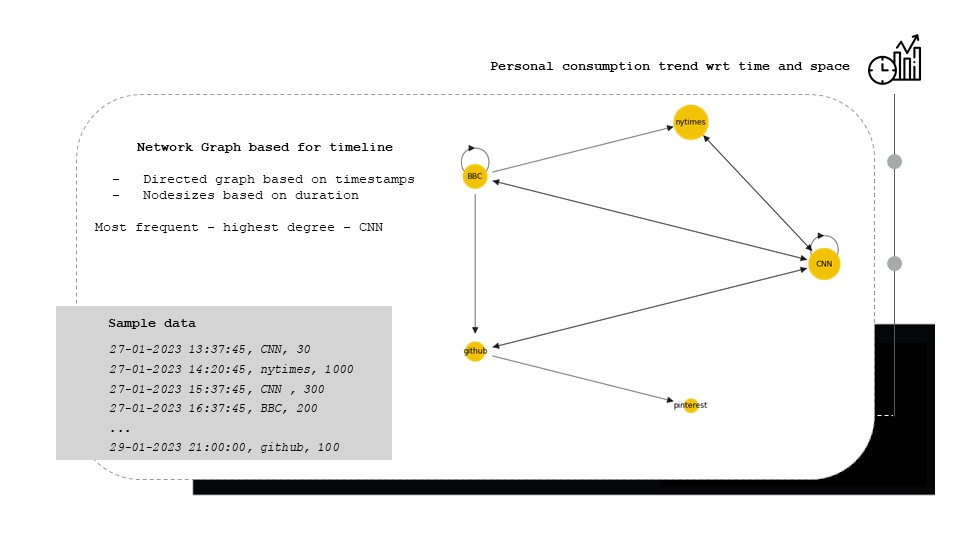
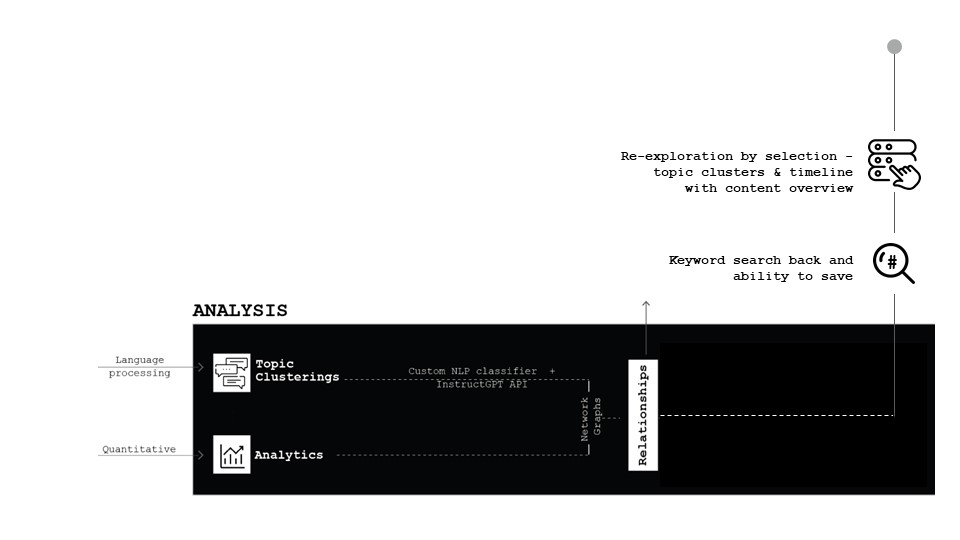
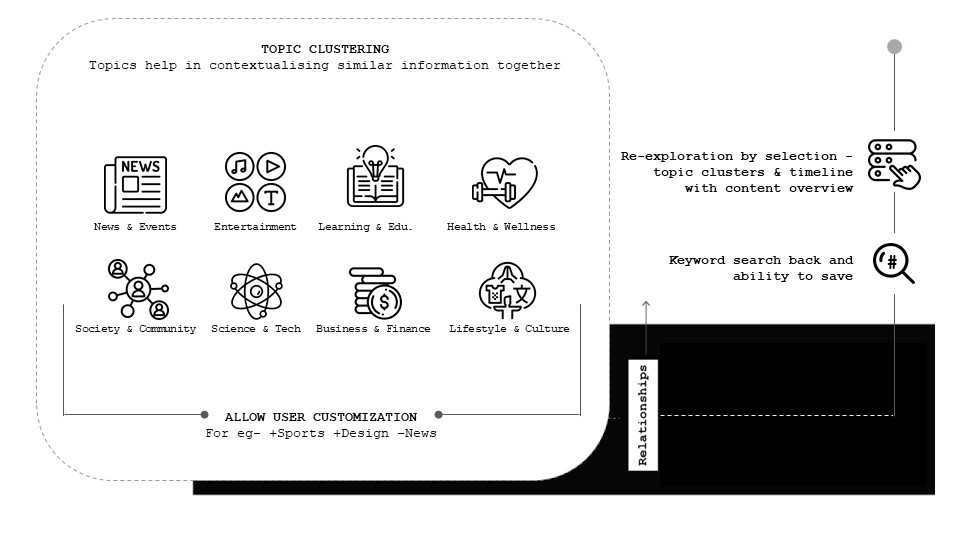
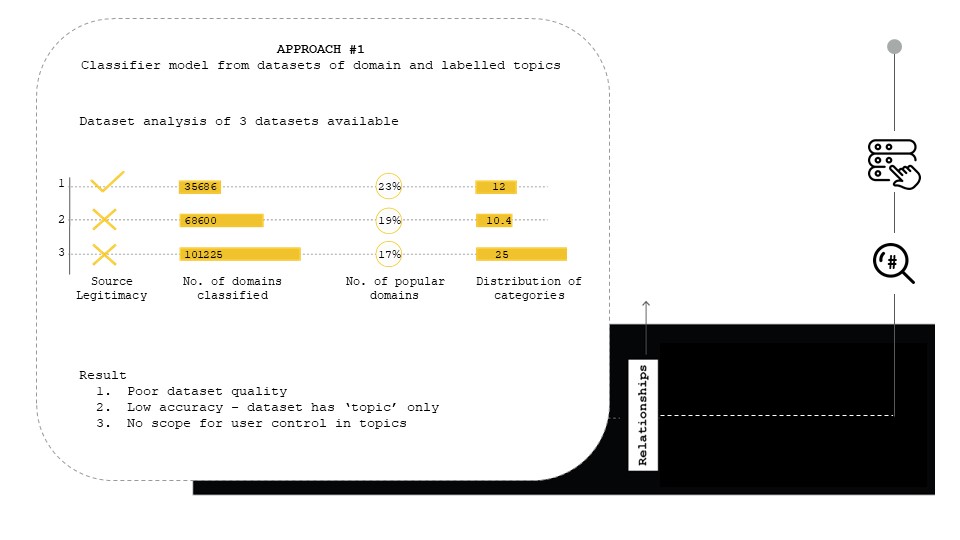
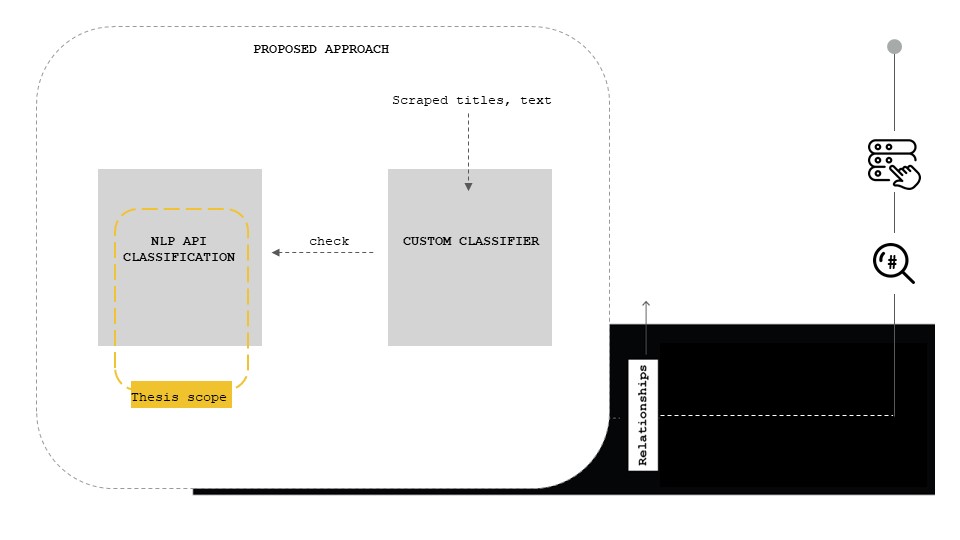
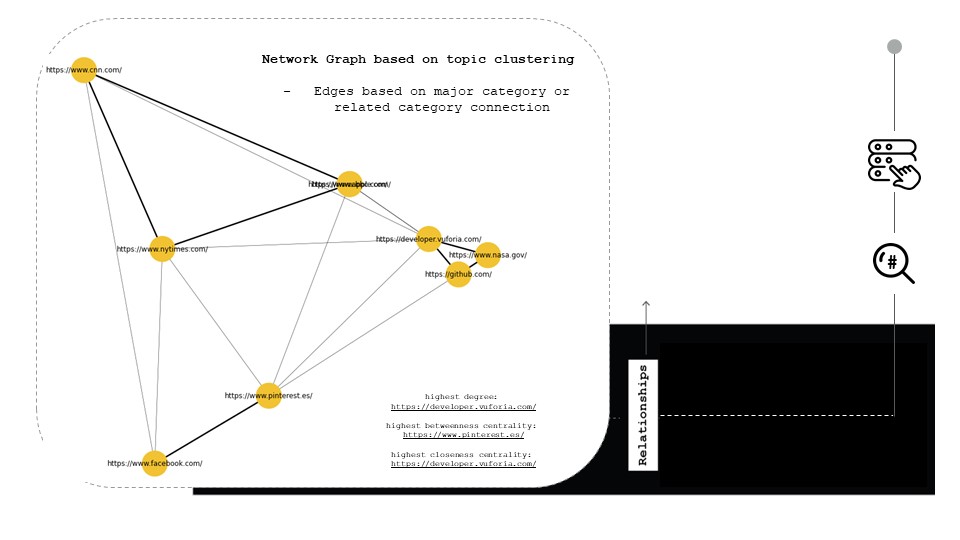
The project methodology is considering the reserach project in 3 parts and focuses on the workflow of user data collection, analysis, and visualization. Working within ‘The European Data Strategy’, 2020 to comply with privacy and accessibility terms, The tool uses browser extensions to extract the geotagged and timestamped history. Natural language processing models are used to categorize content consumed into meaningful clusters, while graph networks understand relationships and analytics. Experiential interaction through gestures, navigation, and selection facilitate keyword searchback, interconnectivity and identification of useful information for extraction.

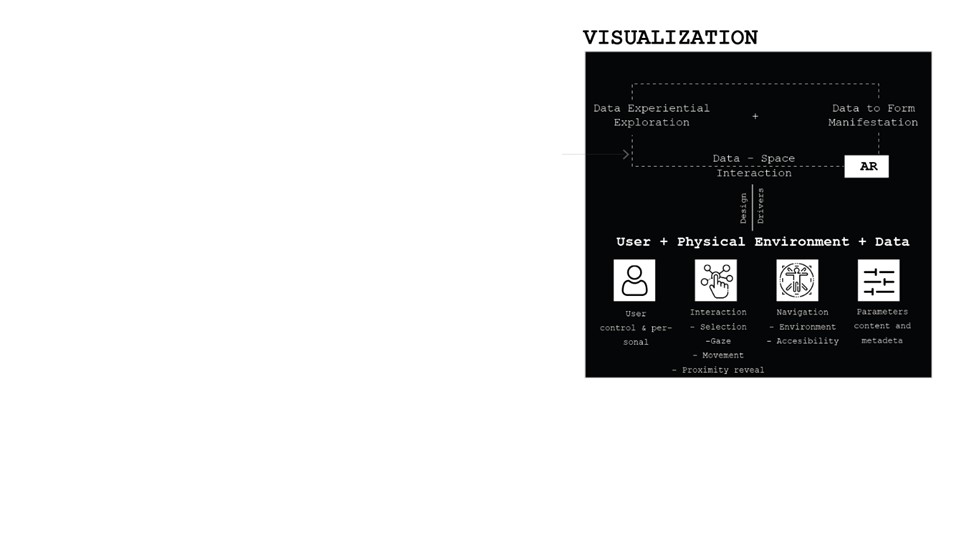
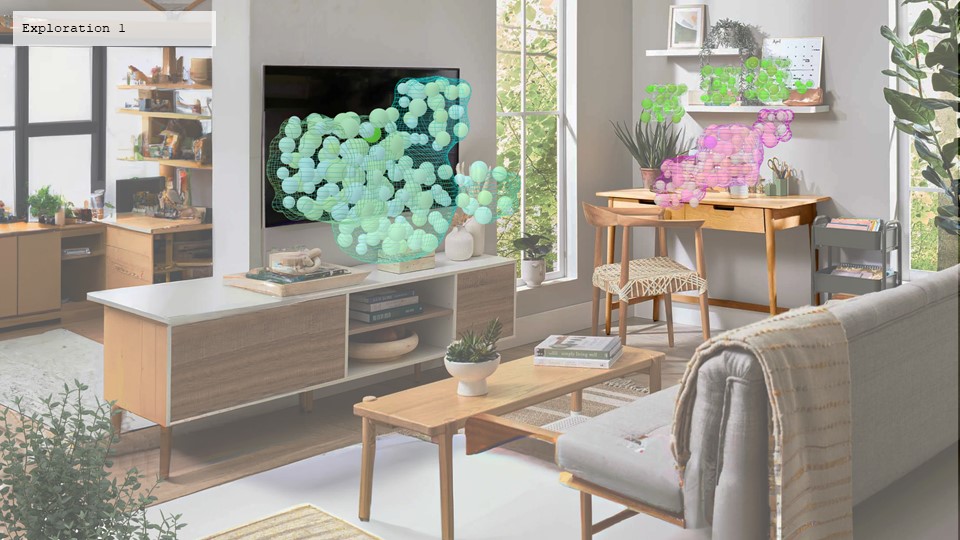
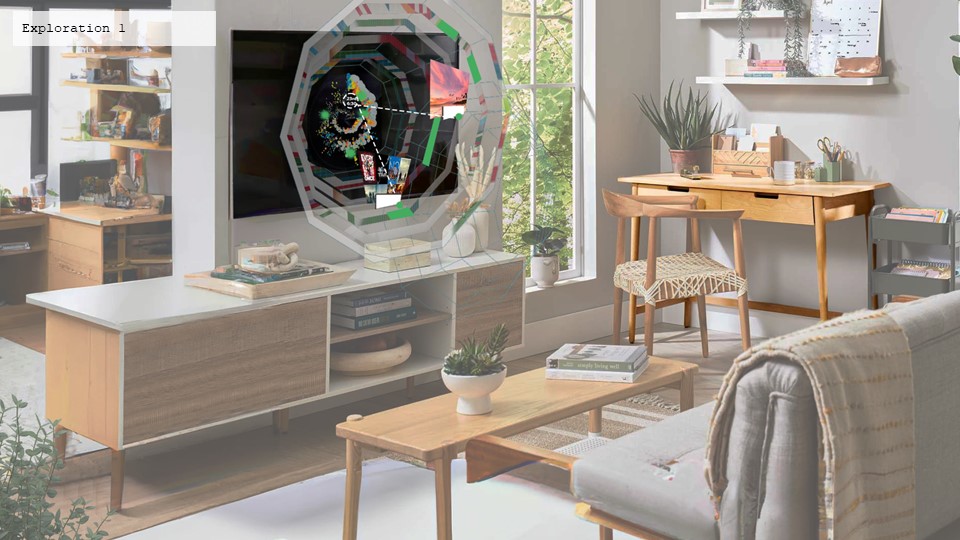
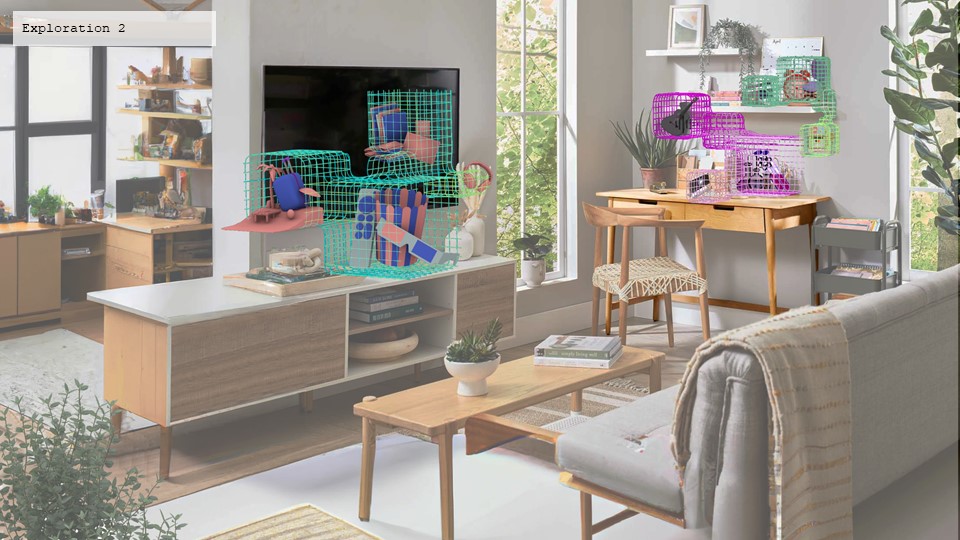
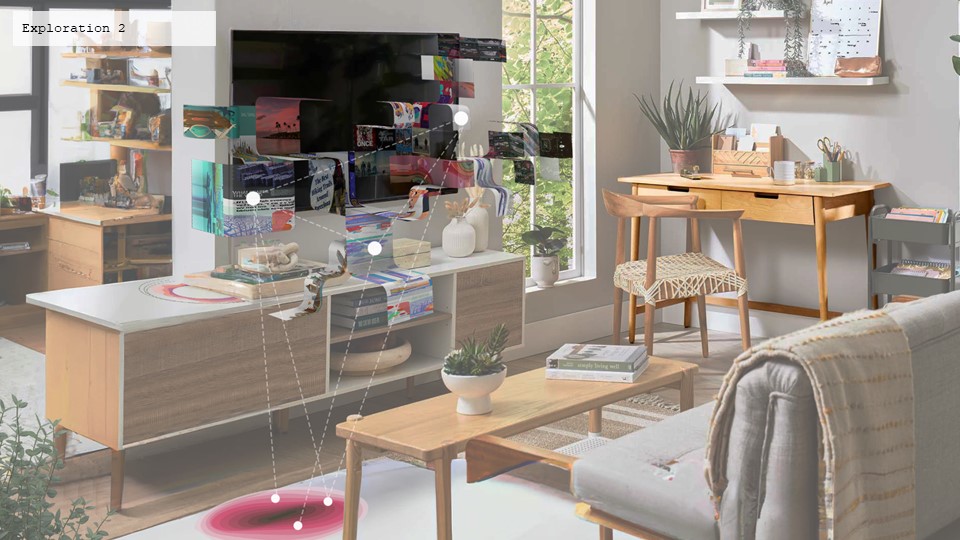
Visualization Exploration