
There are different types of loneliness and different causes for each type. The social media induced loneliness as described by Sherry Turkle in her book Alone Together: Why We Expect More from Technology and Less from Each Other (2012) is different from the loneliness of feeling alone in a crowd in a very large city which is different again from feeling alone because there is nowhere locally accessible to meet people. This last type of loneliness is particularly important as it is increasingly common in suburbanized cities that often have aging populations where citizens are not only disconnected from each other, they don’t have any places to connect.
In Ireland, this is occurring in rural communities where churches and pubs used to be spaces for communities to gather. The first are far less popular with younger generations and the second are going out of business. Younger people are forced to leave for the big cities for work and those that get left behind are separated from their families and with no spaces to connect with those around them. Greater Melbourne was described as having similar problems in its suburbs by chief architect Rob Adams. His online lecture with Gil Penalosa summarizes the city of Melbourne’s history and its various projects of last few decades as well as highlighting the problem of suburbanization for the city going forward
Not All Types of Loneliness
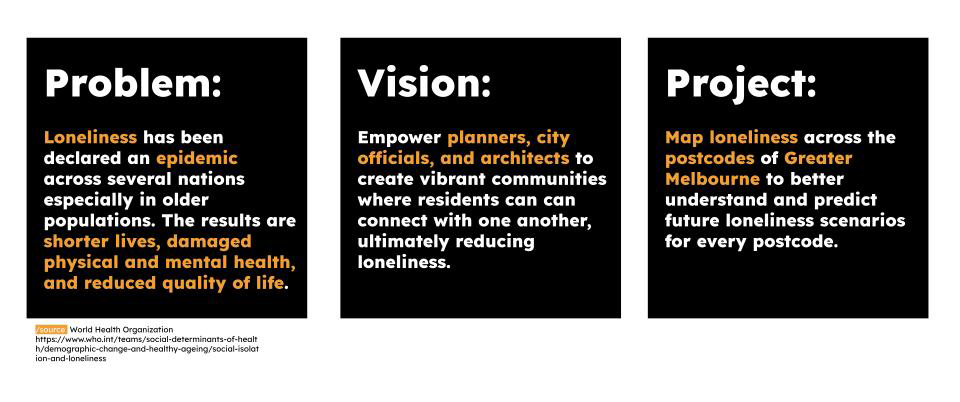
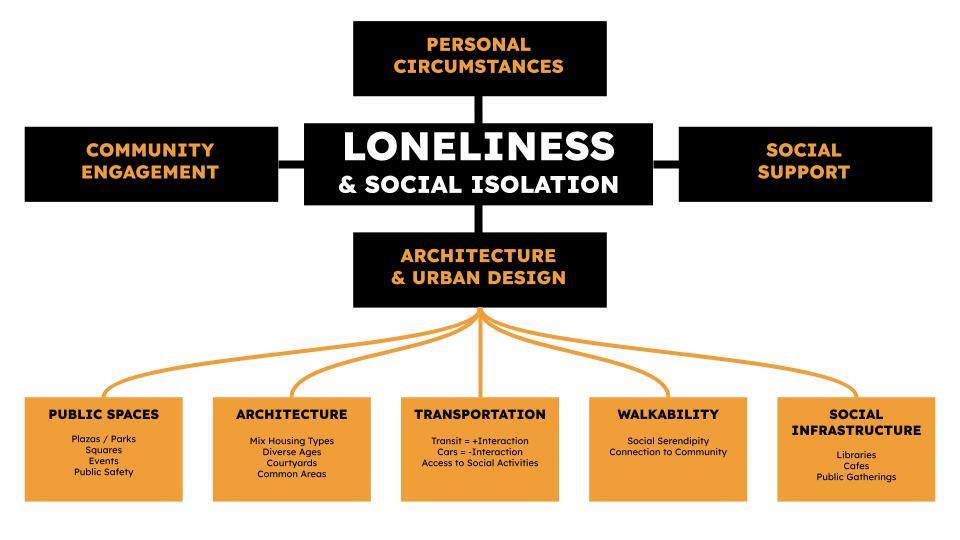
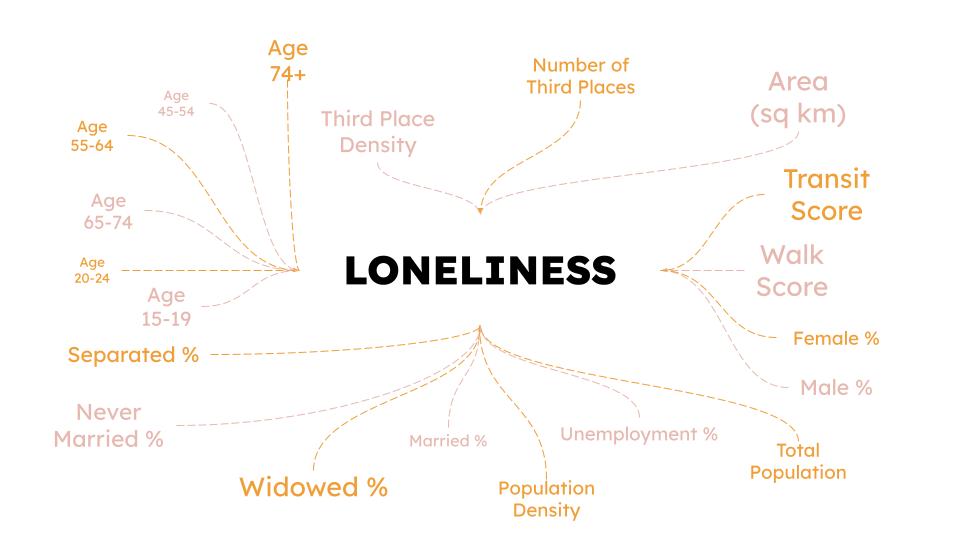
Architects and planners don’t have much control over all the types of loneliness, so our group is laser focused on the type they do have control over: The lack of third spaces and the inability for a population to interact locally. Public spaces, architecture, transportation, walkability, and social infrastructure all influence this type of loneliness.
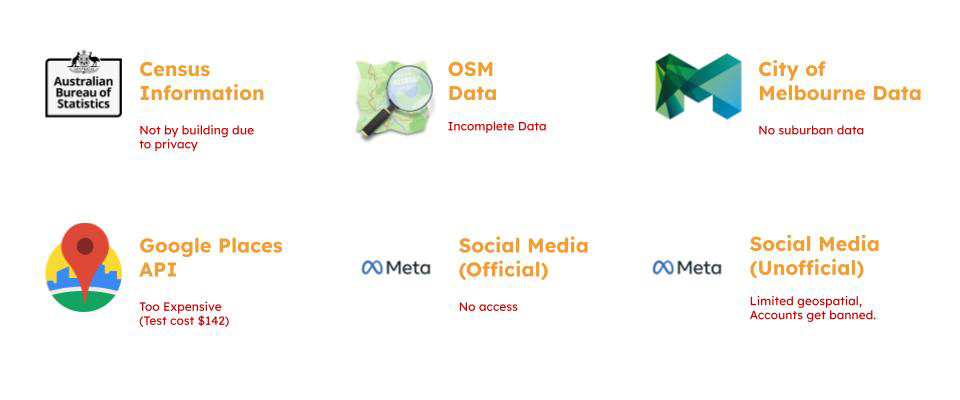
Failed Attempts to Collect Data
We tried to collect data from the national census information for a building-by-building project or by block-by-block. Due to privacy concerns this data was not that specific. OSM data seemed incomplete when compared to Google Maps. City of Melbourne data did not cover Greater Melbourne. Google Places API was too expensive to get all the third places in Greater Melbourne. We had great hopes of getting data from social media but found the official channels to not provide anything useful and unofficial options quickly got blocked.
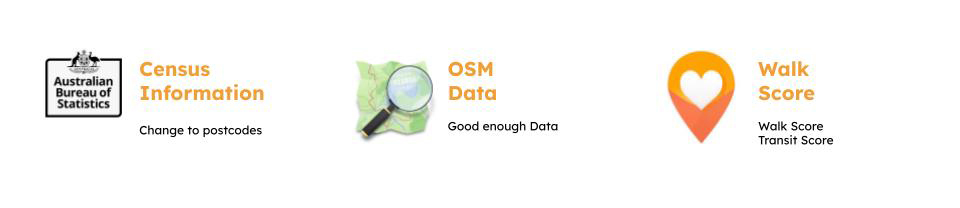
Shift Project to Postcodes
Our focus shifted to investigating Greater Melbourne’s postcodes where census data was more obtainable. We were able to get latitude and longitude coordinates of 5,791 unique third places (restaurants, cafes, bars, places of worship, libraries) around greater Melbourne from OSM. Walkscore.com also offered us a walk score and a transit score for every post code.
Creating a Dataset
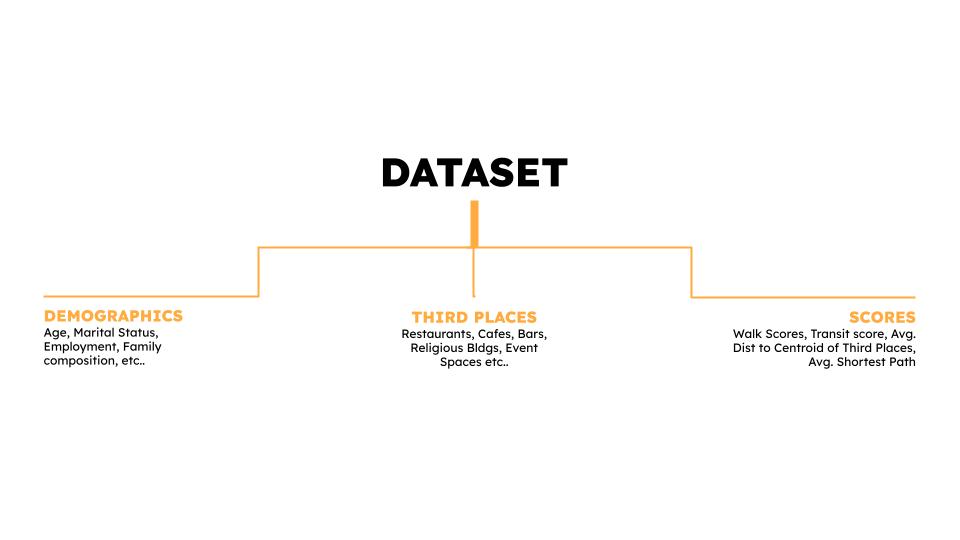
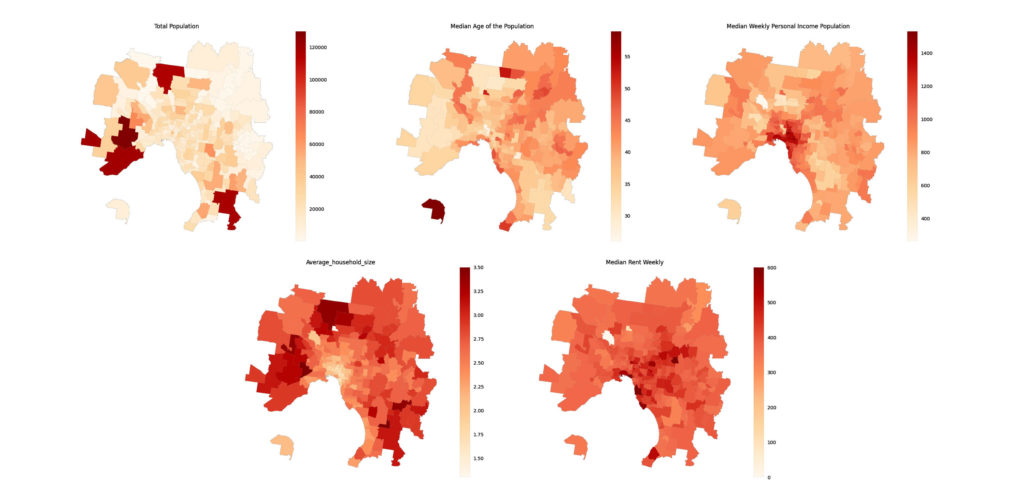
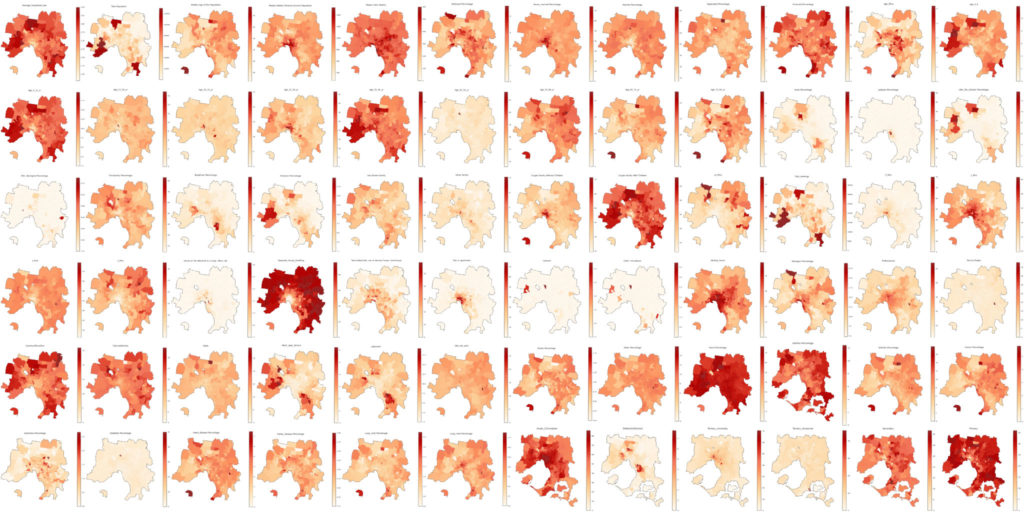
Demographics
Various demographics were obtained from the Australian Bureau of Statistics for the postcodes of Greater Melbourne. This data included information about each postcode’s age, education, occupation, marital status, family composition, dwelling structure, motor vehicles owned, method of travel to work and citizen health.
Third Places
Third place data was scraped for each post code from Open Street Map (OSM) with a buffer time between each loop to avoid the API restrictions. Plotted on this map in the background is population density per postcode and clickable icons show locations of third places.
Interactive Map
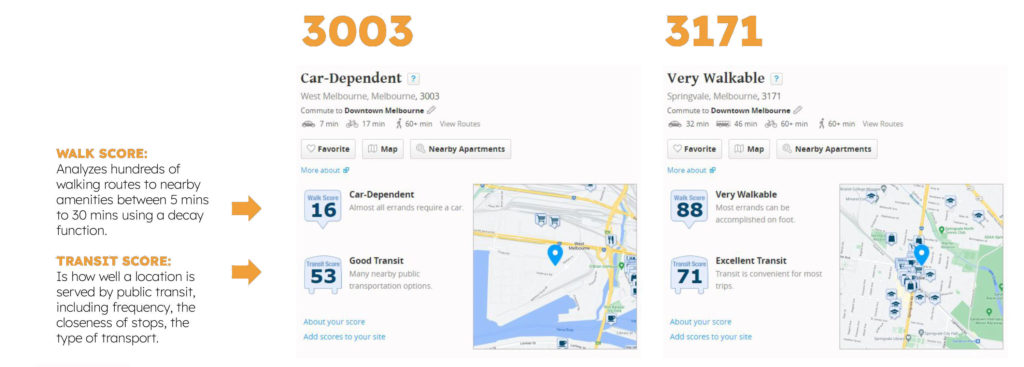
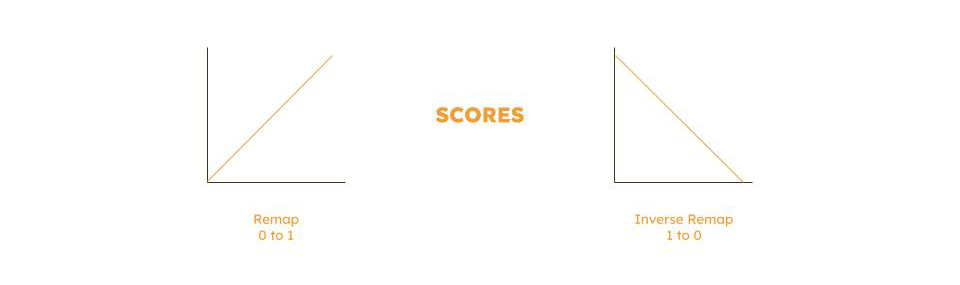
Scores
Walk scores for each post code analyzed hundreds of walking routes between 5 and 30 mins using a decay function and transit scores measure how well each postcode is served by buses and trains, measuring their frequency and number of stops
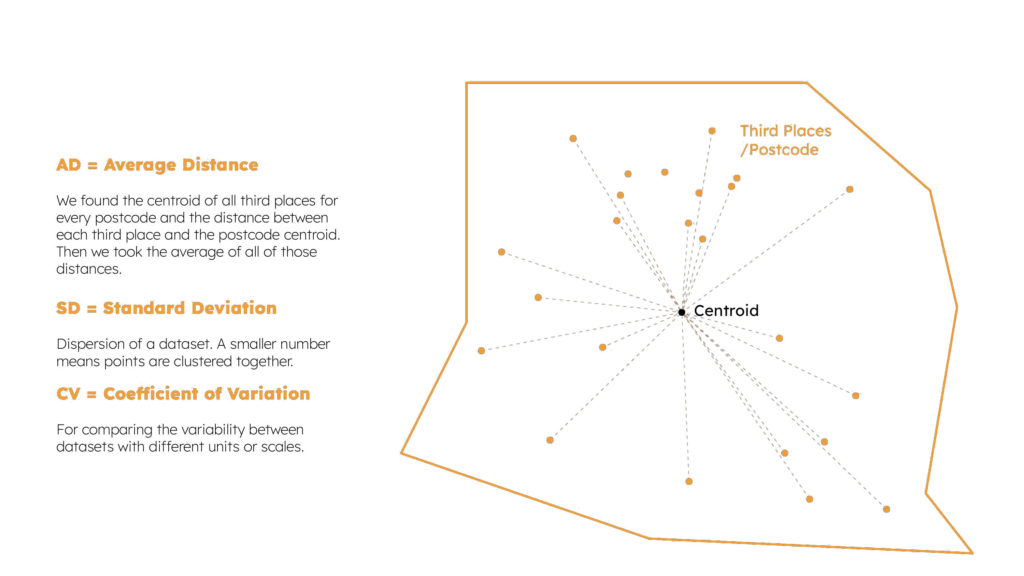
We found the centroid of all the third places in every postcode using the lat, lon coordinates from our OSM data. Average distance to the centroid was calculated for every postcode. Standard deviation helped us understand whether the points were clustered together and a coefficient of variation was used to compare postcodes of different scales.
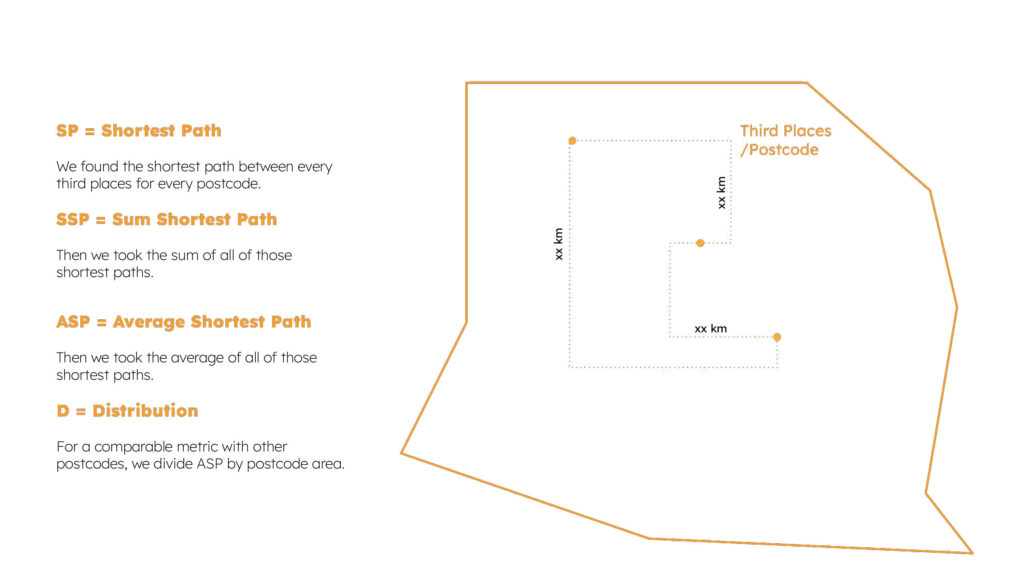
The shortest path between every third place was calculated for every postcode, then the average length for all shortest paths was divided by the area.
Model
We want to predict third place density and third place distribution to recommend options to make postcodes less lonely. After gathering relevant data, we extracted the factors that contribute to loneliness and classified the postcodes according to their loneliness potential. We split our data into two sets, ones with high loneliness potential and the other with low loneliness potential.
Those with a lower loneliness potential were studied and their features extracted after exploring correlations and reducing dimensionality so that we could build a machine learning model that makes recommendations for high loneliness potential postcodes based on the data from postcodes with low loneliness potential.
A score was calculated and remapped either from 0 to 1 or inversely remap it from 1 to 0.
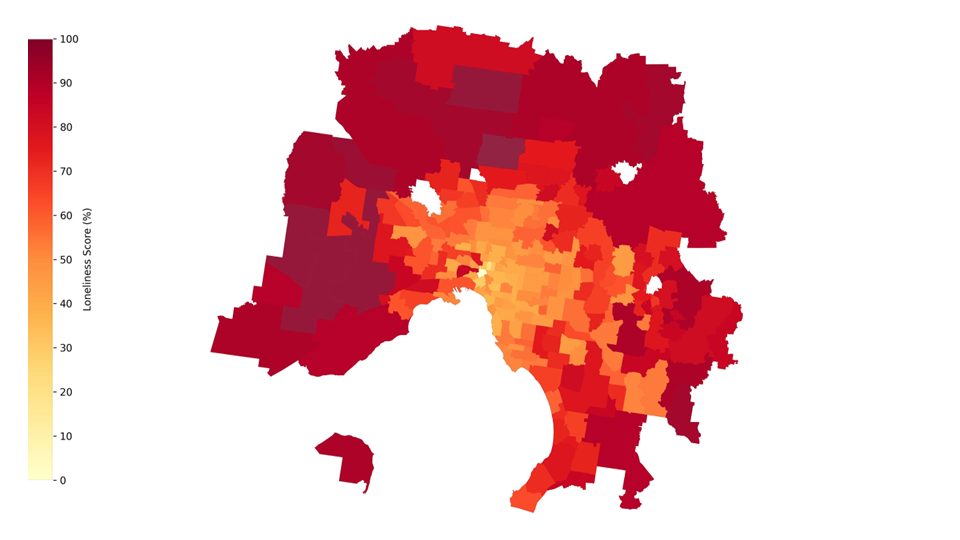
Classification
Scores were fit in a formula that resulted in a value between 0% and 100% for loneliness potential. The Gini coefficient (which usually measures income distribution) was used in some cases to measure diversity for certain categories such as age. The distribution of loneliness matched our earliest assumptions and was plotted on a map of Greater Melbourne as below.
Interactive Map
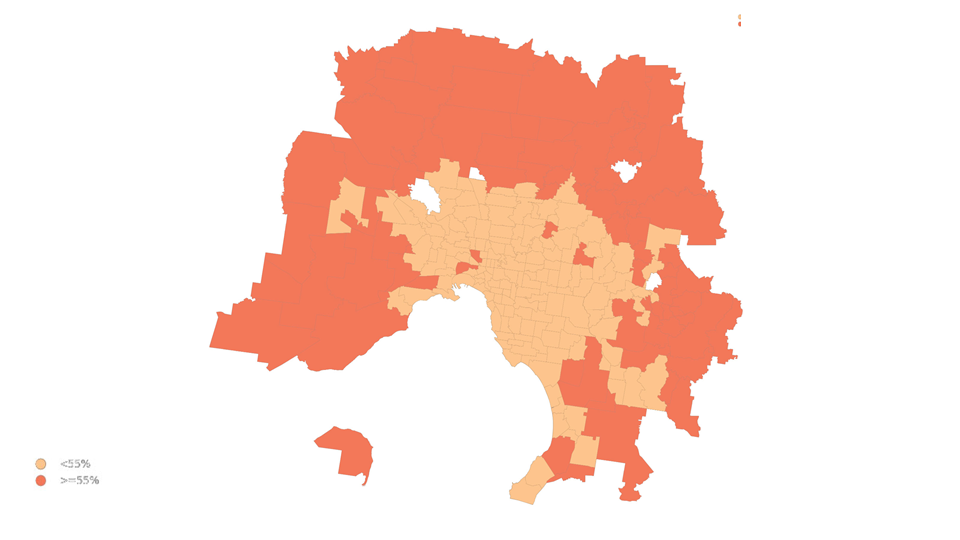
We split postcodes according to a threshold of 55% into lonely areas and less lonely areas.
Less lonely areas were used to learn from and train the model to eventually propose amendments in the urban configurations of the areas that are more likely to be lonely.
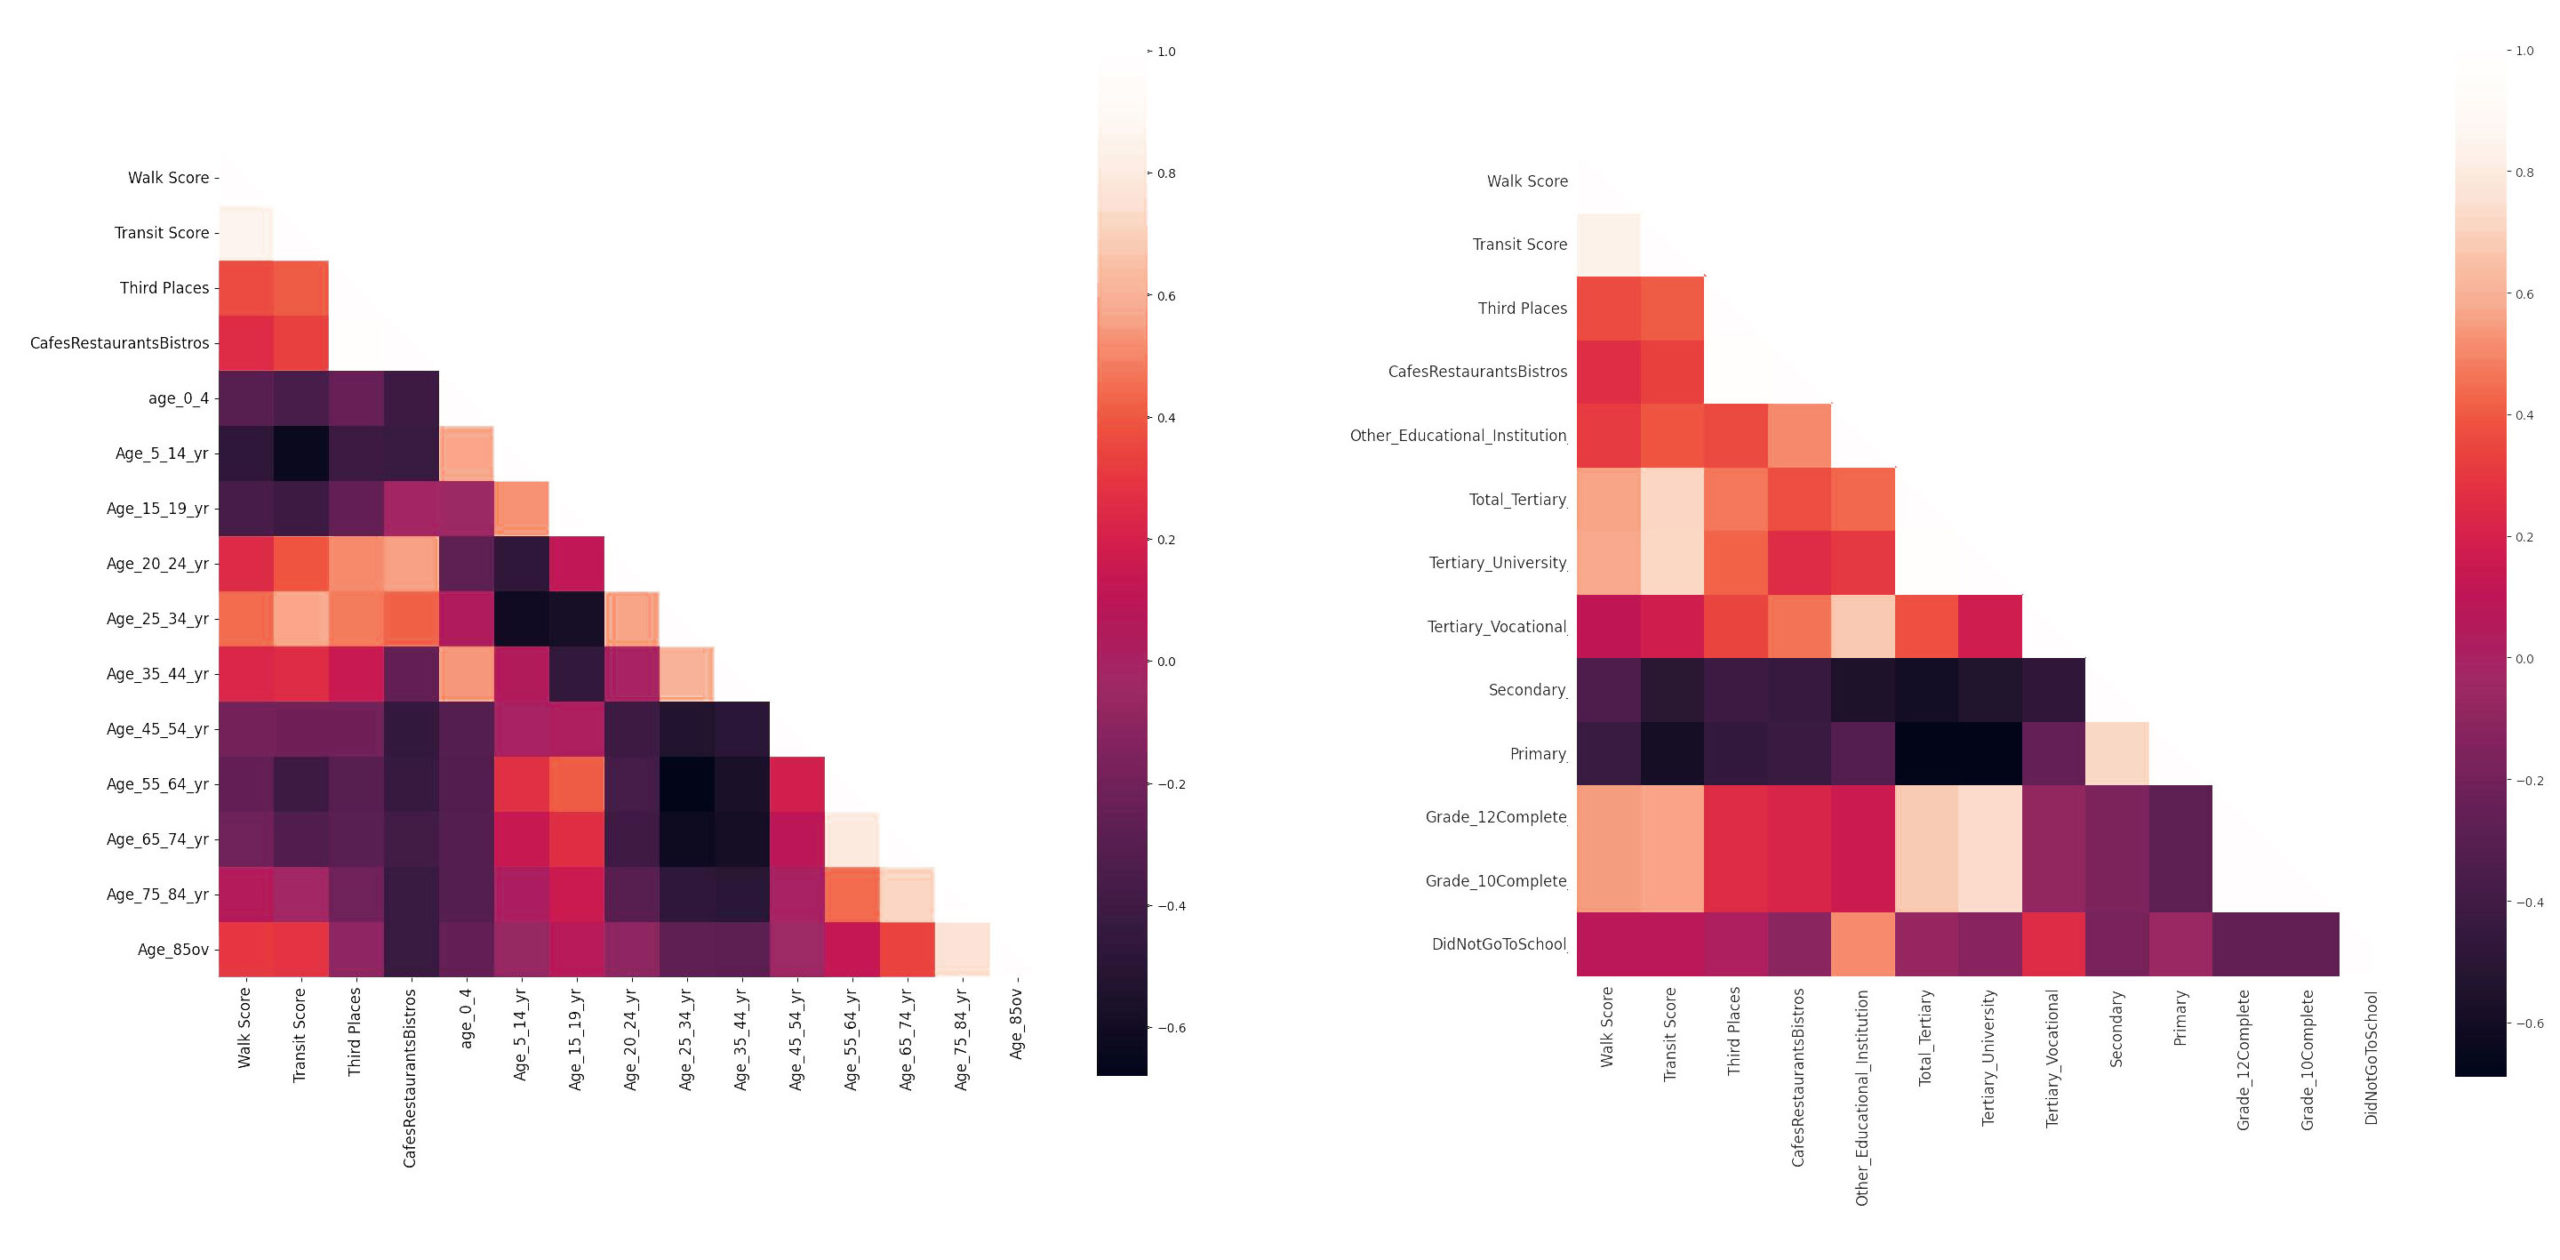
Correlation Matrices
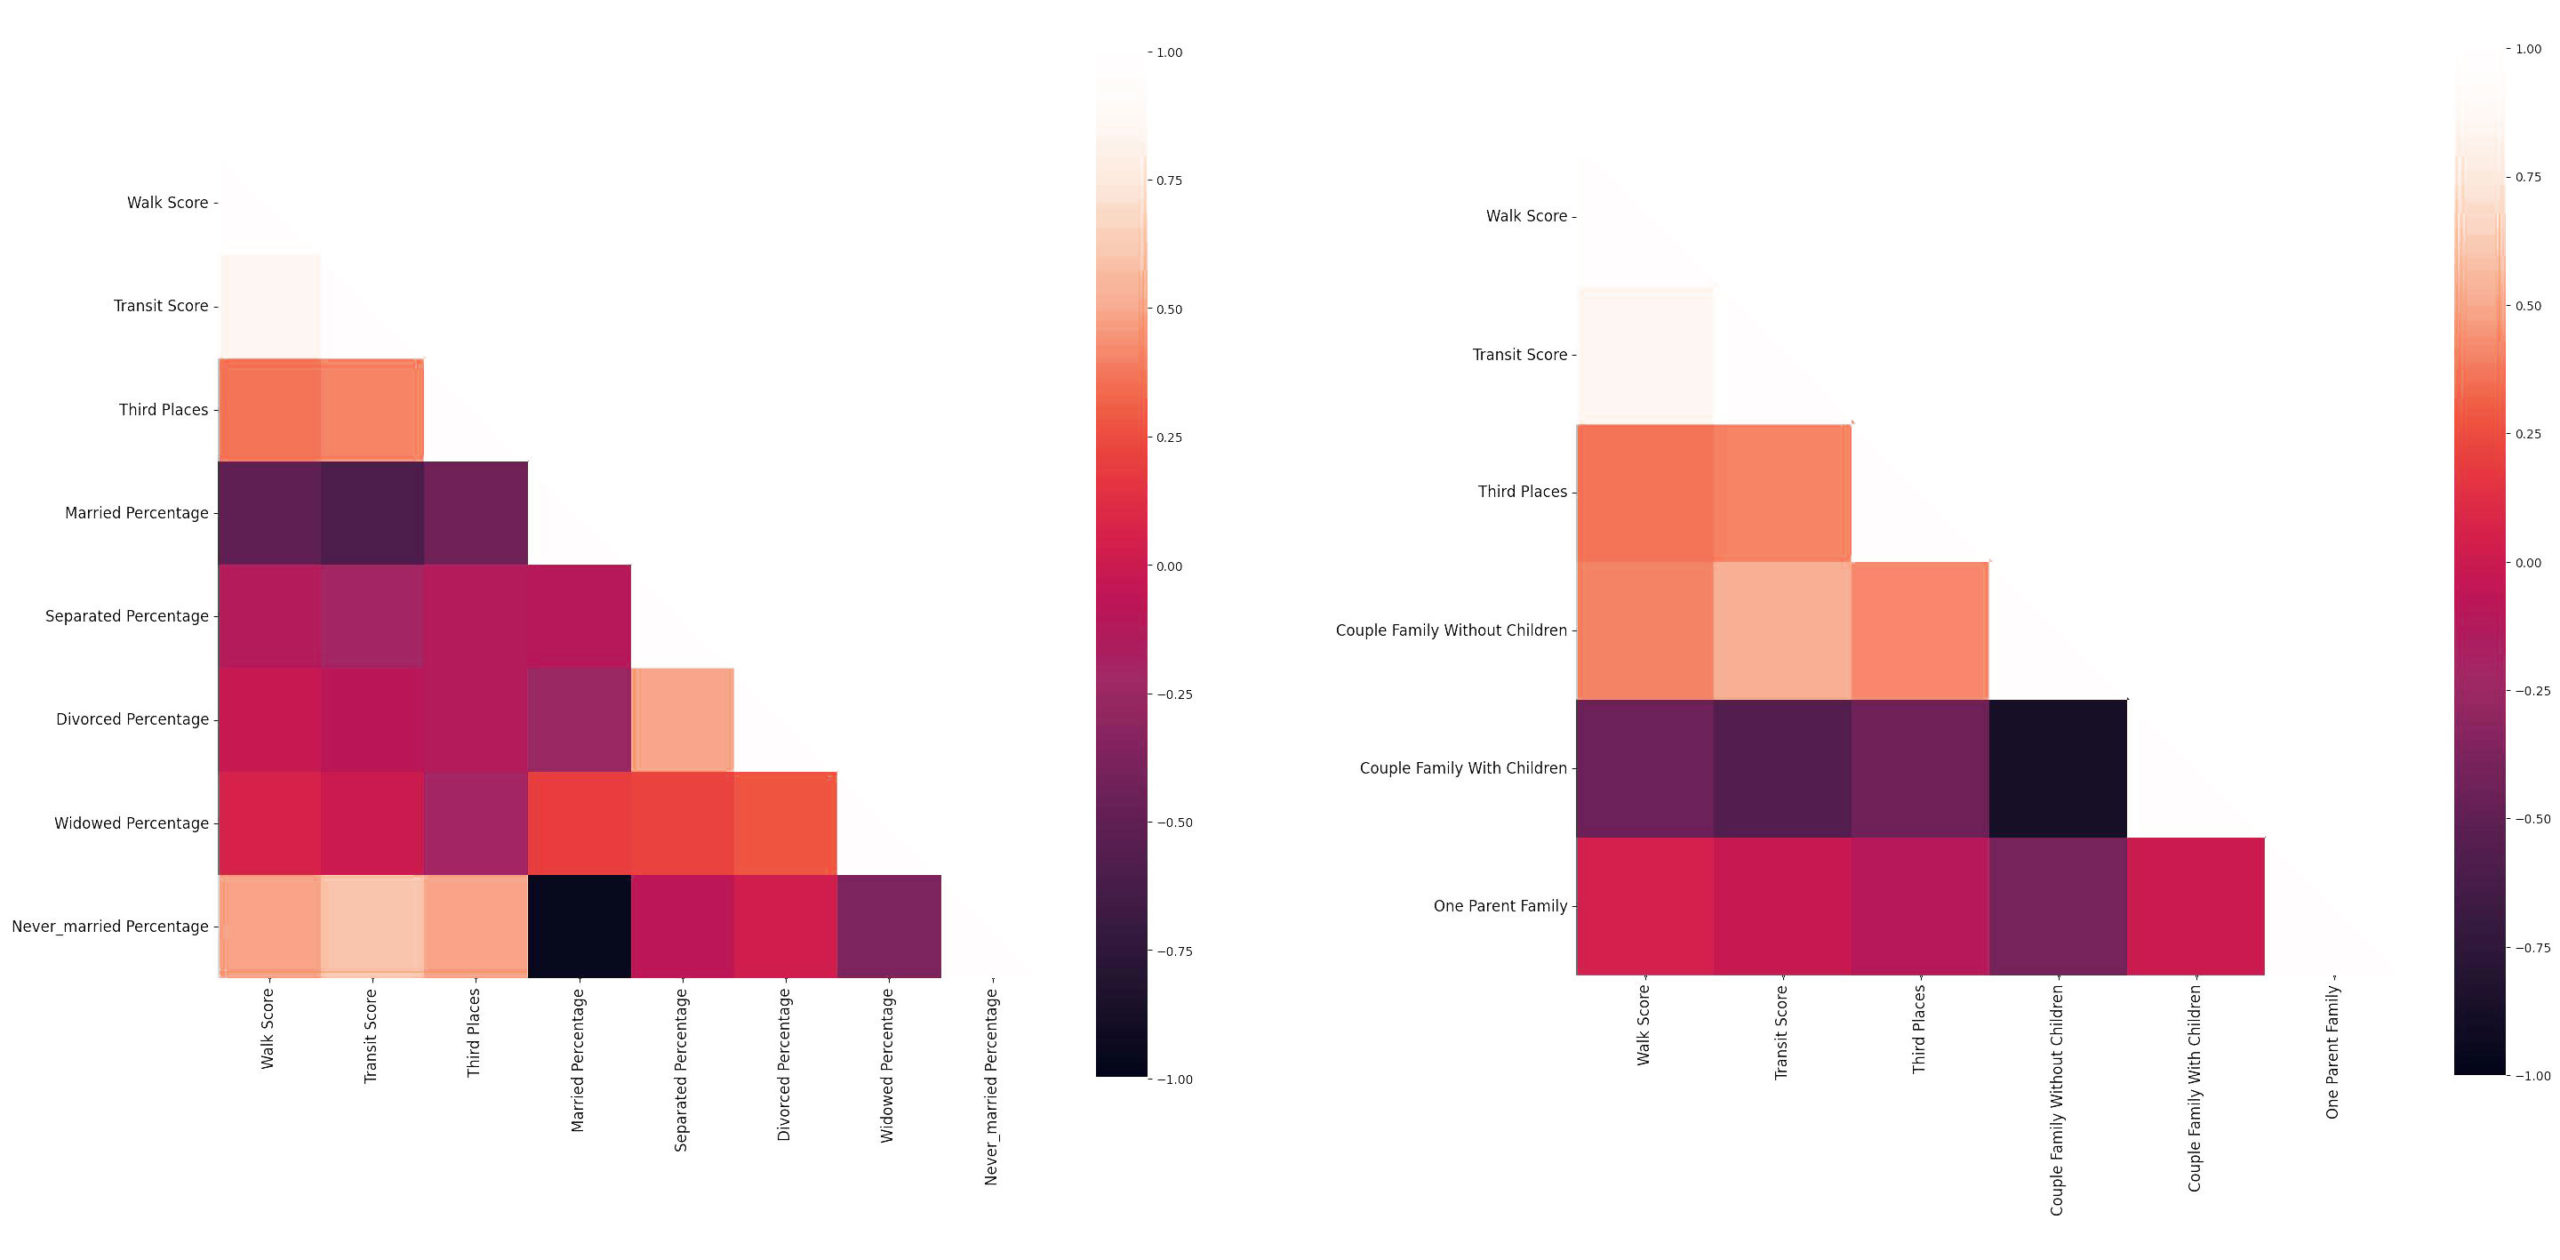
Our first correlation matrix shows that 0-19 years old’s are negatively correlated to the walk score, transit score and third place density whereas those 20 to 35 years have a positive correlation to these urban features and the workforce between the age of 35 to 65 shows a negative correlation.
The next correlation study is with students that shows a negative correlation between school going students and the urban features but a positive correlation for university students.
Married people have a negative correlation to walk score, transit score and third place density whereas never married people show a positive relation.
The feature ‘couple without children’ shows a positive correlation to the third places while the couple with children show a negative correlation.
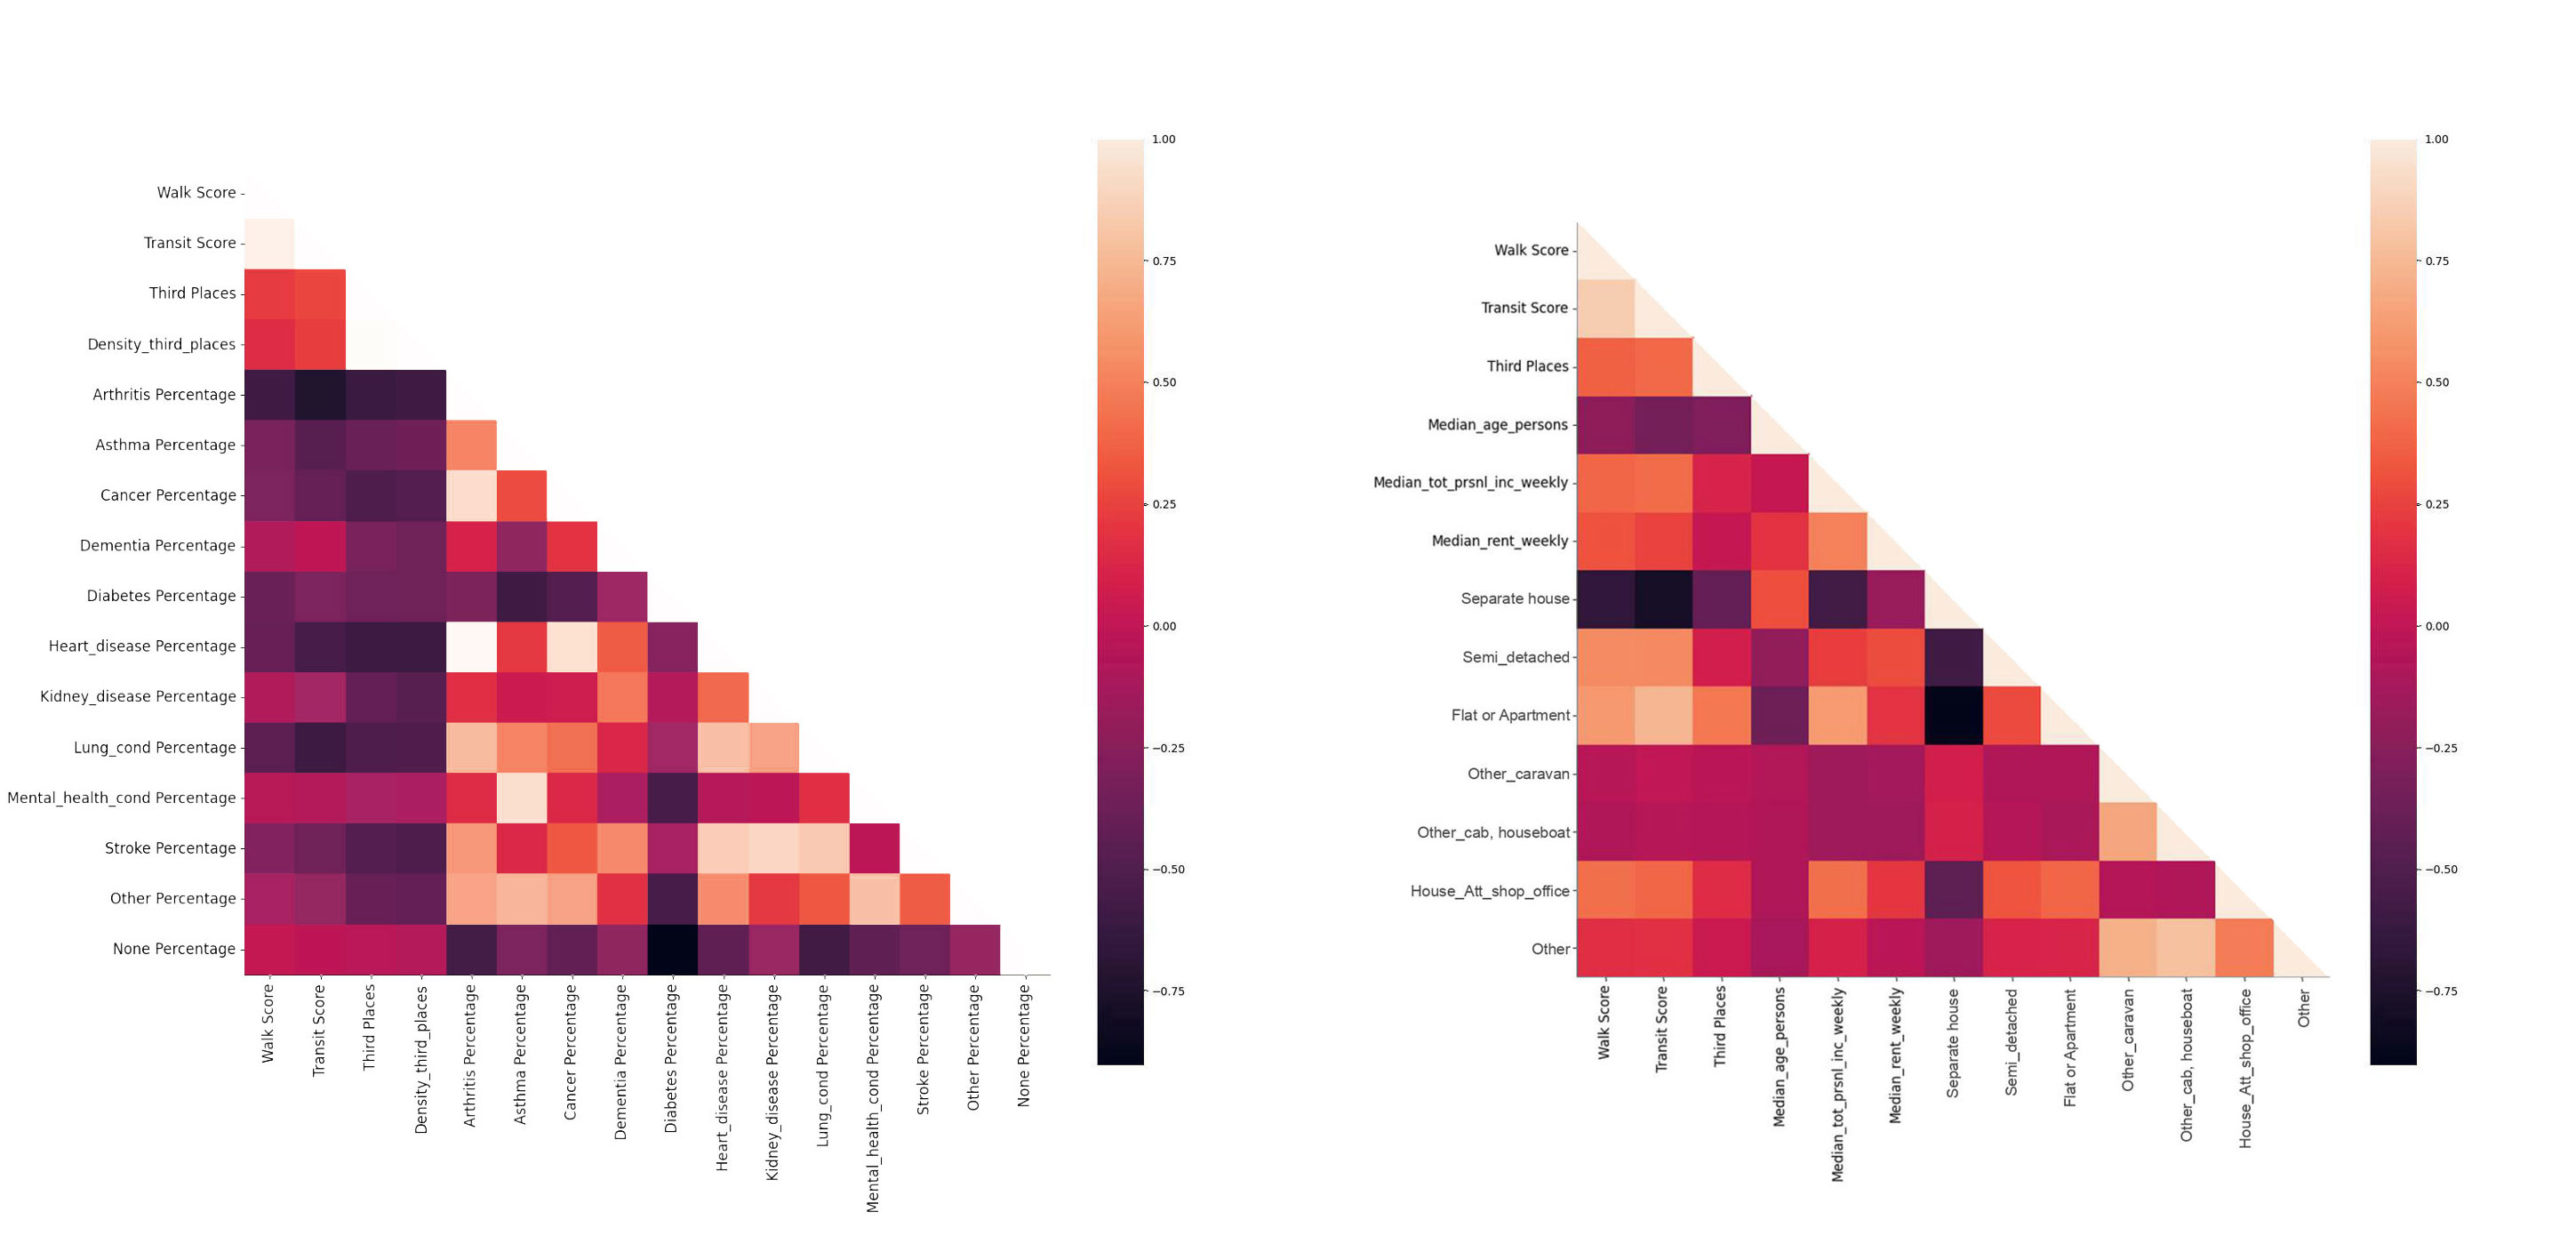
We see no strong correlation with health features. Surprisingly, only arthritis shows a negative correlation to walk score and transit score.
Central postcodes of greater Melbourne have more apartments and less houses while the further suburbs are the opposite. This is represented below by separate houses having a negative correlation and the apartments which are higher in number in the city center have a positive correlation to our urban features.
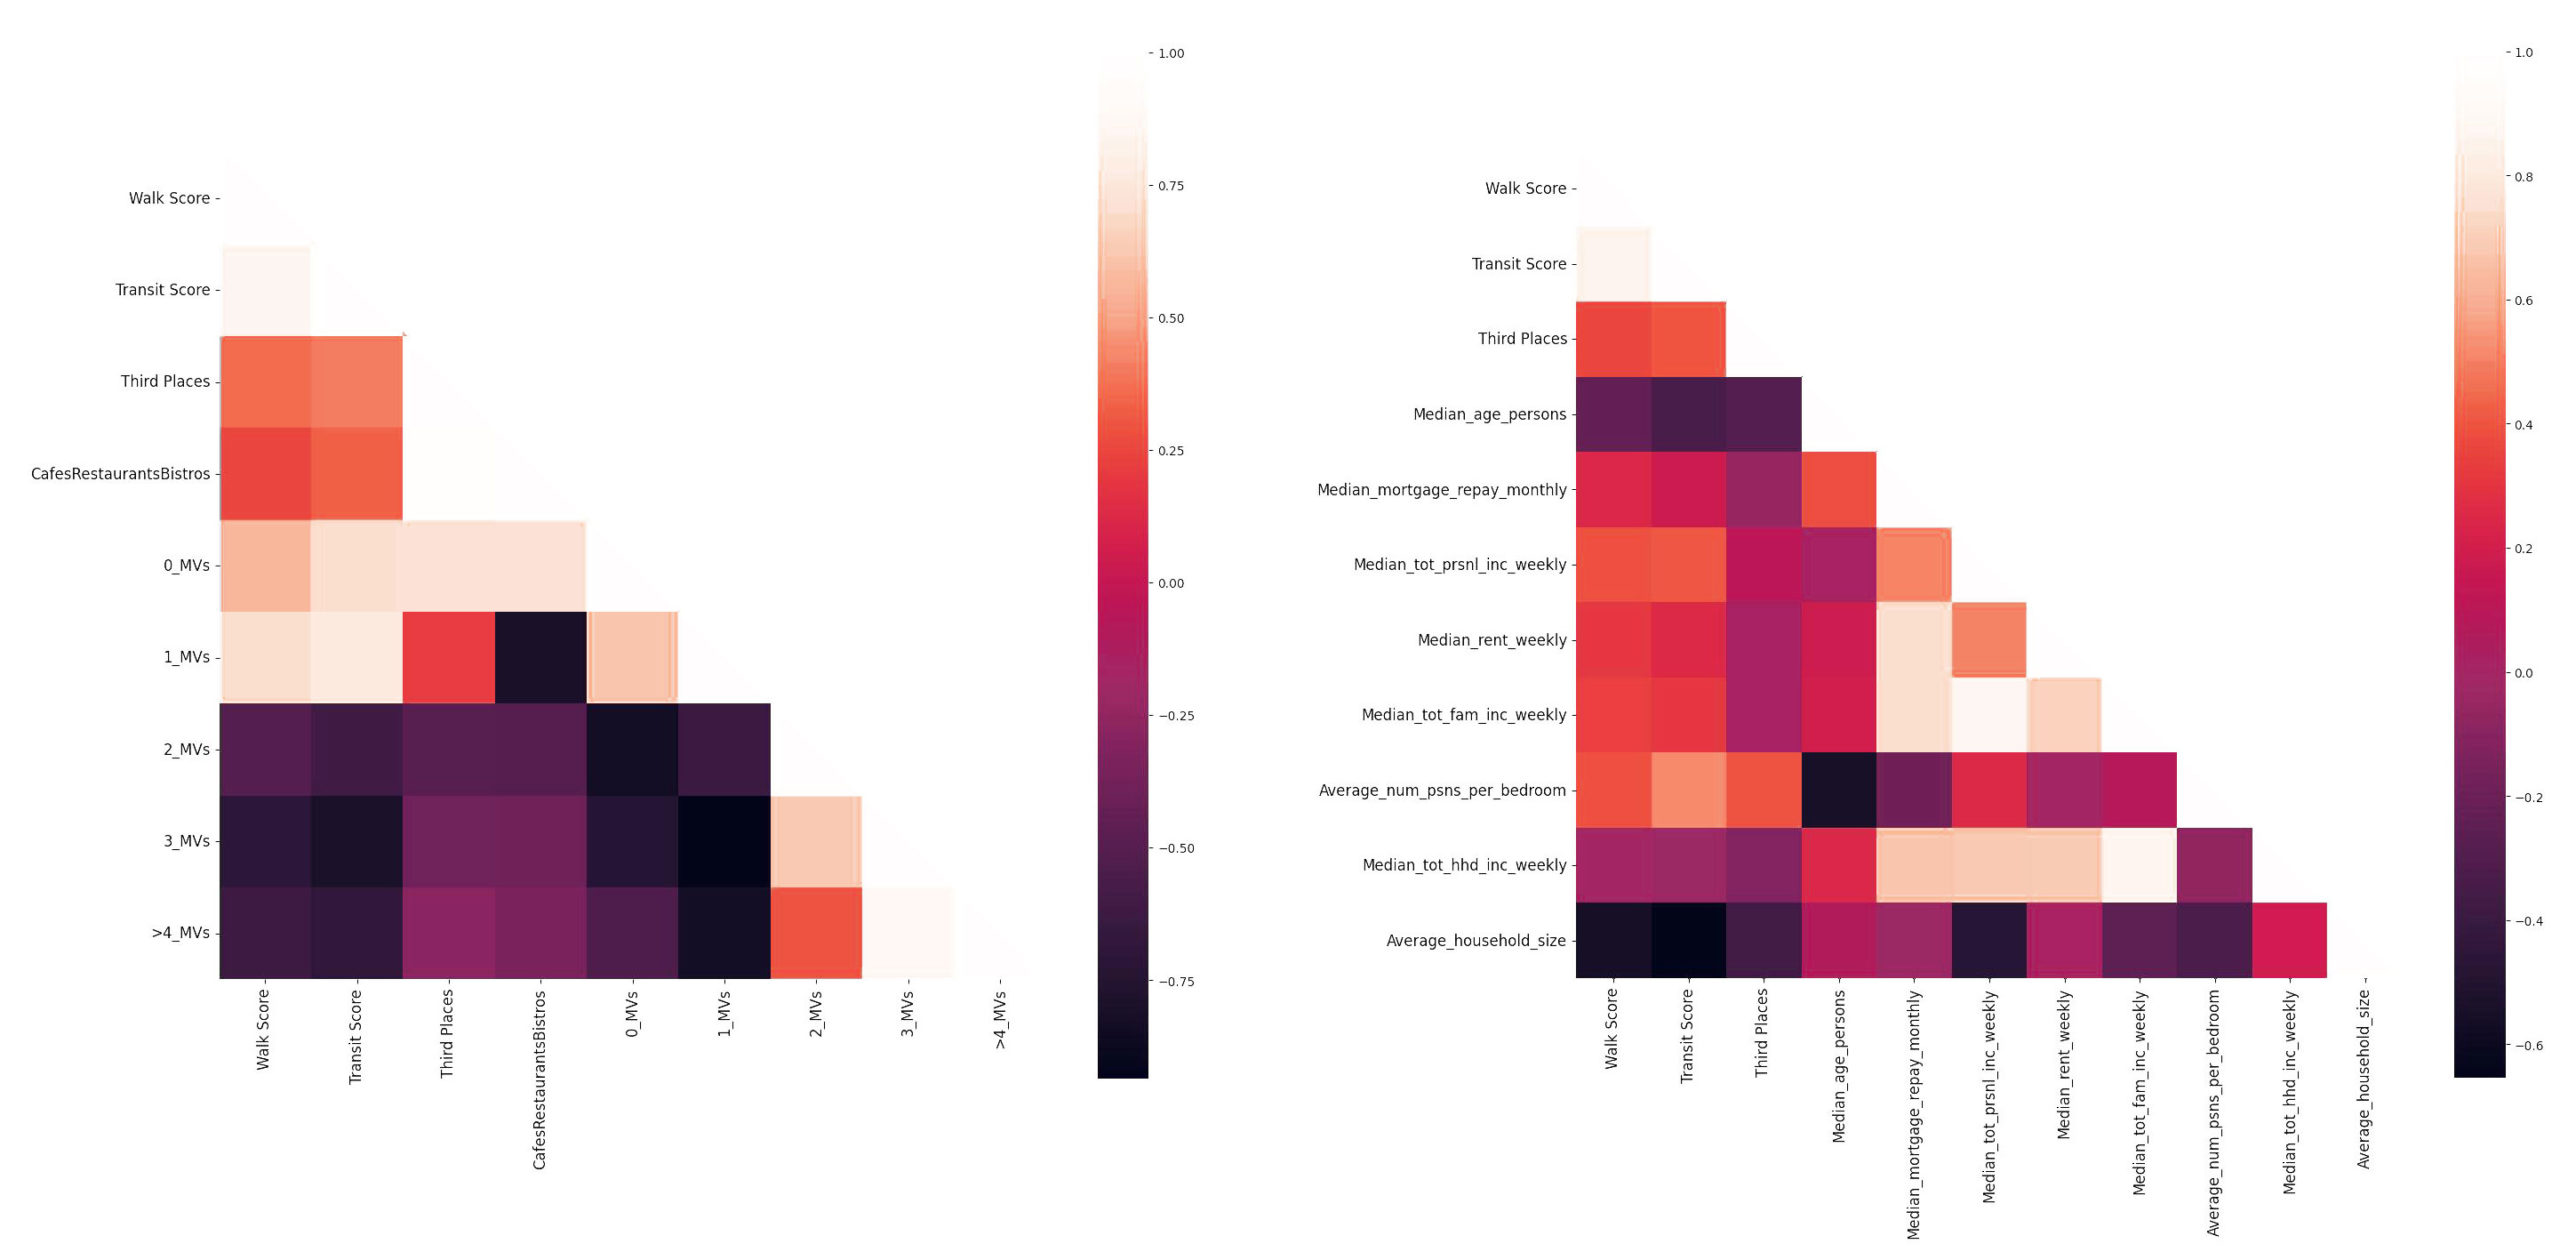
Similarly, more people in central postcodes have either 0 or 1 motor vehicle and this shows a positive correlation with walk score, transit score and third places while postcodes in the suburbs have more than two vehicles shown by a negative correlation to third places.
In our last correlation, median age and household size both show a negative correlation to our urban features.
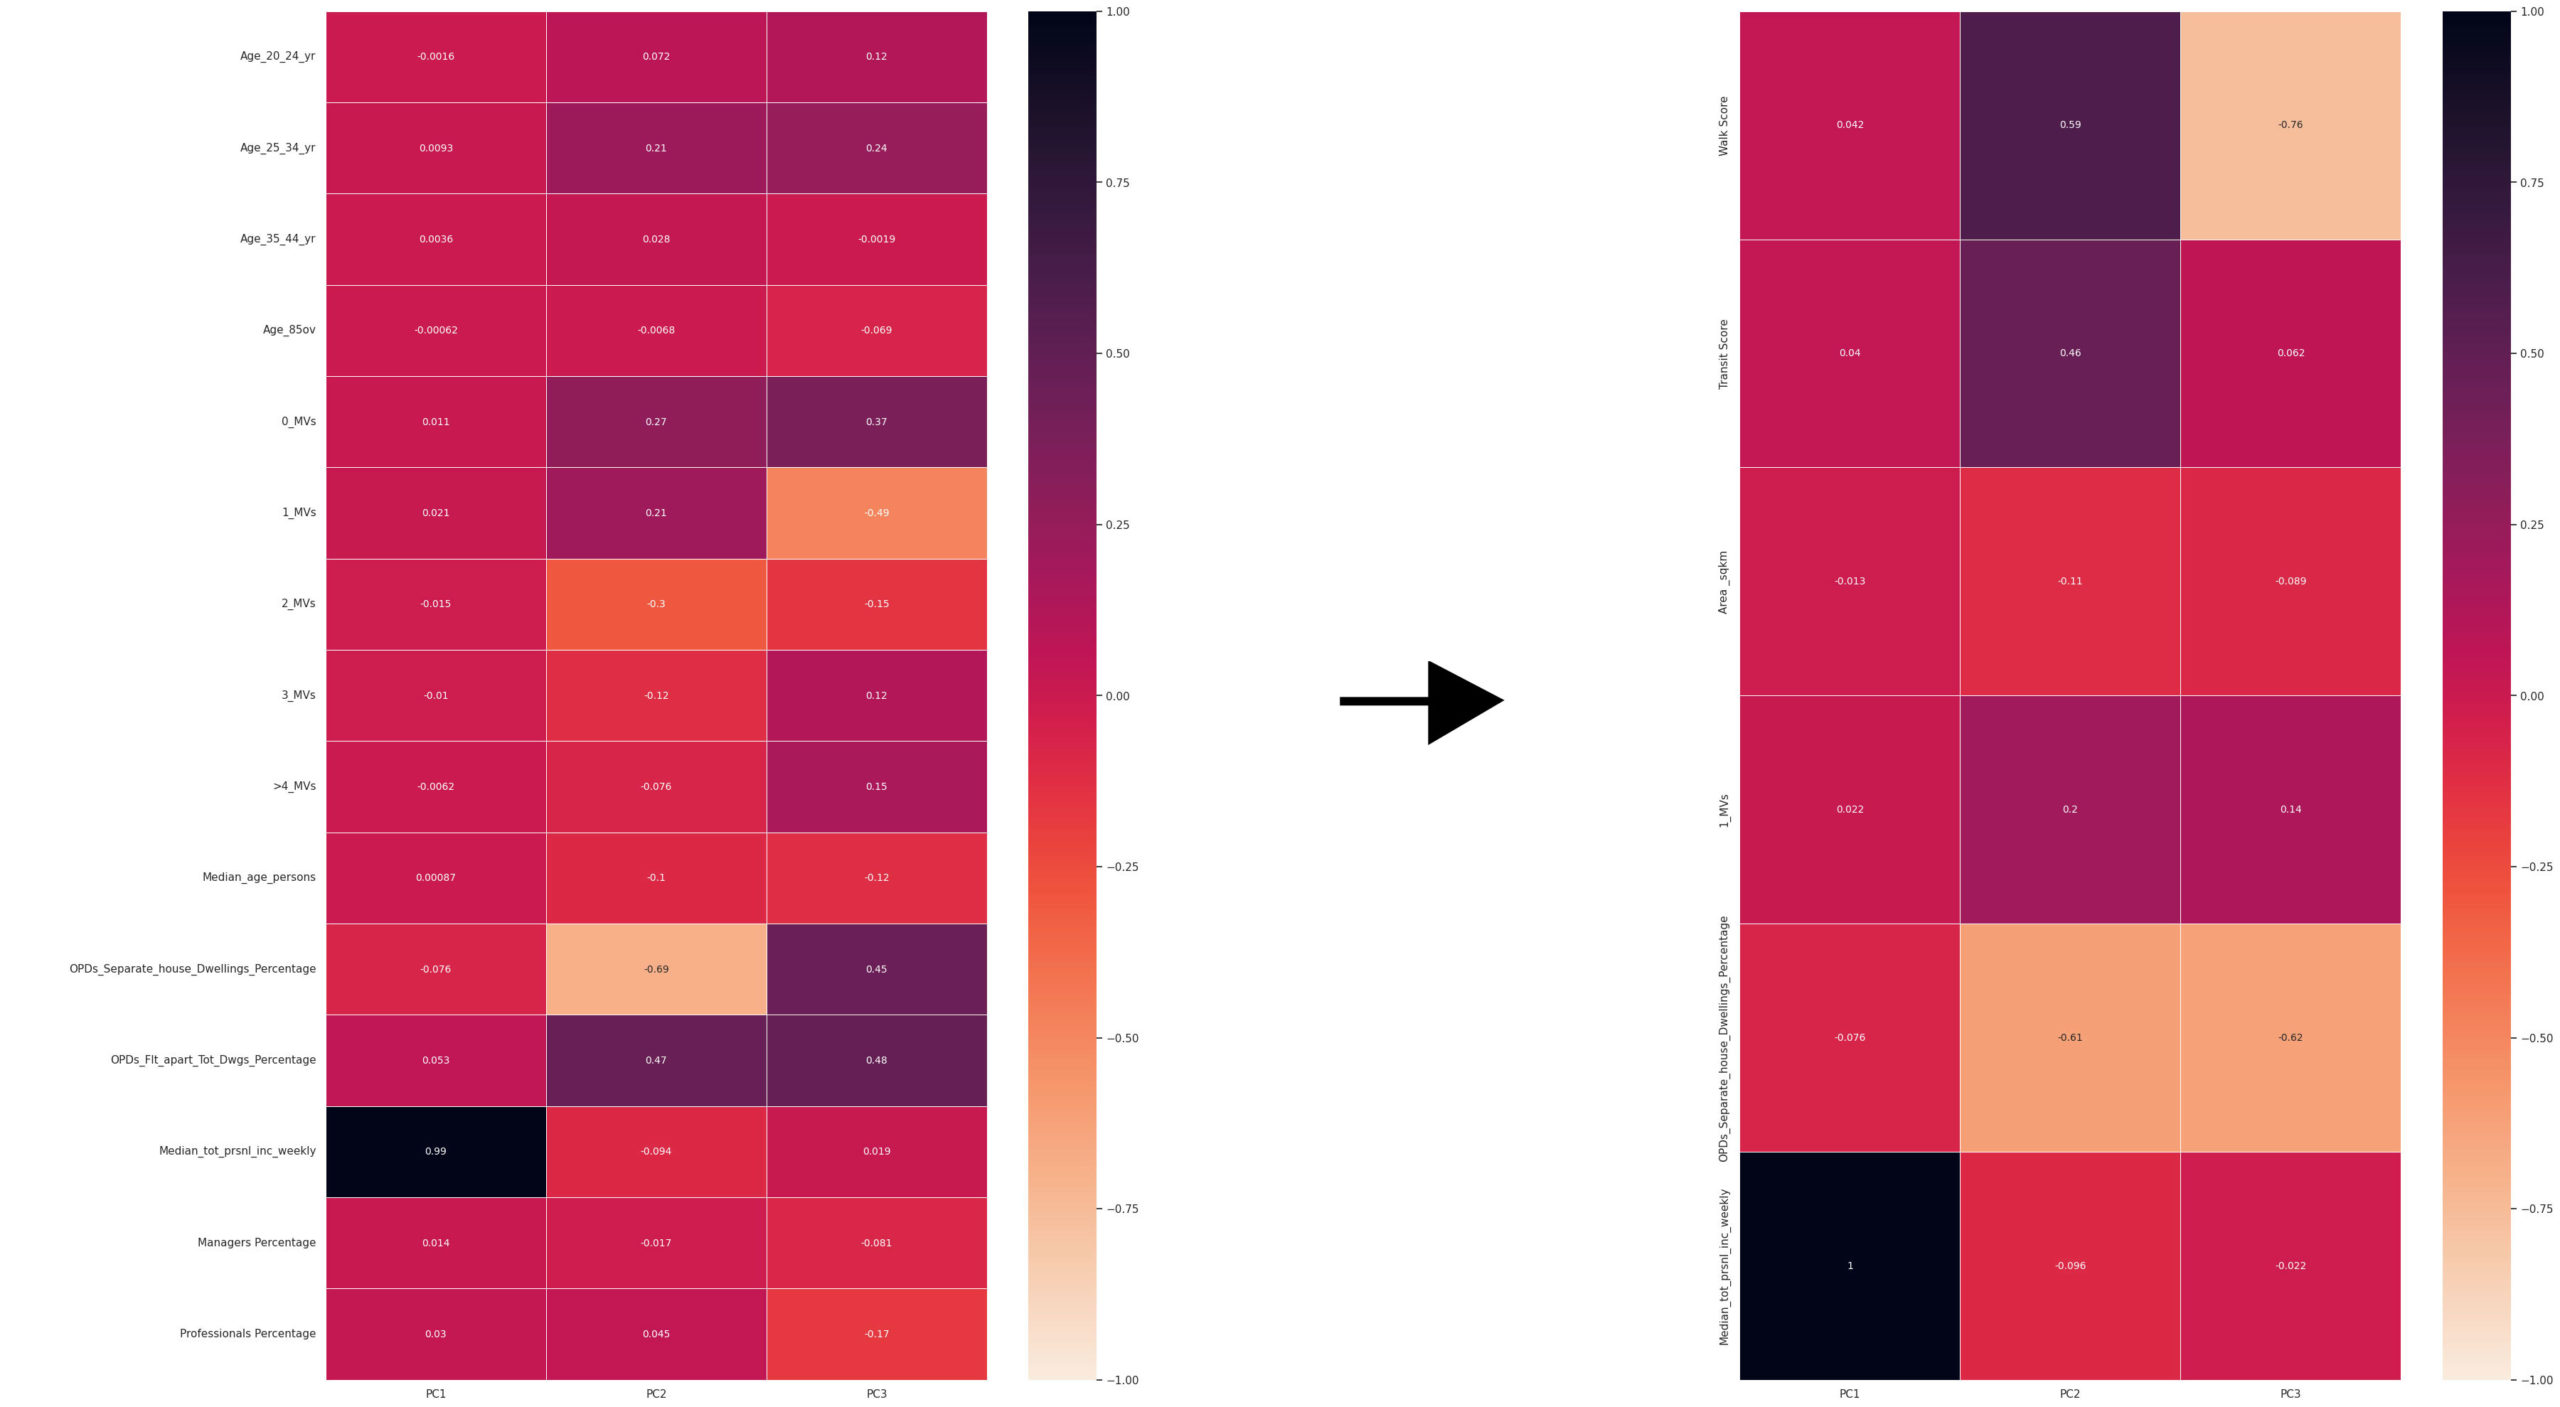
Dimensionality Reduction: PCA
We derived too many features from our analysis compared to the size of our dataset.
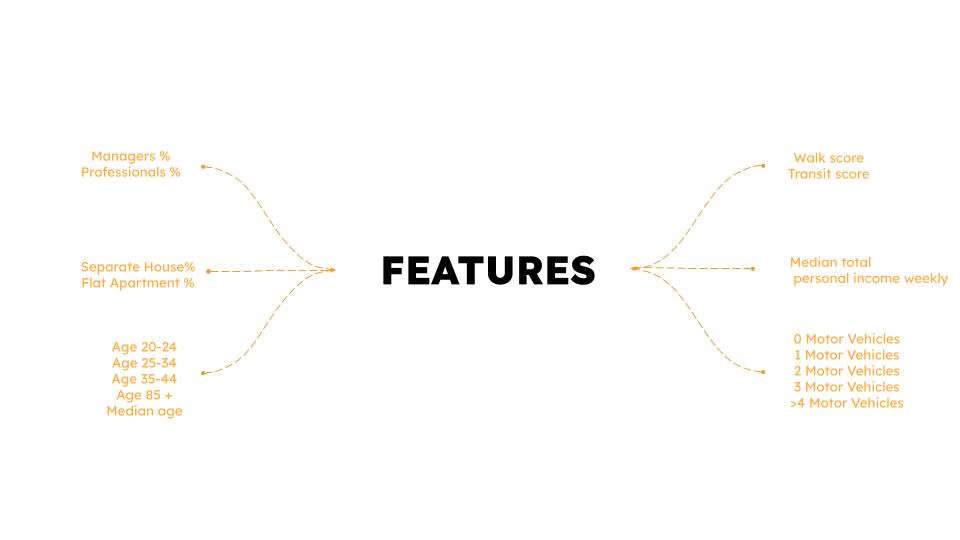
Therefore performed a Principal Component Analysis (PCA) to reduce dimensionality and derive our most contributing features. The number of features was reduced from 15 to 6.
Artificial Neural Network (ANN) Architecture
We trained an Artificial Neural Net (ANN) while exploring and refining its architecture.
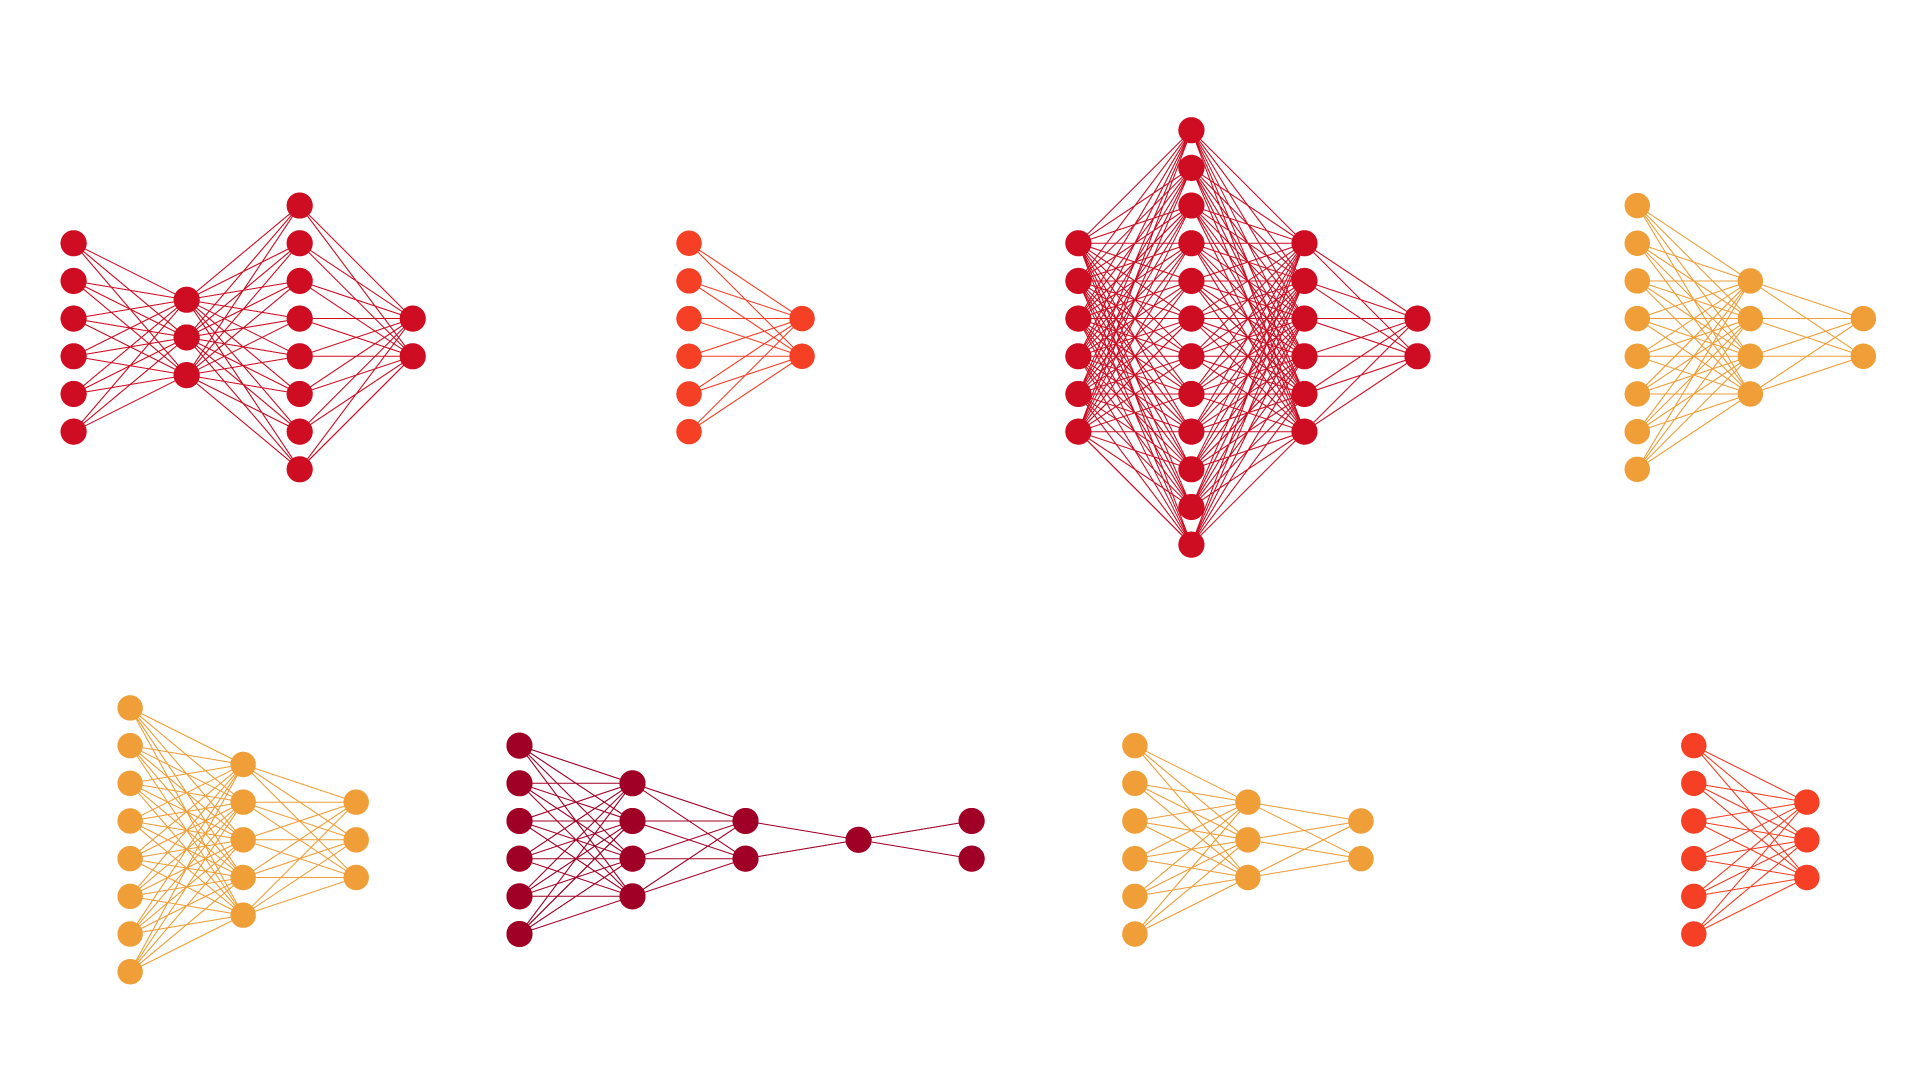
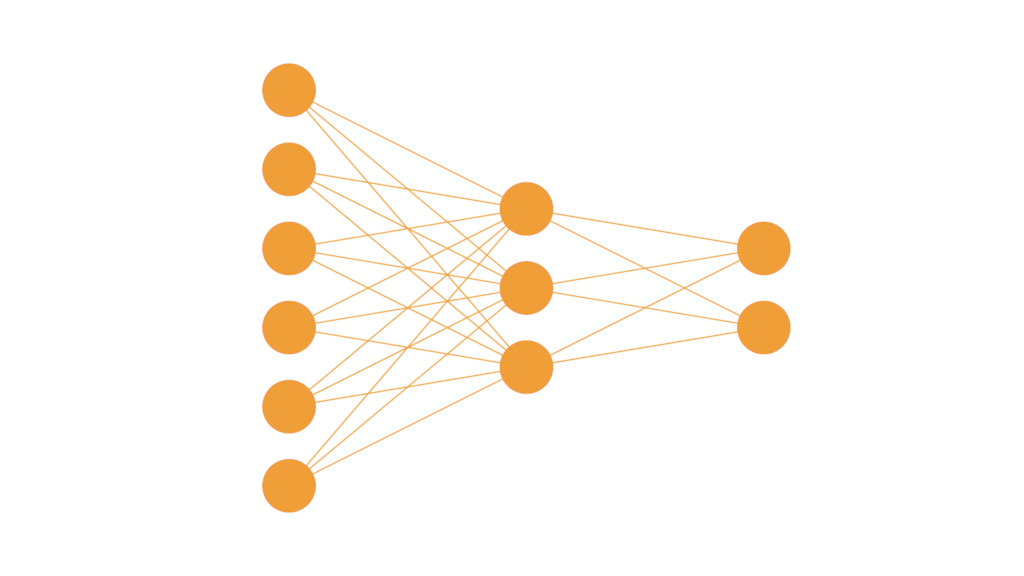
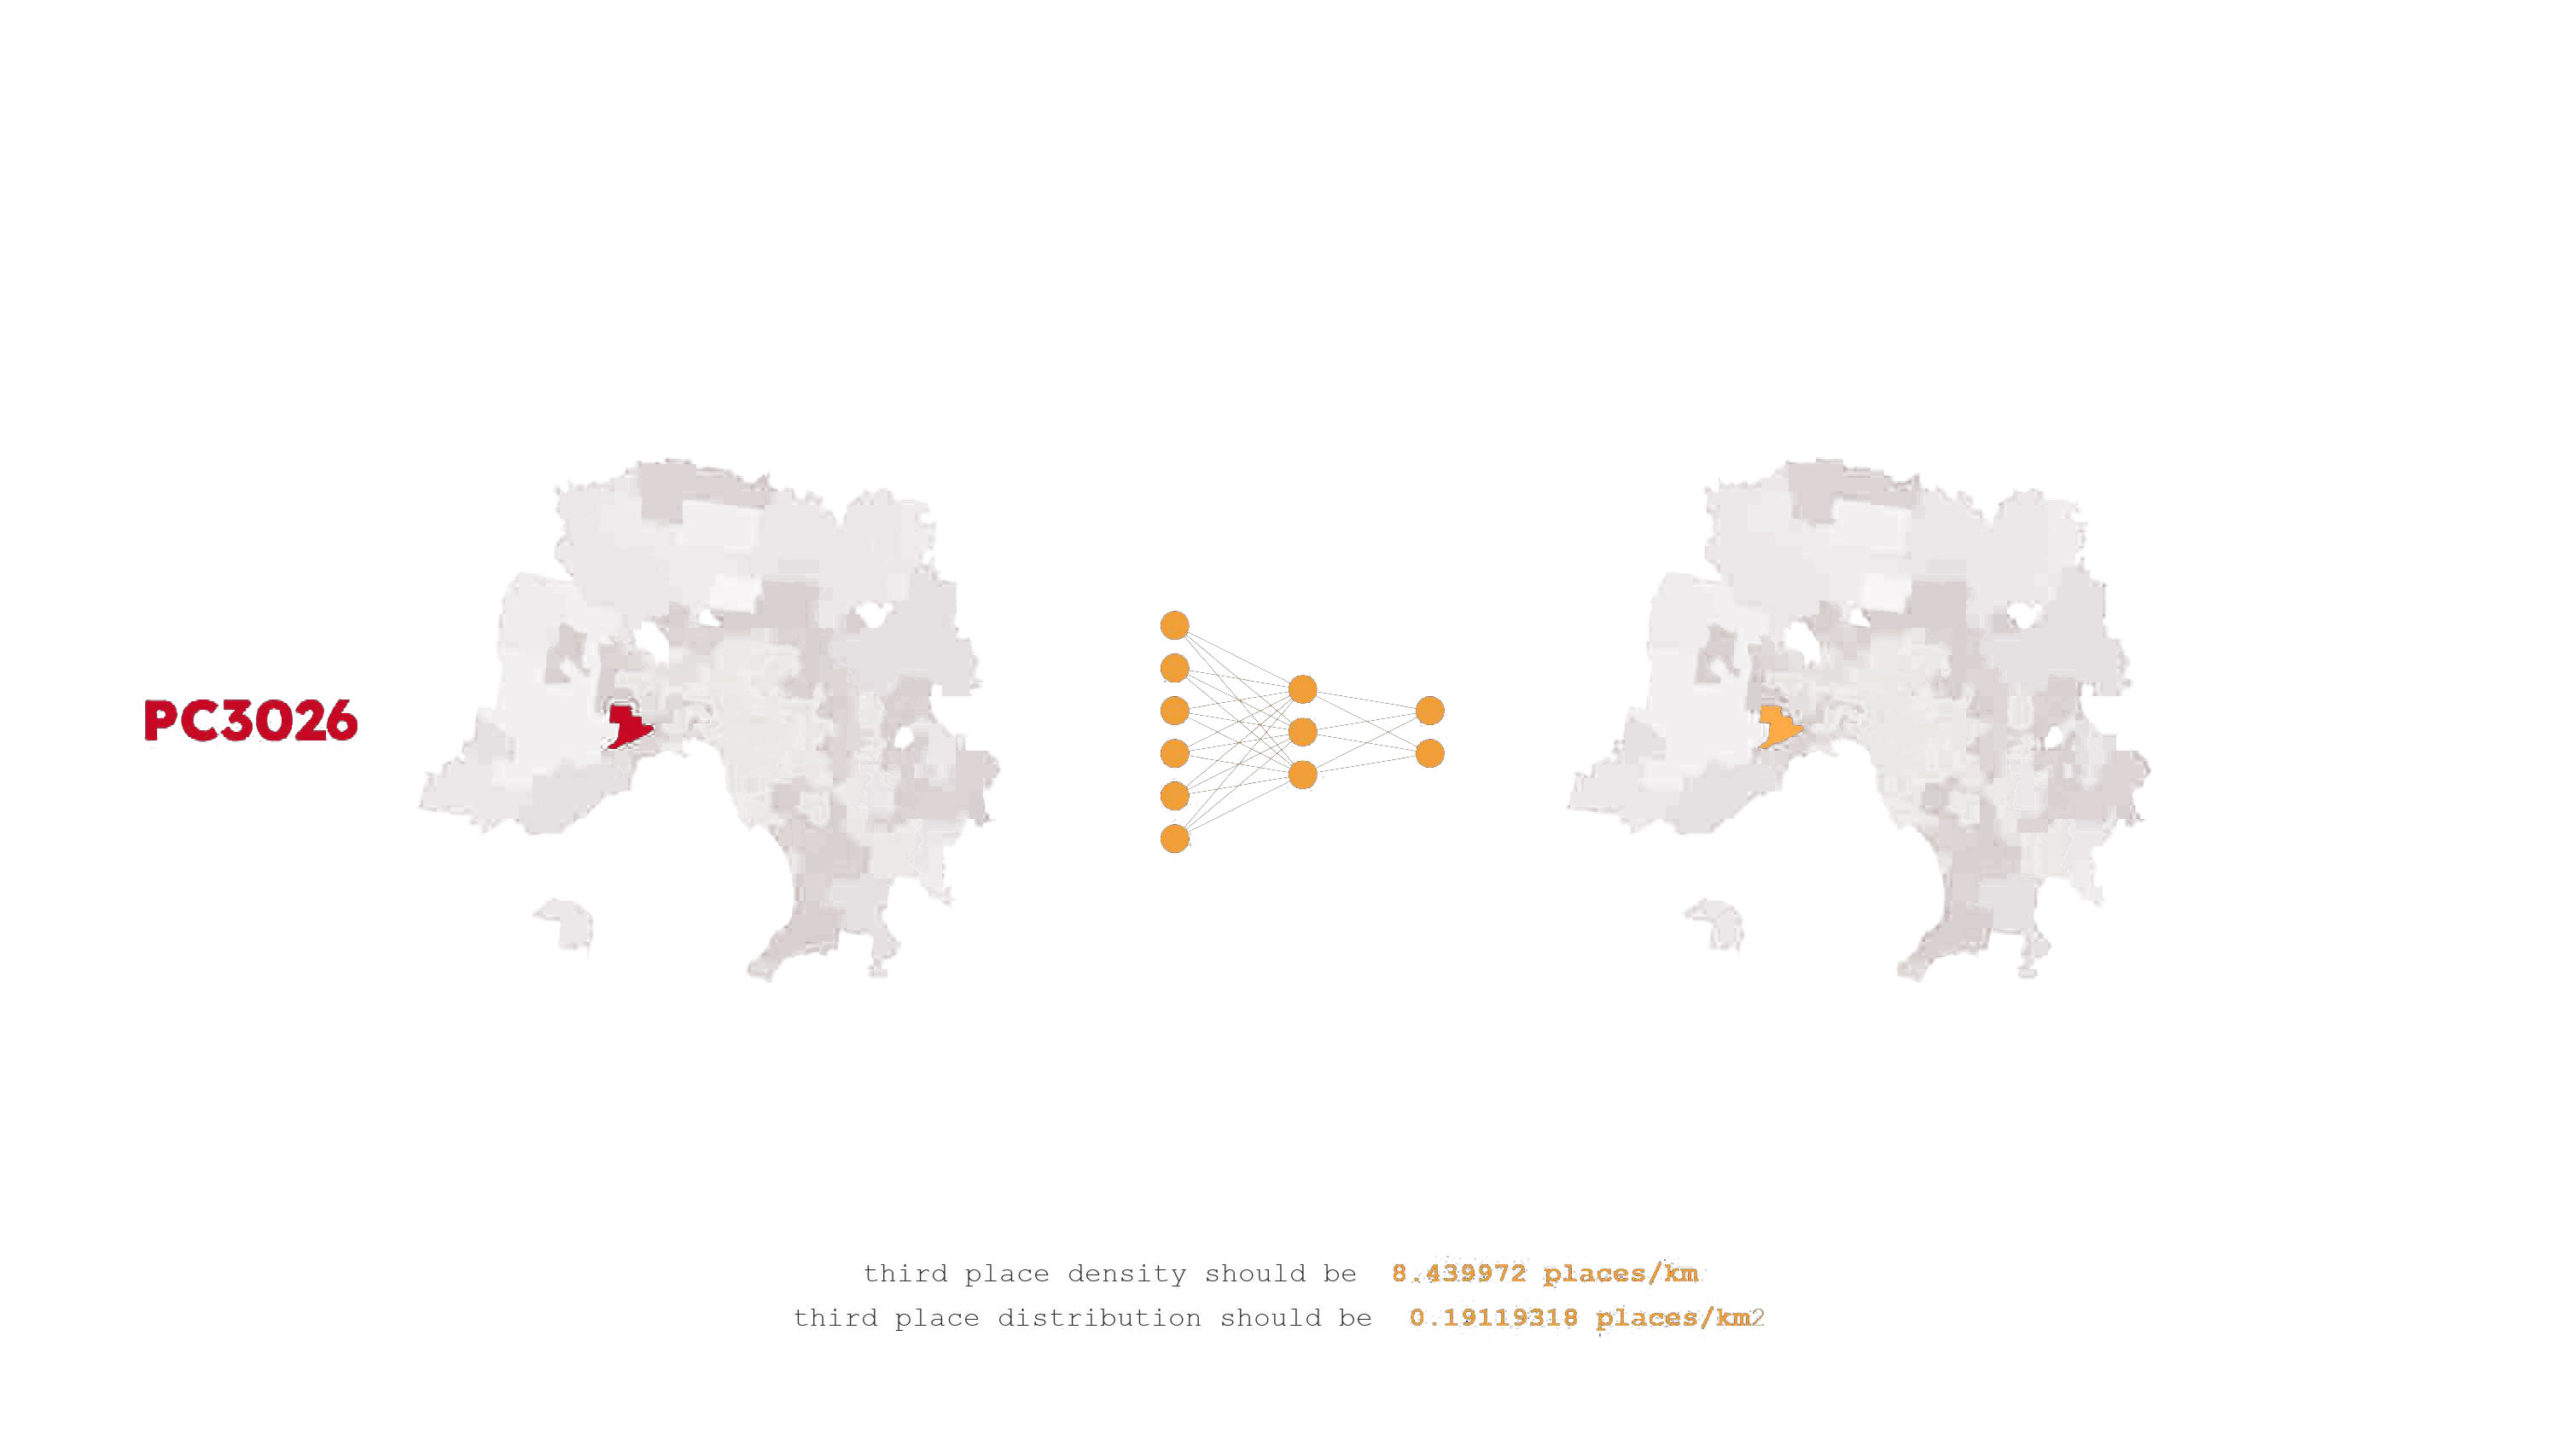
Our preferred model had 6 inputs, one hidden layer of 3 neurons and 2 outputs.
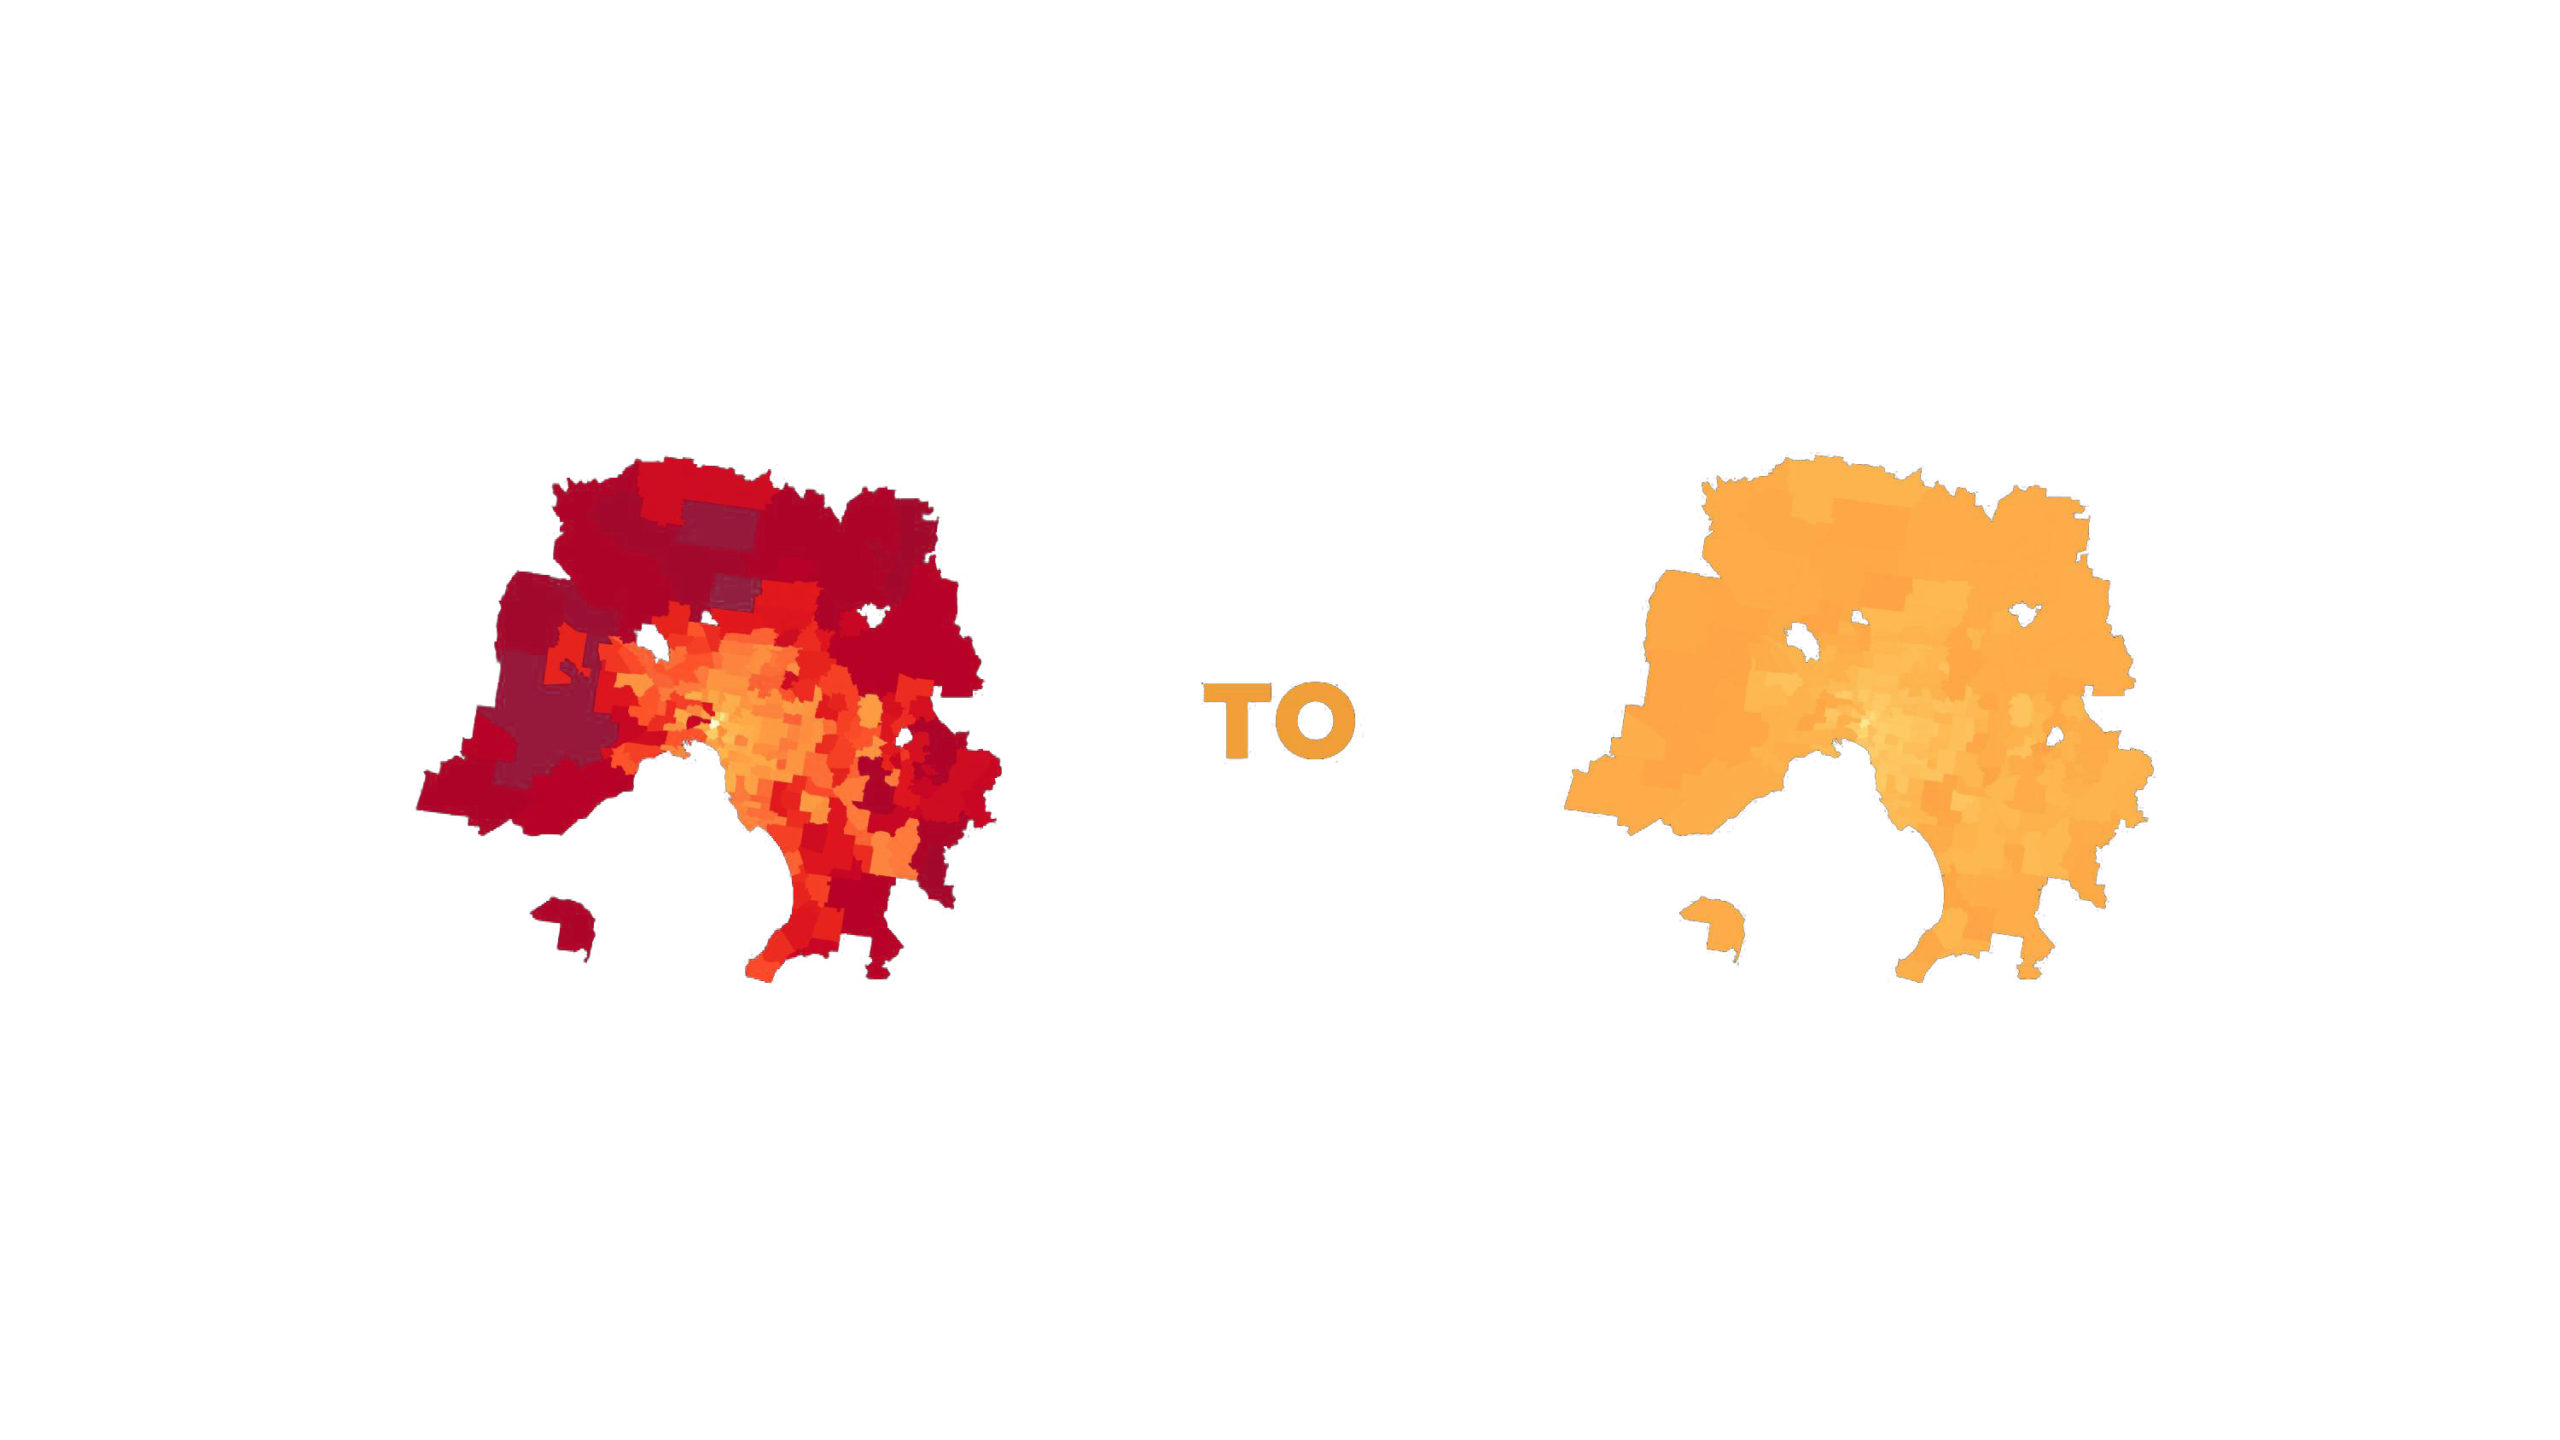
Working Model
and so with that, we believe that we have a tool for city planners to take this map of loneliness of Melbourne from the left and understand the necessary conditions to achieve a map like the one on the right where the loneliness risk due to architecture and urban design is drastically reduced.
Looking at an example of the postcode 3026, our tool can process features and propose an improved density and distribution of third places.
Demo
and finally a demo of our tool created in Figma.
