
Mapping Proximity to Wellbeing Amenities in Urban Areas

“For most of us from now on, life and death will be an urban affair.”
— World Health Organization
As cities become the primary environments in which people age, longevity can no longer be understood as a rural or lifestyle-driven phenomenon alone. Inspired by — but critical of — the Blue Zones narrative, this project asks how longevity can be spatially examined within urban contexts. Longevity Landscapes maps where people aged 80 and above live in cities and analyzes their proximity to amenities commonly associated with well-being, such as public transport, green spaces, water bodies, and healthcare. Rather than measuring outcomes or making causal claims, the project visualizes spatial opportunity: how supportive urban conditions align — or fail to align — with ageing populations. By comparing 50 cities worldwide, we redefine “blueness” as a spatial condition, revealing how urban form, infrastructure, and environment shape the everyday landscapes of longevity.
Why Longevity is Now an Urban Question
The world is rapidly urbanising while simultaneously ageing. Reports, news coverage, and health organisations repeatedly highlight rising life expectancy and vulnerability among elderly populations. Cities hold extraordinary potential to support wellbeing through infrastructure, mobility, access to care, and environmental quality. Yet they can also produce exclusion, isolation, and uneven access to essential services.
If most of humanity will age within cities, then longevity becomes a planning question, a public health question, and a spatial justice question. Understanding where older populations live, and how supportive their environments actually are, becomes critical in shaping future urban policies.

Longevity Narratives: Where They Come From
Longevity is often framed through various narratives—most famously the Blue Zones, celebrated as places where people live exceptionally long lives. While these stories shape how we imagine ageing, they largely emerge from geographically isolated contexts that do not reflect the complexities of urban life.
Alongside these cultural narratives, institutions such as WHO, OECD, HUDI and Urban Quality of Life frameworks attempt to define wellbeing more systematically, emphasizing health access, environment quality, mobility, social equity and infrastructure. Bringing these lenses together allows us to shift longevity from a romantic ideal to something spatial, measurable and urban. This project therefore translates these narratives and indicators into tangible proximity-based conditions to understand how cities actually support long life.
Goldies: a term we use to describe population of 80 years and above.
Our Core Question: How are elderly populations spatially distributed in relation to key urban amenities? How does the idea of “blueness” change when longevity is examined through proximity rather than presence alone?
Global Patterns of Ageing: From Density to Distribution
In absolute terms, the pattern reflects large and dense cities hosting the greatest number of older residents. This is scale-driven aging; cities appear “old” simply because they are large. To move beyond this dynamic, relative measures are introduced – cities are evaluated by their ratio of old population to total population. Top 50 cities are selected by the concentration of elderly populations within their urban cores. This approach establishes a demographic foundation.
Goldies and the Urban Core
By plotting the 80+ population against GHSL urban core metrics, the scatter analysis examines whether ageing concentrates within dense urban centres or disperses beyond them. This distinction helps frame longevity as a spatial condition shaped by urban form, not only demographic accumulation.
Methodology
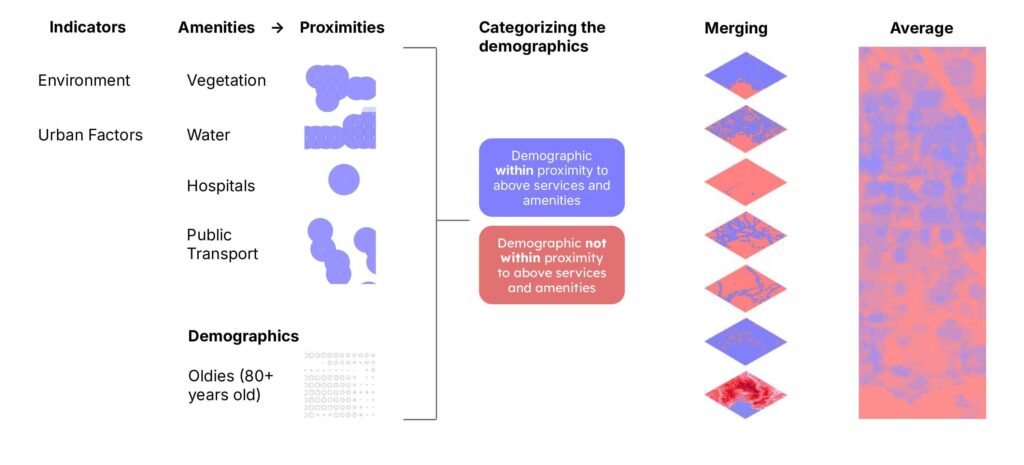
Based on a review of existing research, key determinants most often associated with well-being in later life were identified and translated into spatial indicators. These indicators focus on four amenities repeatedly linked to supportive ageing: vegetation, water, hospitals, and public transport.
Rather than measuring health outcomes directly, the analysis examines where elderly residents live in relation to these amenities. For each city, populations aged 80+ are mapped, and distance buffers are created to represent reasonable proximity for older adults. Each layer categorizes residents as either:
- within proximity to an amenity, or
- not within proximity.
The layers are then merged to reveal how often elderly residents are simultaneously near multiple amenities. Finally, an overall average is calculated, highlighting areas where ageing populations tend to live close to several supportive resources — as well as areas where accessibility gaps emerge.
Our goal is not to prove causation, but to visualize how urban form and longevity coexist spatially.
Proximities
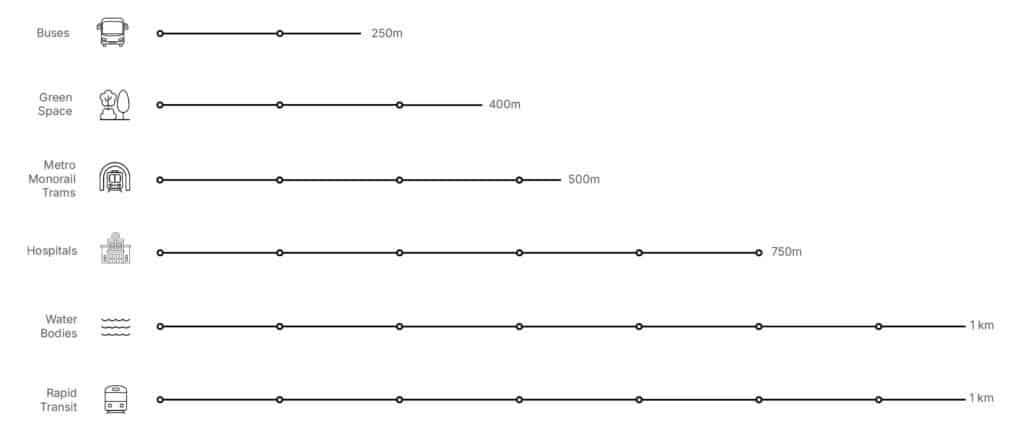
Rather than measuring accessibility in terms of physical ability, we chose the term proximity. The goal was to situate aging populations in spatial contexts and to better understand what resources are near them.
The distribution of people aged 80+ in each city was mapped and compared with proximity to amenities associated with wellbeing and longevity.
Each amenity layer was analyzed separately, then merged with demographic data to identify how many elderly residents live within proximity. An overall proximity score was then calculated for each city.hen calculated for each city.
Prototype – TOKYO

This method was first applied to Tokyo, a city with one of the largest absolute populations of people aged 80+. When the amenity layers were combined, Tokyo appeared as a notably “blue” city: a high share of elderly residents live close to green spaces, transit, water, and hospitals.
Proximity to water is often associated with improved wellbeing, although many coastal cities show low coverage because large portions of waterfront land are non-residential. In Tokyo, roughly half of the elderly population falls within the defined proximity to green space. Public transport access is also closely linked to physical activity, social connection, and access to essential services.
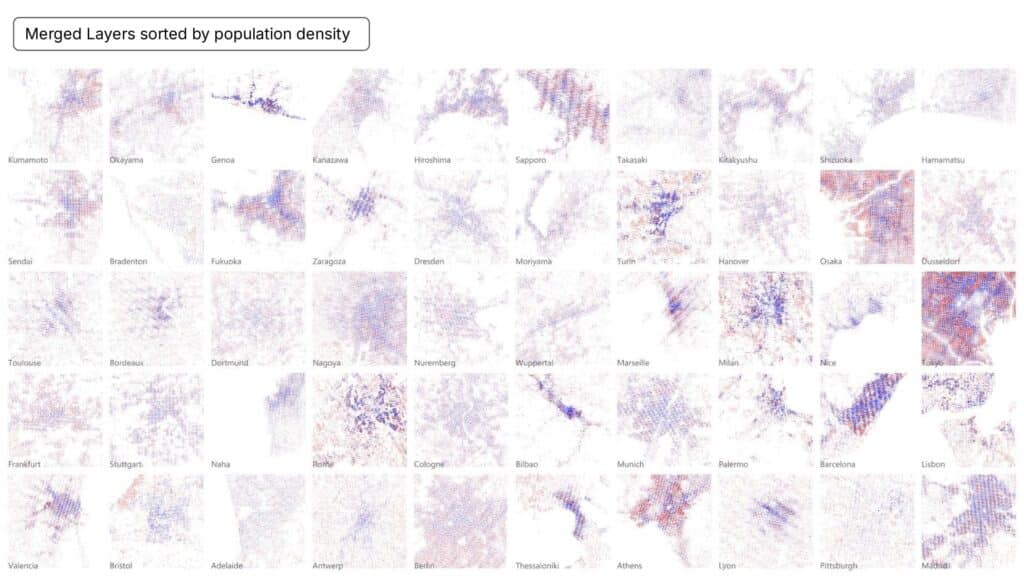
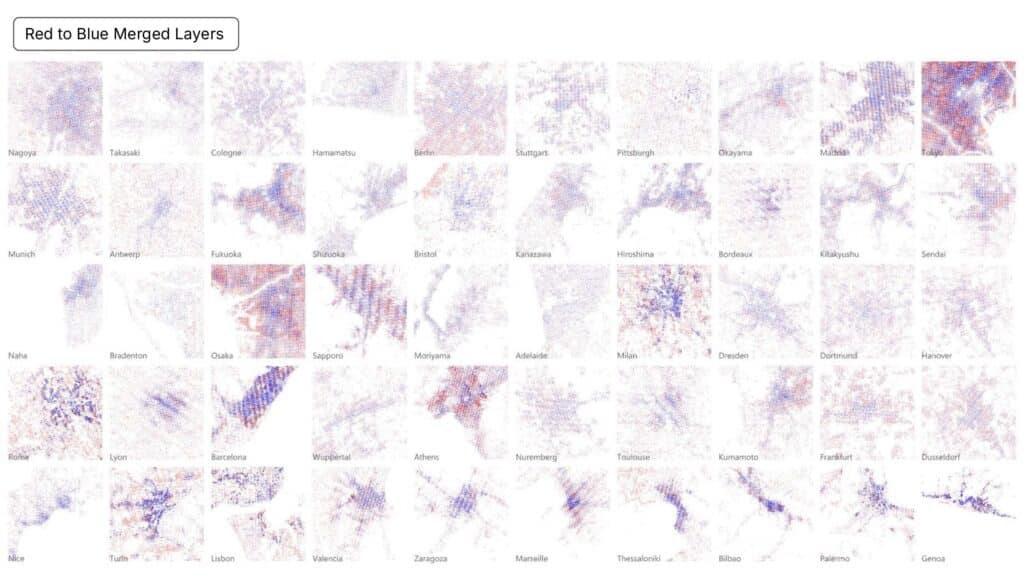
When the analysis was expanded to all 50 cities, a more complex picture appeared. Cities that initially ranked high based on elderly population density often fell in rank once proximity to amenities was considered. The resulting maps suggest that a high concentration of older residents does not automatically indicate that the urban environment supports ageing.
In this approach, blue no longer represents the presence of 80+ residents alone. Instead, it signals the co-existence of ageing populations and nearby supportive amenities. As areas shift toward red, elderly residents are still present — but proximity to key resources becomes increasingly limited.
The maps describe present-day relationships between ageing populations and urban amenities. Highlighting these proximity gaps helps frame questions about how cities currently support — or fail to support — ageing populations in cities.
Blueness is no longer a remote or romanticized idea tied to regions. It marks the spatial relationship between aging and the everyday systems that support interdependent life in cities. Designing cities for longevity is not about planning only for a niche demographic. Designing cities for longevity requires asking the question: how blue can cities be?
