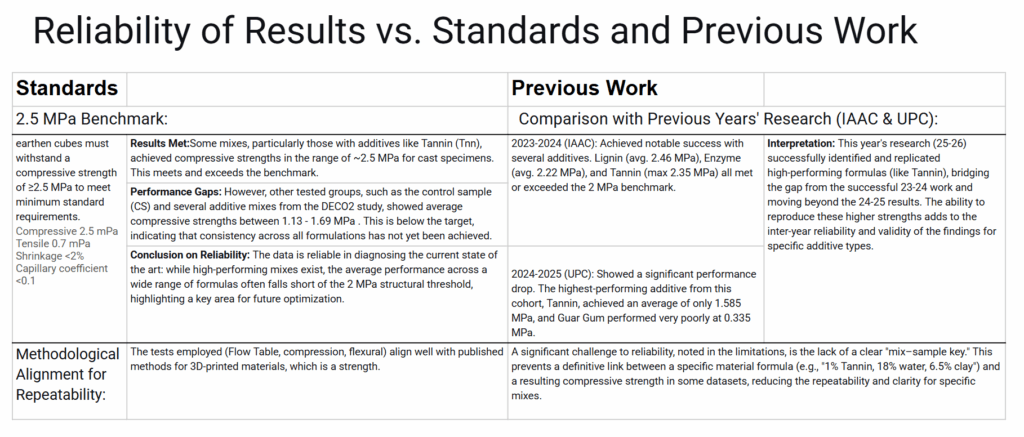
There are several established building standards for earthen construction and for concrete 3D printed construction (3DPC). However, earthen 3D printing lacks global standards that define how materials should be tested, certified, or approved for construction. As a result, each project is evaluated independently, often referencing foreign or unrelated standards — this slows innovation and increases uncertainty. The absence of unified testing protocols prevents the creation of consistent design criteria and safety validation for earthen structures. In this research, we combine tests and minimum performance benchmark values from both earthen construction and 3DPC construction standards. Most process-related tests are taken from the 3DPC standards, while the material-related, such as minimum performance values, are derived mostly from earthen construction standards.
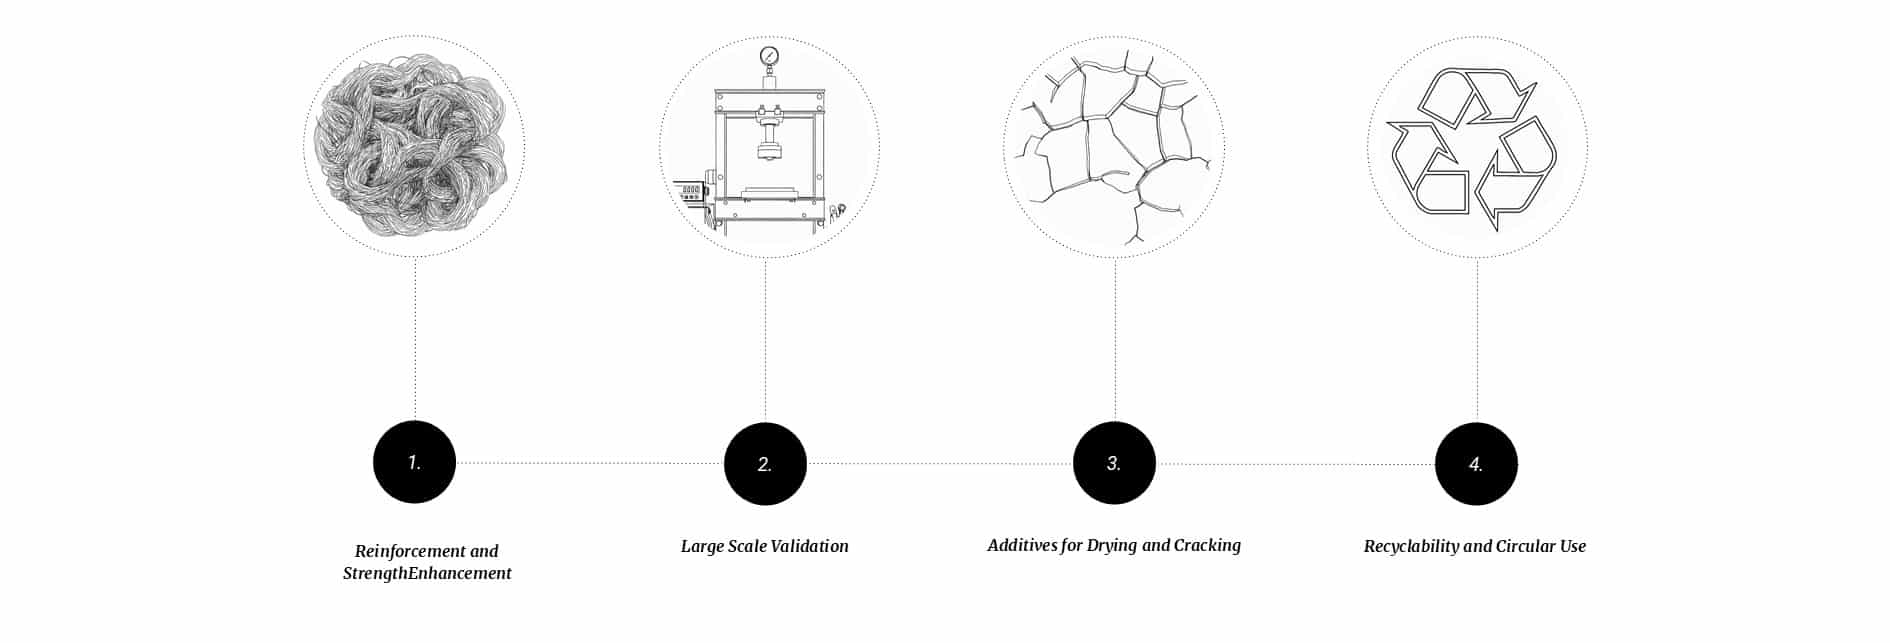
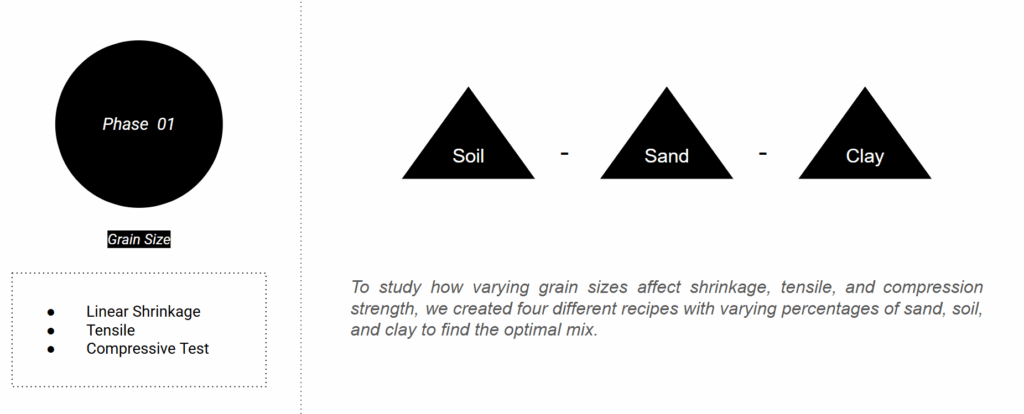
In this seven-week course, we performed a series of tests with two main aims, both related to increasing the strength and durability of the material in the dry state:
- Test which material performance benchmarks tests and threshold values to use in a proposal for a 3DPE standard.
- Determine the best additives and coatings for the construction of this year’s 3DPA 1:1 building at the Forest campus, reaching the minimum performance values.
Minimum performance benchmarks:
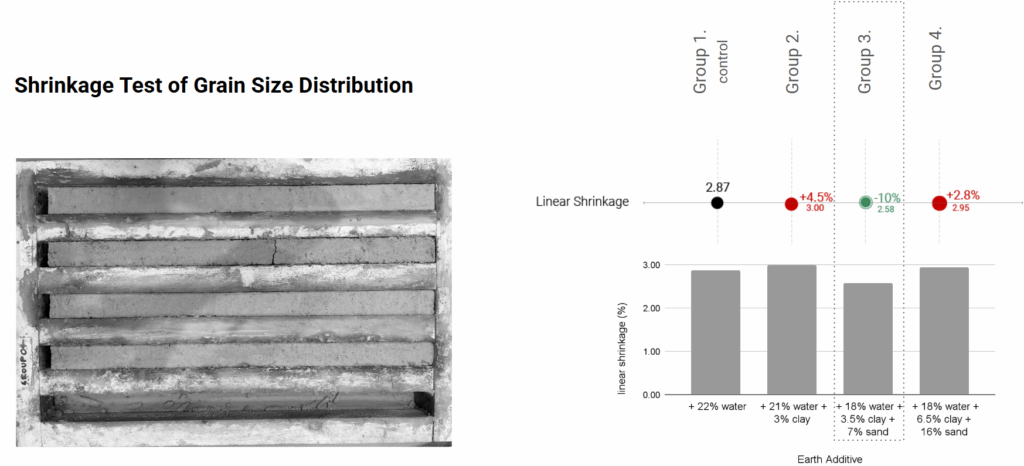
Linear shrinkage test: 2%
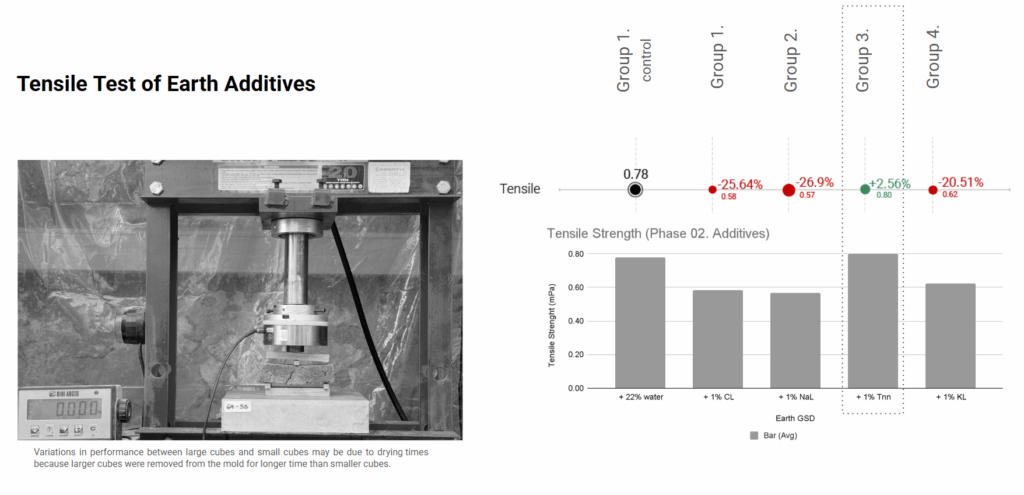
Tensile strength/ Flexural performance test: 0,7 MPa
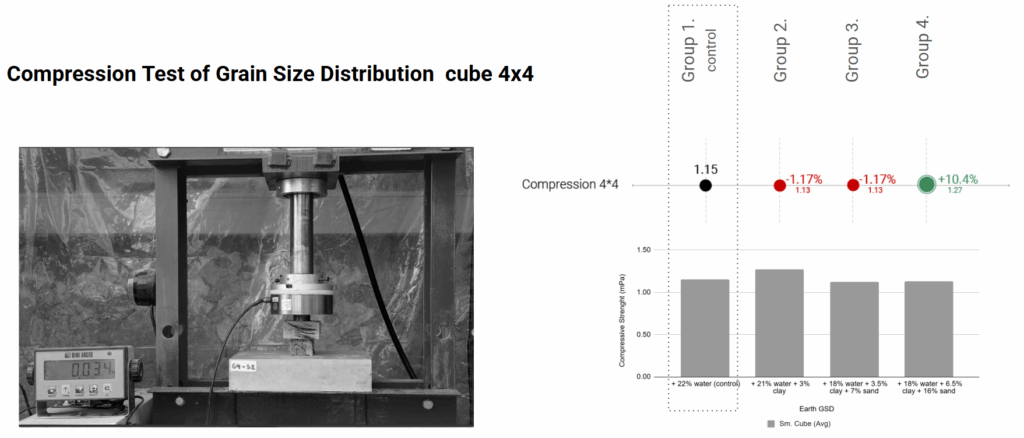
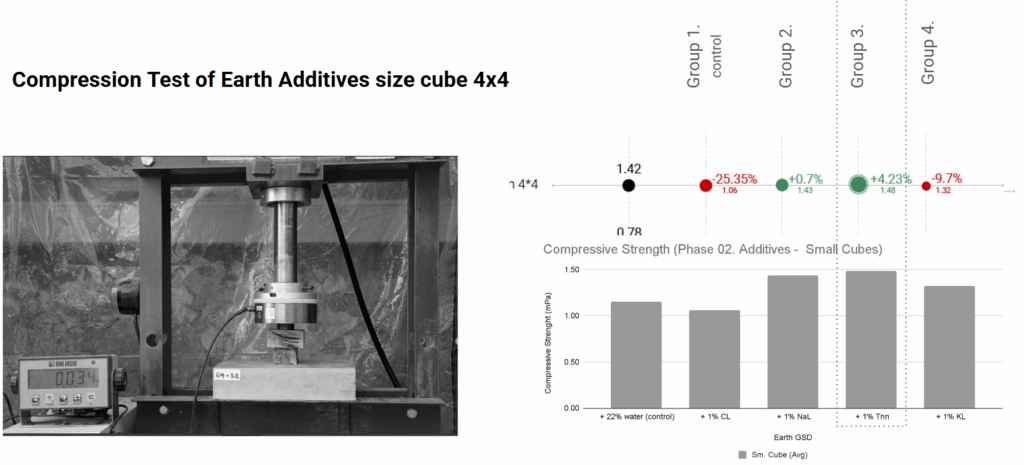
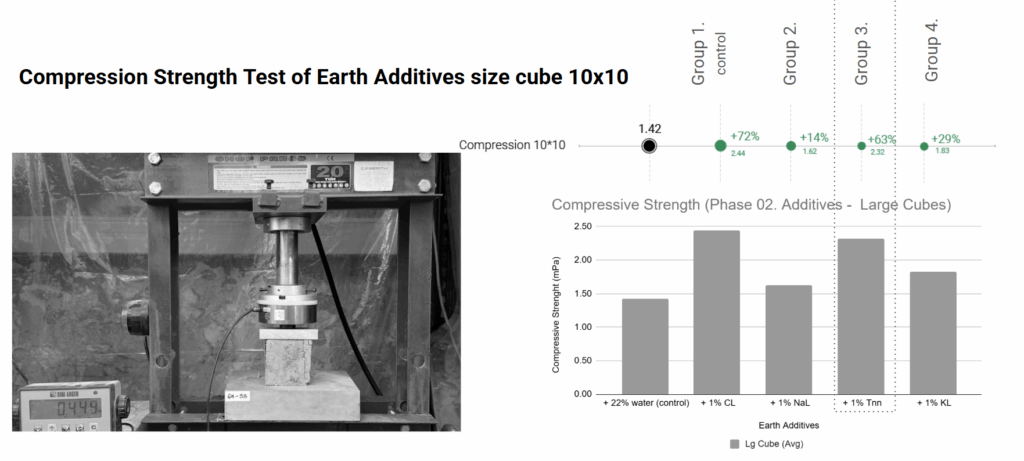
Compression strength test: 2.5MPa
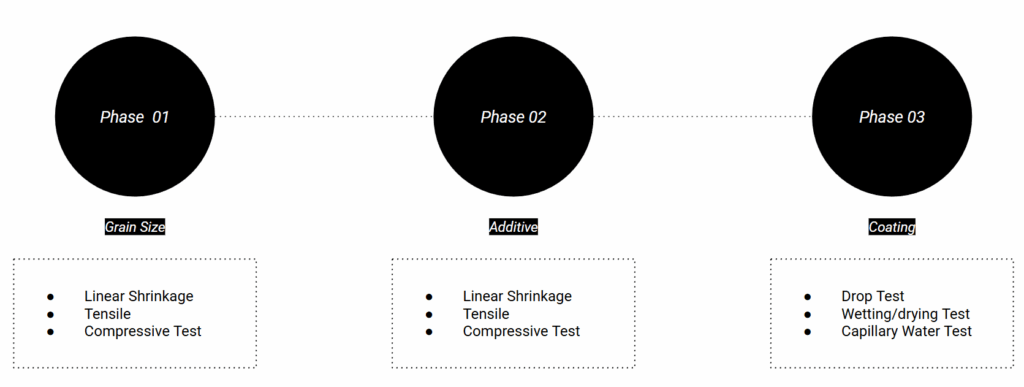
Table 1 – Grain size distribution

Eathen building standards and 3DPC standards already have standard recommendations for grain size distribution. We tested extrudability and strength of mixes with different grain size distributions in earthen material to be able to suggest recommendations for 3D printing with earth.
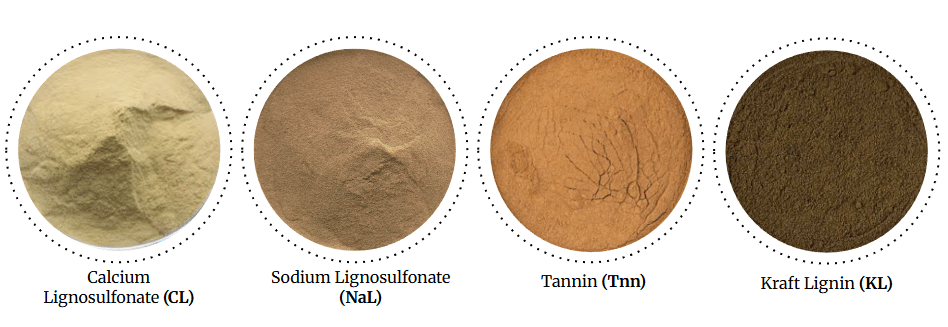
Table 2 – Additives
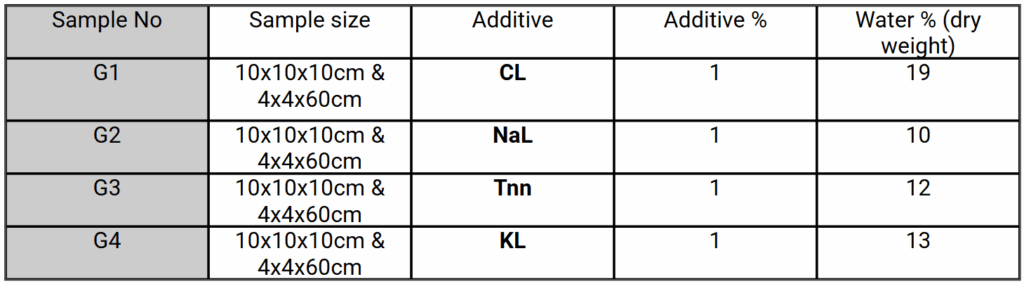
For this course, we focused on protein-based additives, as our main aim was to increase strength. The hypothesis was that different additives can improve compression strength, reaching consistently above 2.5 MPa.
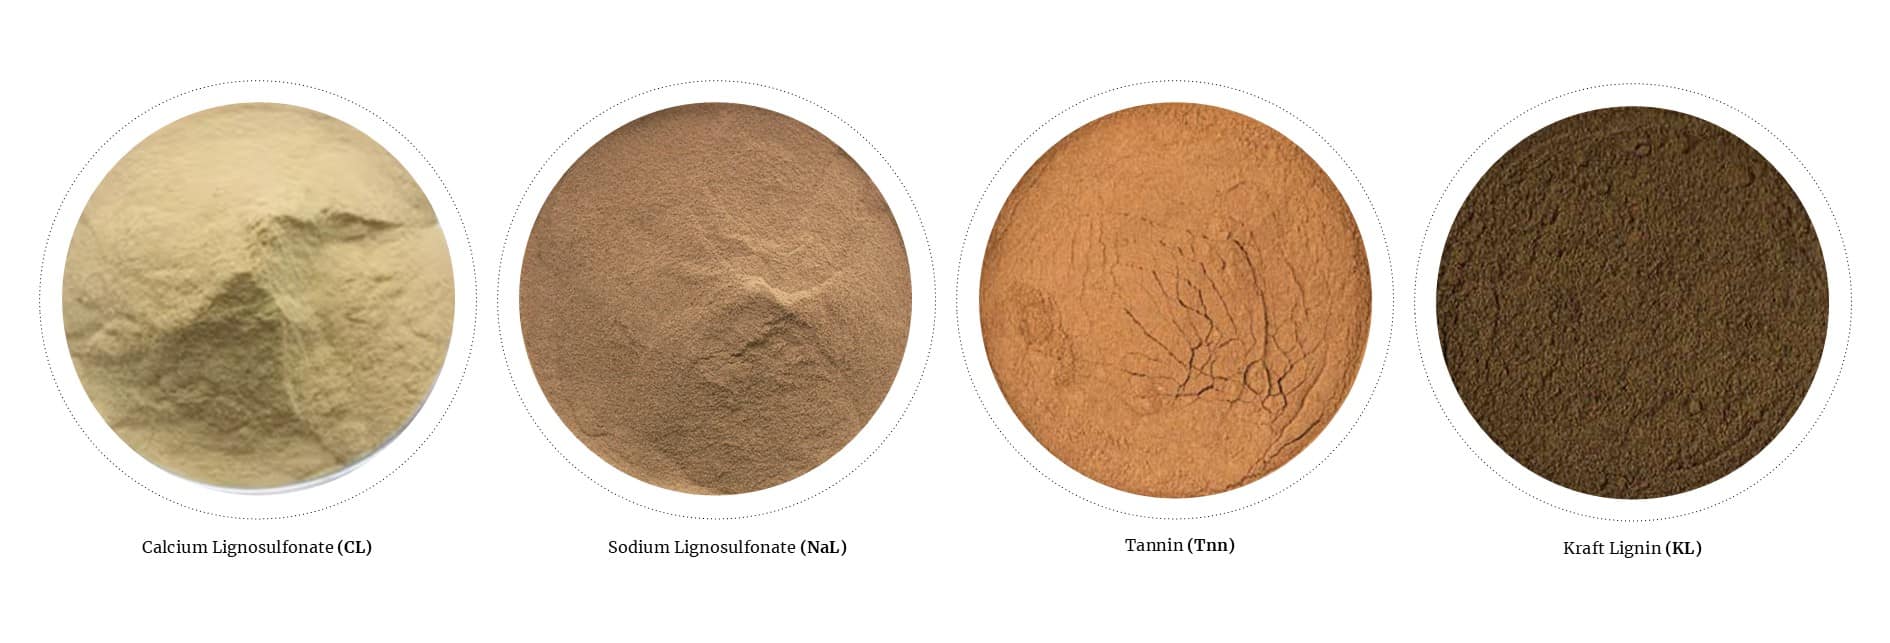
Proteins are both hydrophobic and hydrophilic, which allows them to mix homogenously whilst still being water repellent. They have a hexagonal structure, making them able to form many strong bonds, especially long-chain proteins like Tannin and Lignin are very strong. Hence, this year we tested Tannin derived from grape skin and three different types of Lignin (Calcium Lignosulfonate, Sodium Lignosulfate and Kraft Lignin).
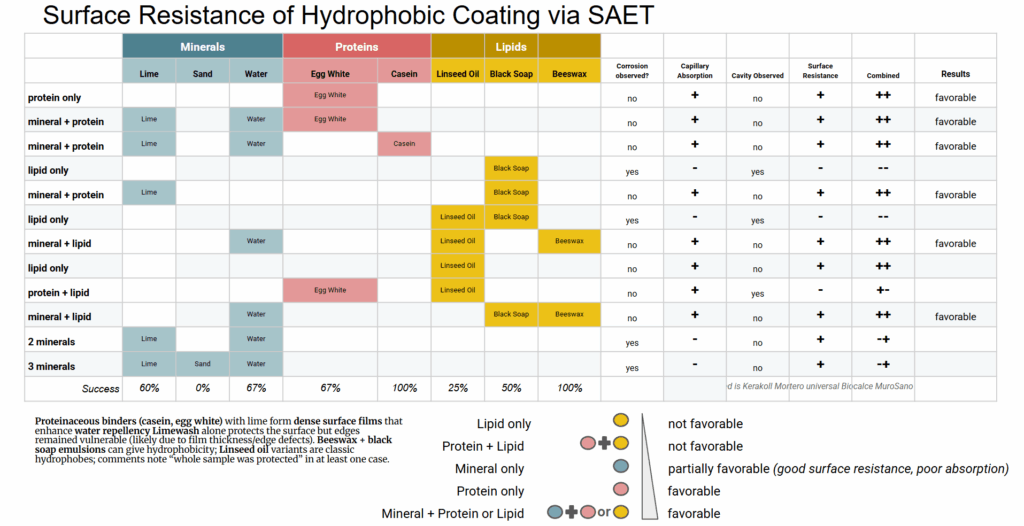
Table 3 – Coatings
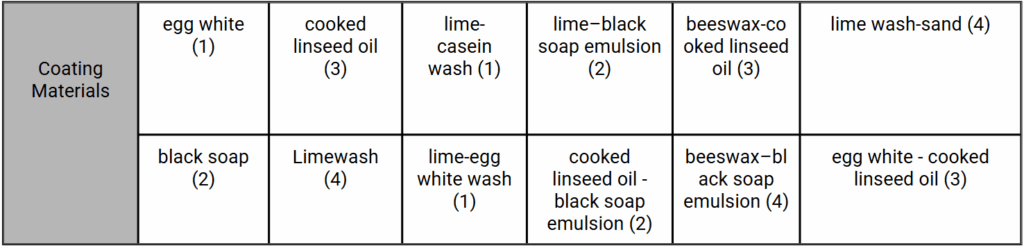
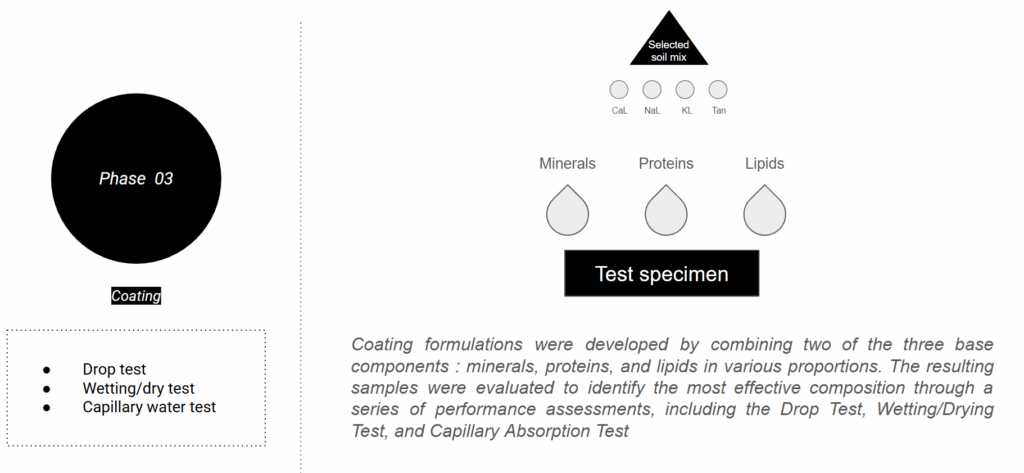
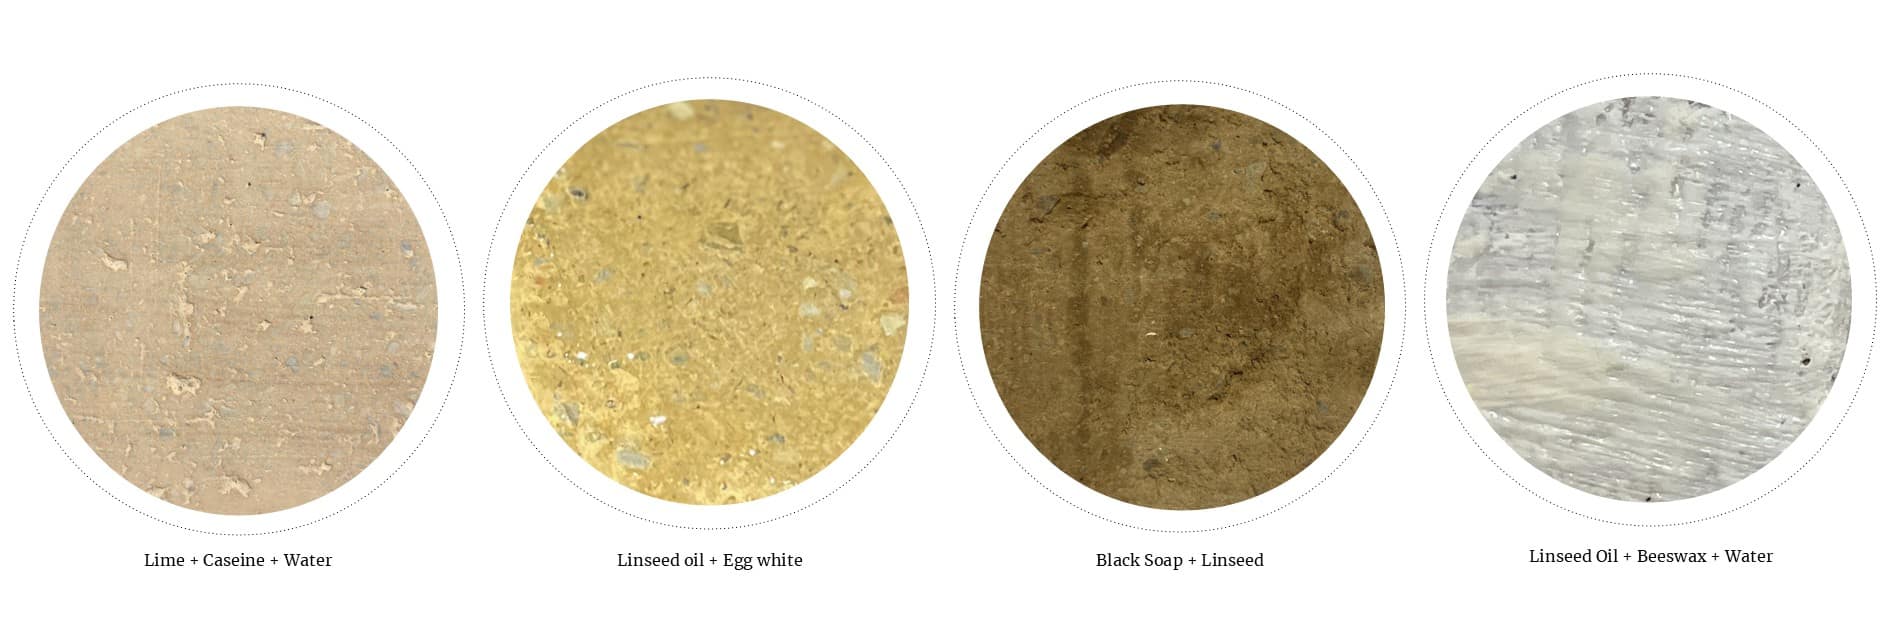
For coatings, the hypothesis is that natural coating materials can meet or exceed the minimum performance criteria of building regulations while demonstrating performance comparable to synthetic coatings.
Hence, we tested how natural alternatives would perform in comparison to a synthetic control sample (Lime). Some of the natural coatings work by penetrating into the material, while others work as surface coatings. Henche, they were tested in different combinations to find something that protects both the surface and further in, in case the surface seal is broken.
Phase 1
Methodology
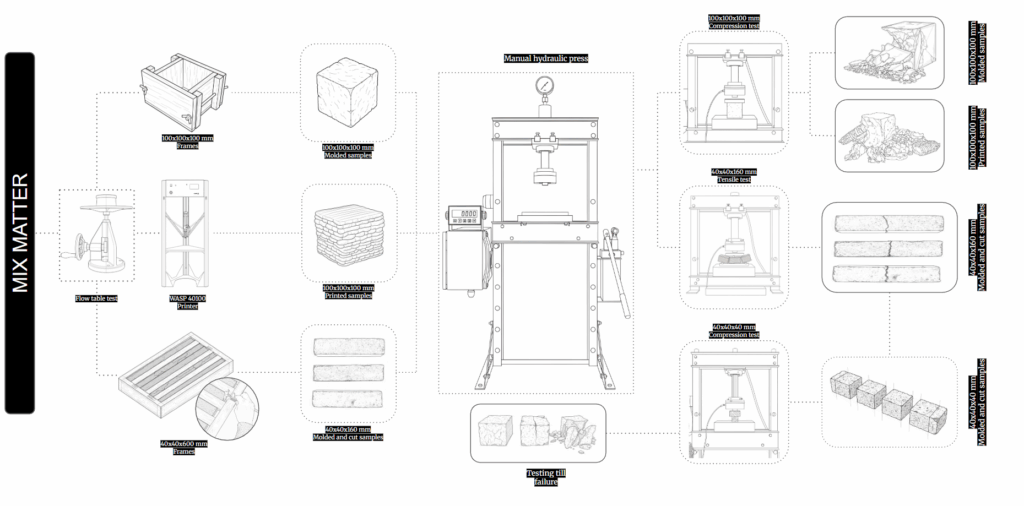

Preparing samples
To test grain size distribution, four 3D printed samples and four moulded samples of different grain size distributions were created according to Table 1. Each sample variation was replicated 3 times as control samples. At the end, only two of the planned sample variations were successfully printed due to too much sand in the mix, causing the 3D printer to struggle.
Exreudability
The flow table test was used to measure extrudability. In addition, it was also used to determine the difference in plasticity of the material before and after it had gone through the pump and nozzle of the 3D Printer.
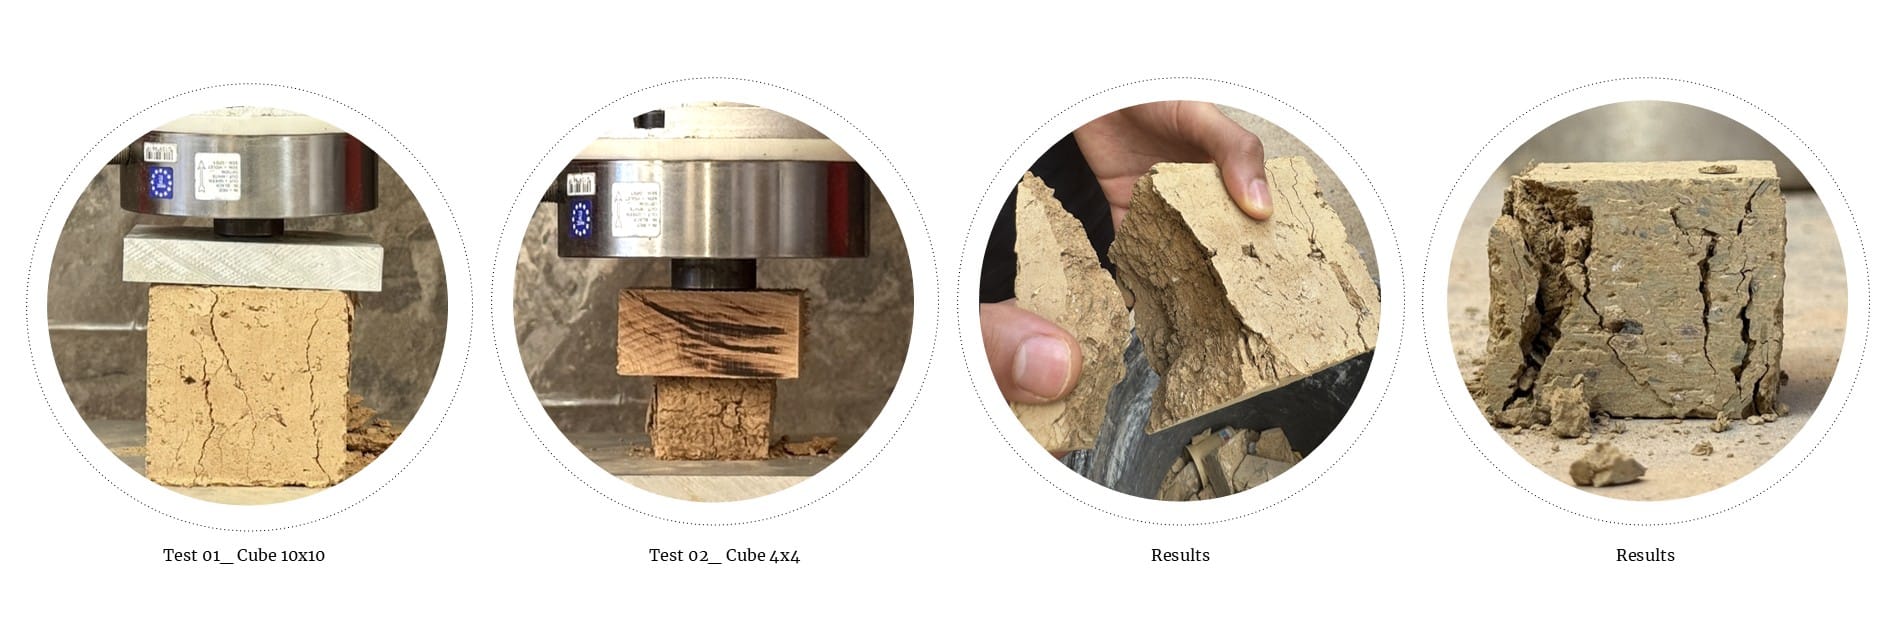
Compression test comparison
3DPC standards describe tests of 3DP samples vs. moulded cube samples, which is standard in the earthen construction standard. The 3DP samples were compared to the moulded sample, undergoing the same compression tests.
Linear shrinkage and tensile strength were measured using another mould, and only measured on moulded samples; hence, not compared with 3DP samples.
Results

Conclusion
Shrinkage test: The mixture with Earth +22% water + Sand had the least shrinkage of 2.87%
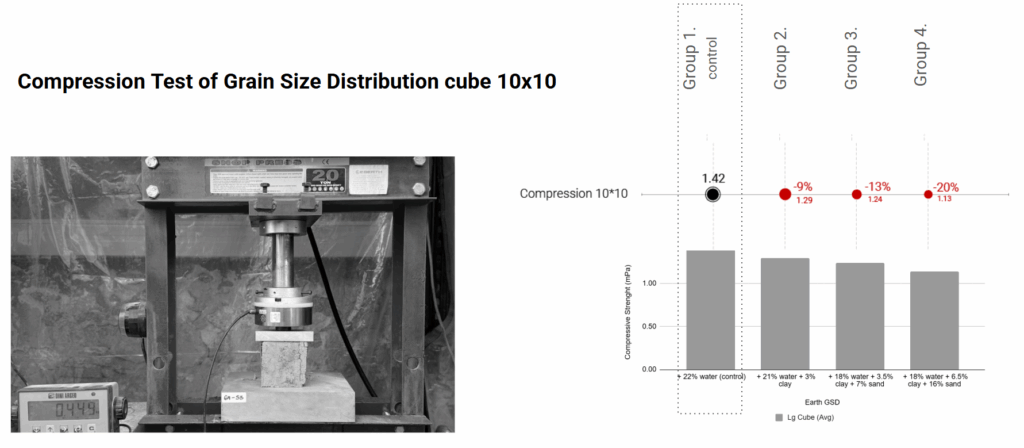
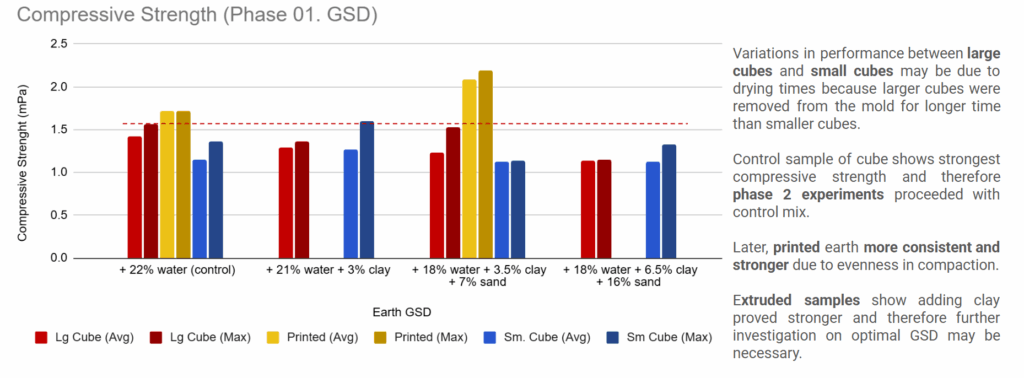
Compression test: The highest average compression strength is 1.42Mpa occurs with Earth + 22% water.
Flexural test/Tensile strength test: The highest average tensile strength is 0.89 occurs with Earth + 22% water.
3D printed samples: In the flow table test, Pumped samples showed a greater spread 1.0–2.2 cm, indicating higher flow. Extruded samples showed a smaller spread 0.5–1.0 cm, indicating higher stiffness
Phase 2
Methodology
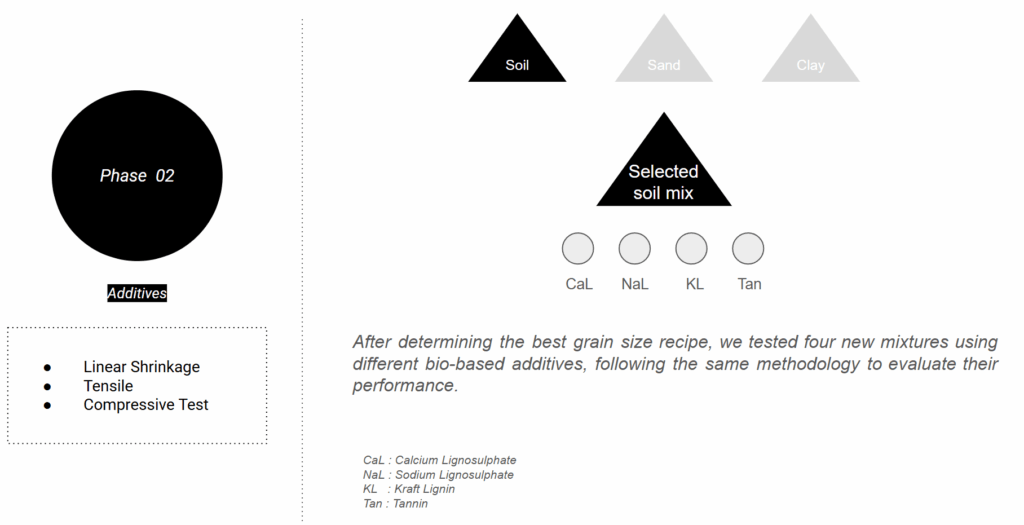
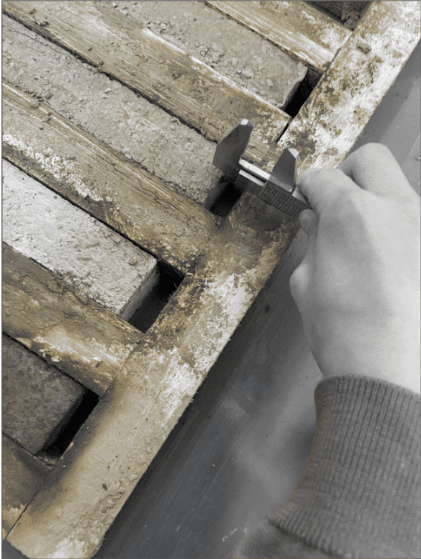
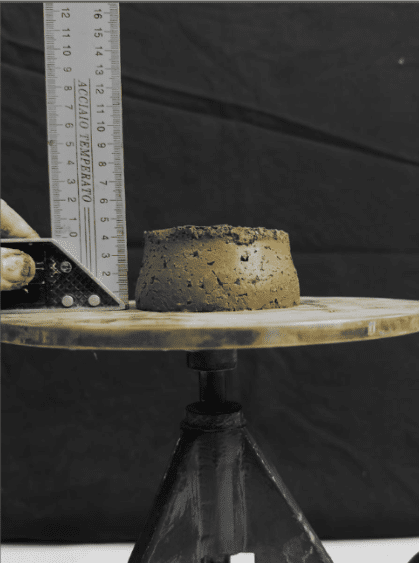
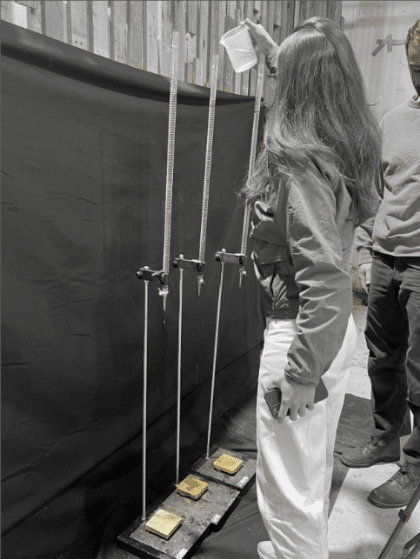
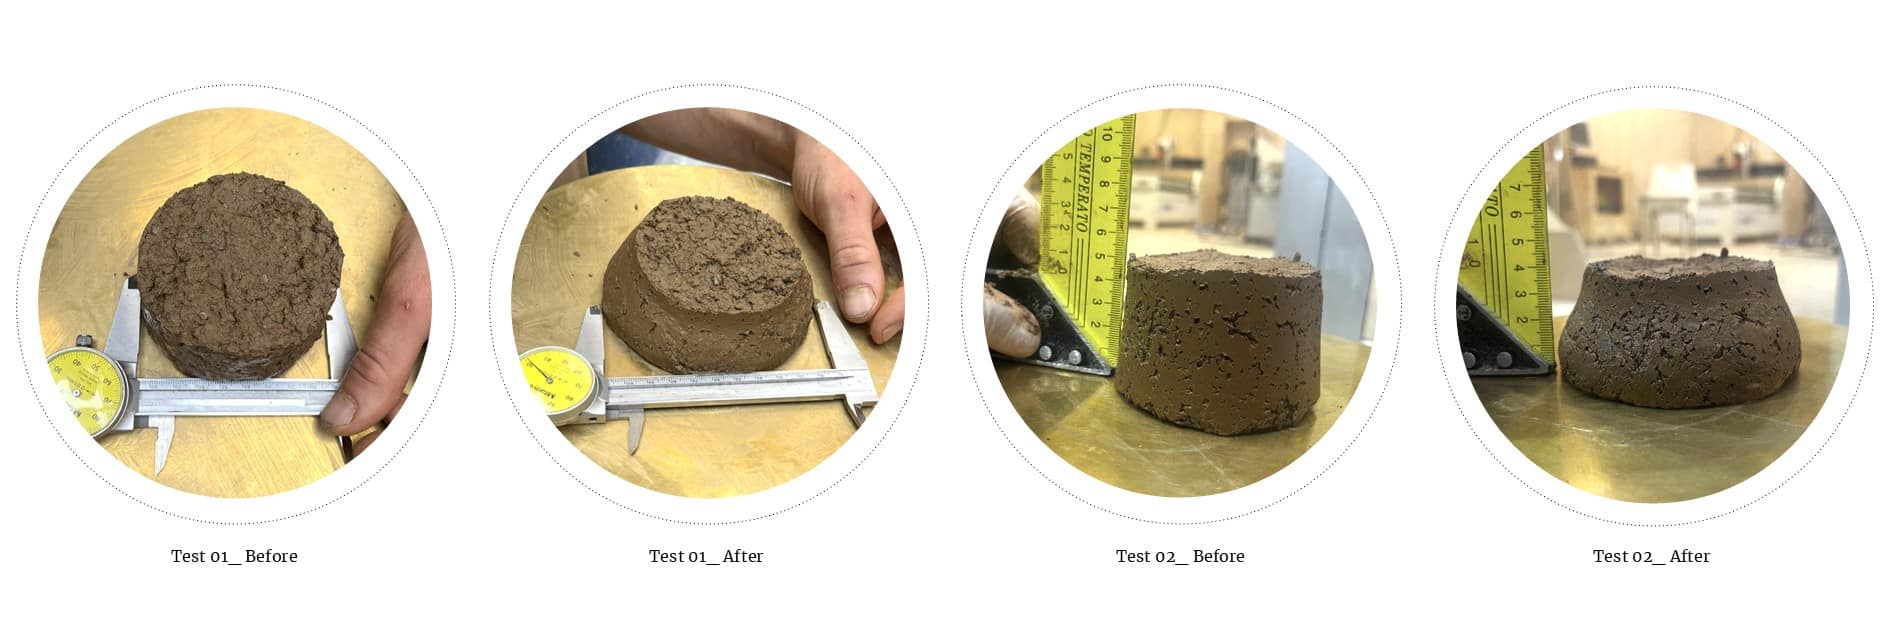
This testing methodology for shrinkage, tensile and compression strength is the same as in phase 1. In these tests, as it was in phase 1, we have mixed tests from Earthen construction standards and 3DPC standards to see which tests are best suited for 3DPE. In this photo, you see the samples for the shrinkage test.

The same sample from the shrinkage test was cut up into 3 160mm long samples to use for the tensile strength test.
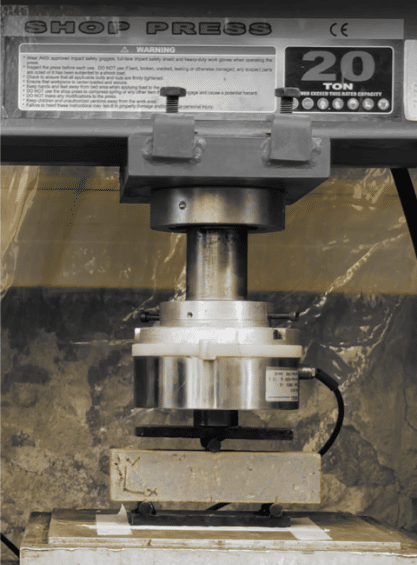
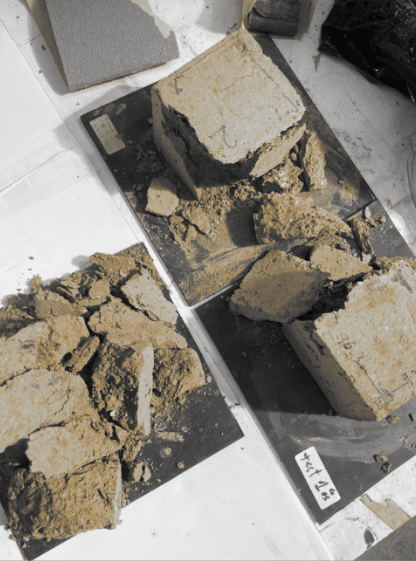
After the tensile test, the broken samples were further cut into 3 40mm long squares to use for the compression test.
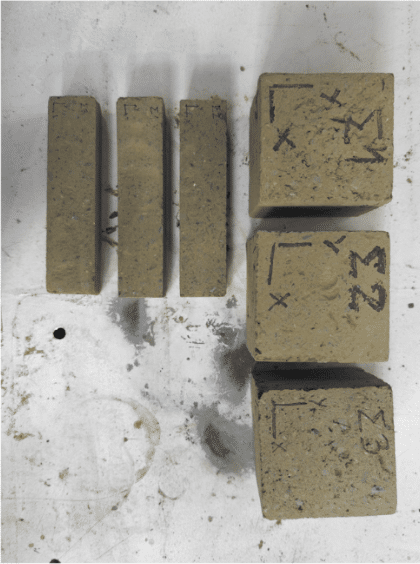
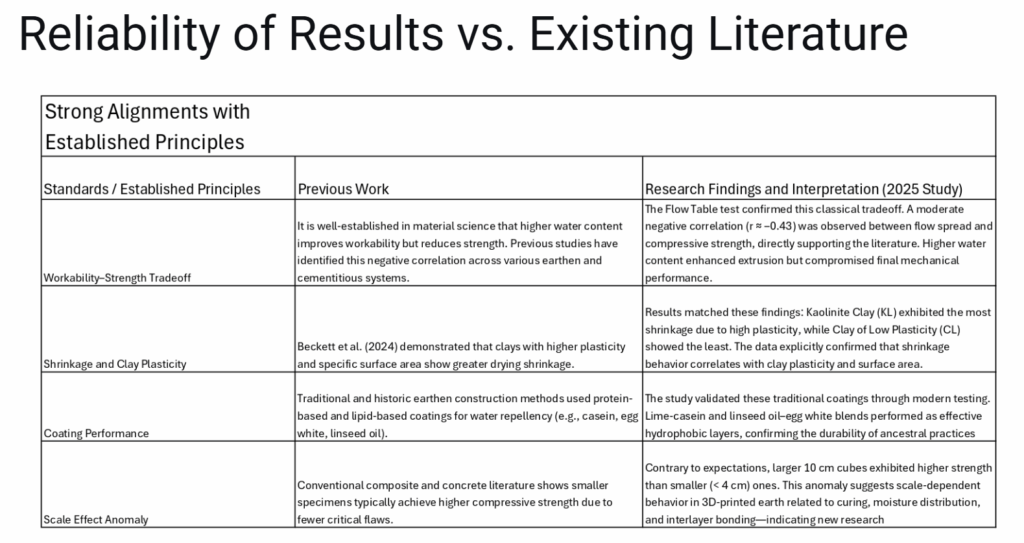
These 40 x40x40 cubes were compared to the result of the 10x10x10 moulded cubes. The hypothesis was that the test results of the small cubes and big cubes would be similar, and if so, in the future, you would only need to make small cubes, saving time and material.
Results
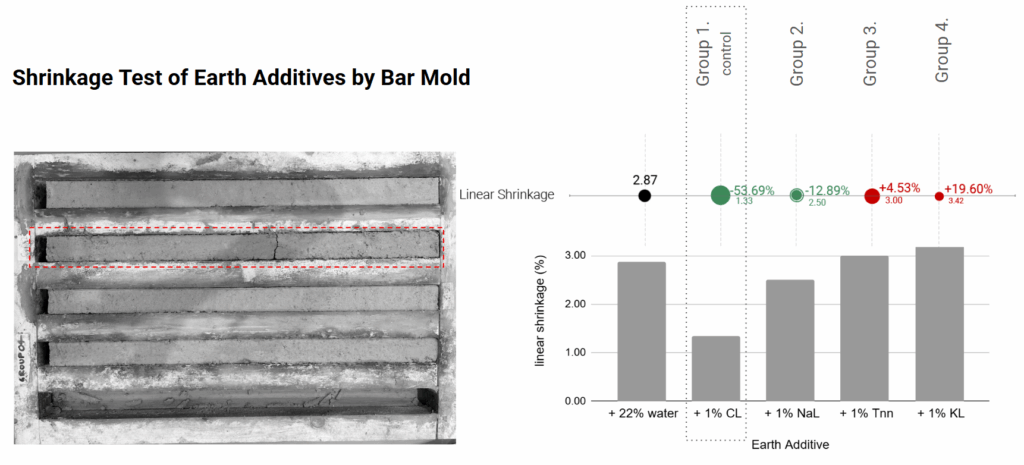
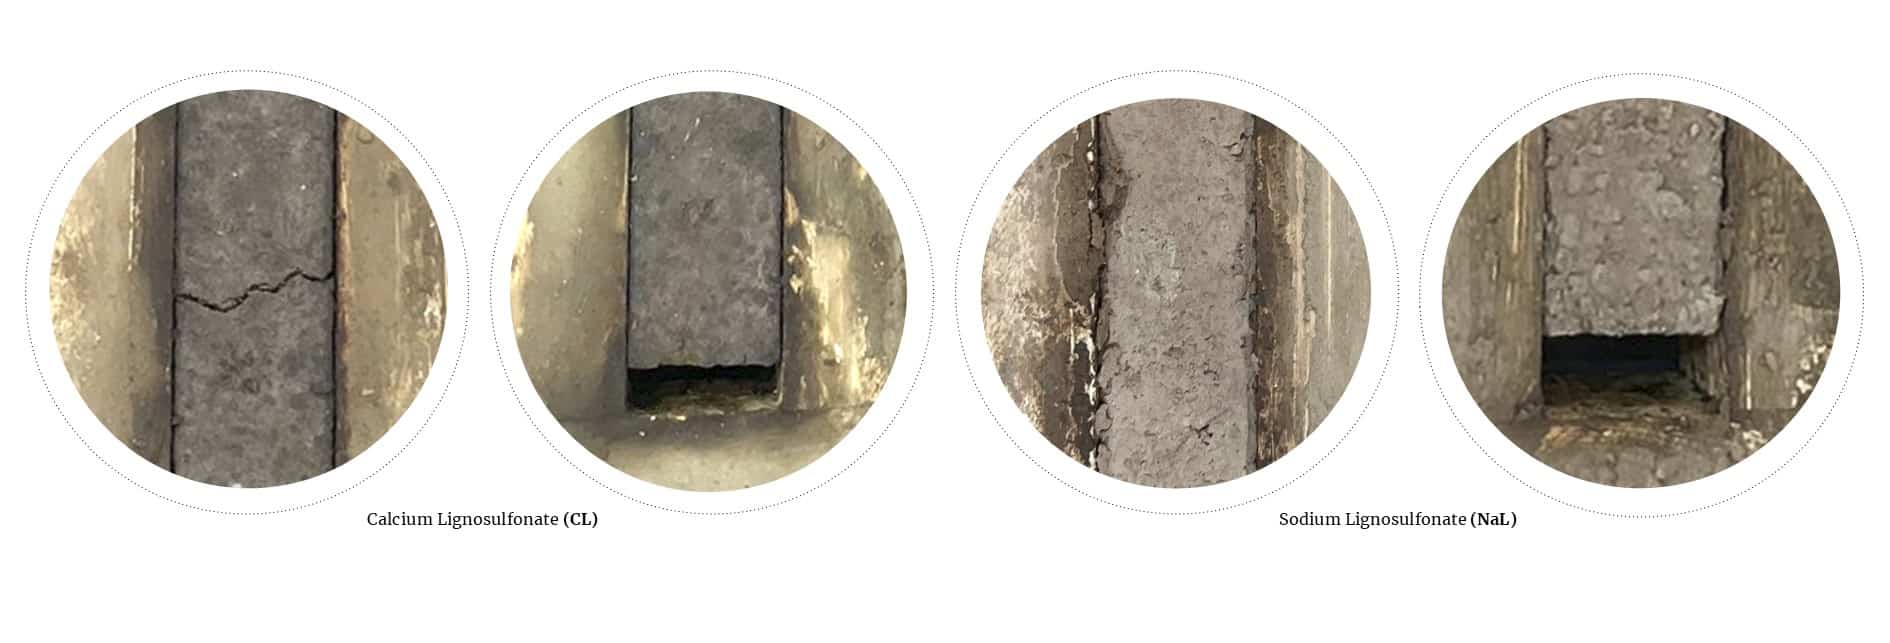
Shrinkage test: the additive CL was the only sample meeting the minimum performance benchmark with a 1,33% shrinkage. NaL came close with 2,5%. A crack was observed in CL.
Compression test: Both CL and Tnn reached 2,44MPa. It is believed that the compression strength threshold of 2,5 will be reached when adding fibres.
Flexural test/Tensile strength test: The only material reaching the threshold for the tensile strength was tann with a compression strength of 0.78MPa. It should be noted that the material was not fully dried, and it is believed that it might even go higher when tested again.
Overall, the tannin performed a little better than CL, but CL is considerably cheaper. Hence, both are still being tested to reach a final conclusion.

Conclusion
The small cubes showed consistently considerably lower compressive strength than the big cubes, indicating that they cannot replace the big cubes. However, the cubes might not have been fully dry, which may have affected the samples. This needs to be tested further to fully conclude.
Overall, the tannin performed a little better than CL, but CL is considerably cheaper. Hence, both are still being tested to reach a final conclusion.
Phase 3
Methodology
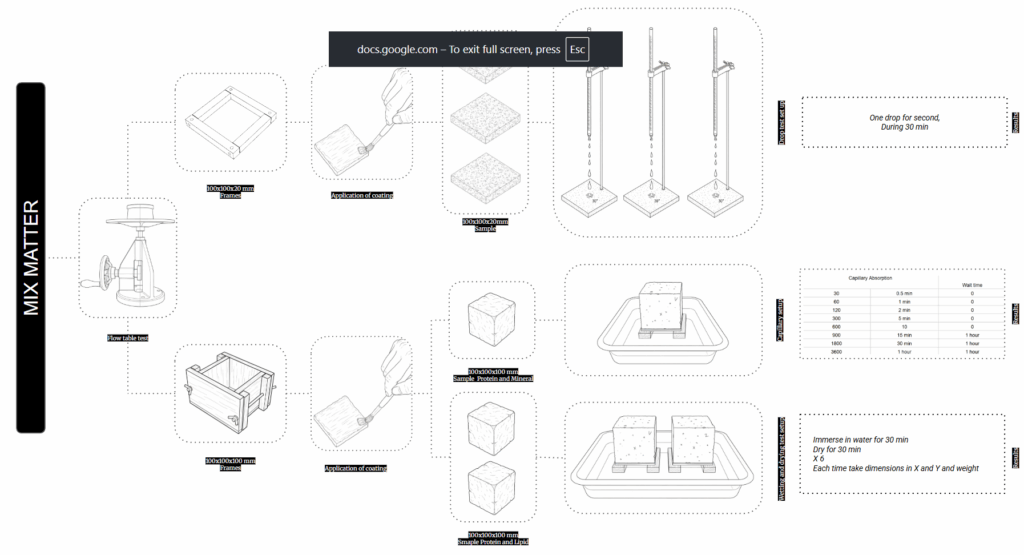
Step 1
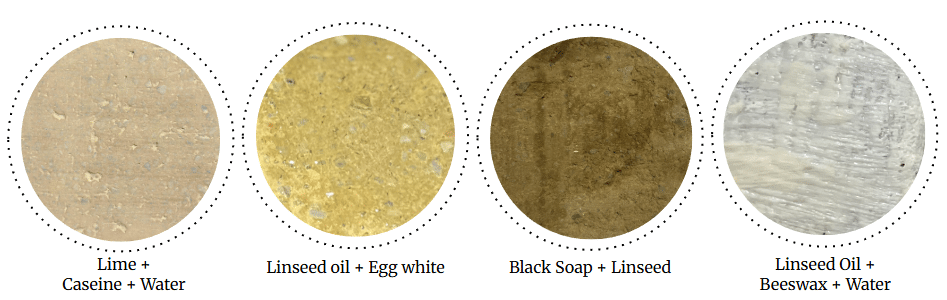
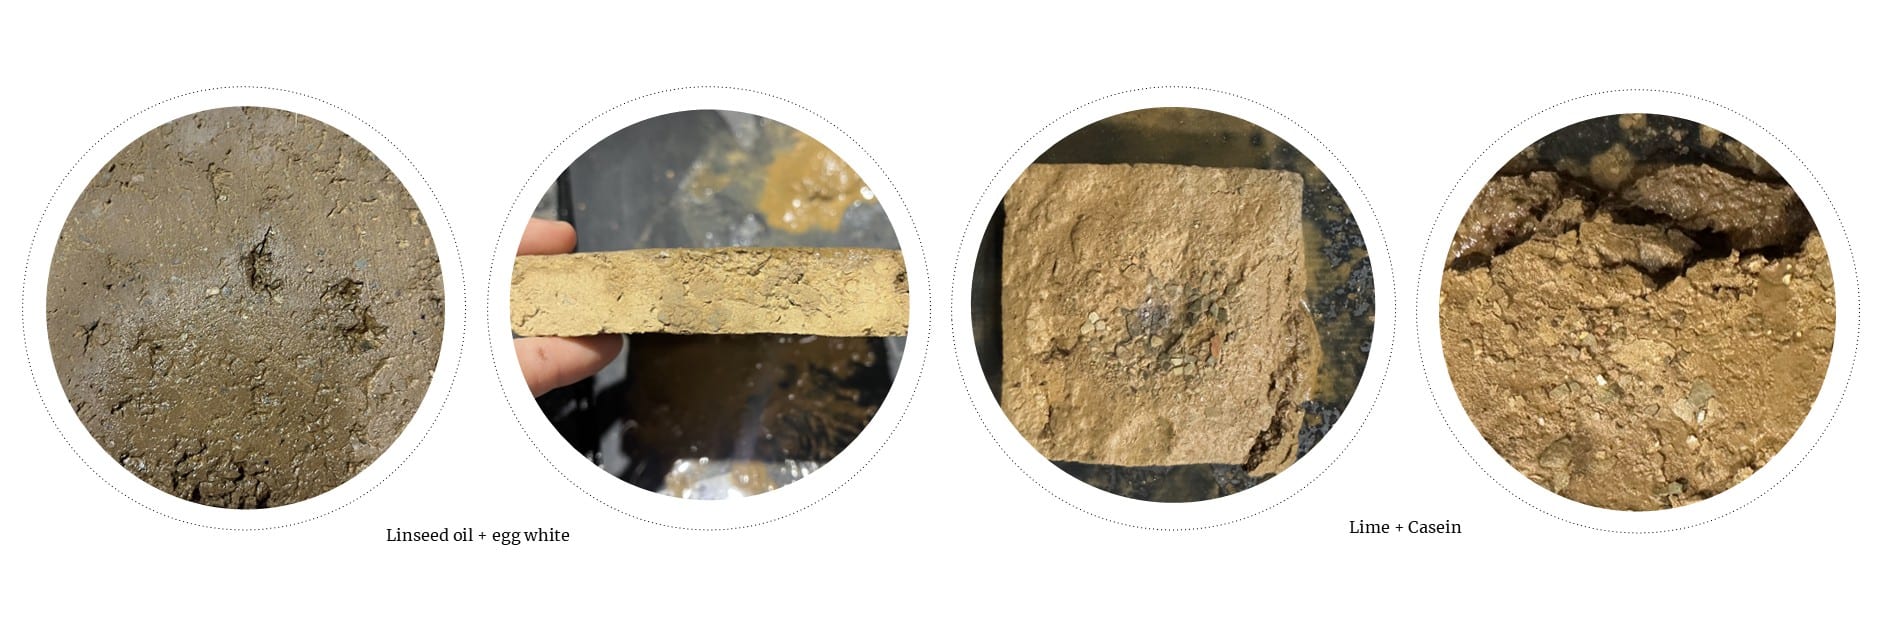
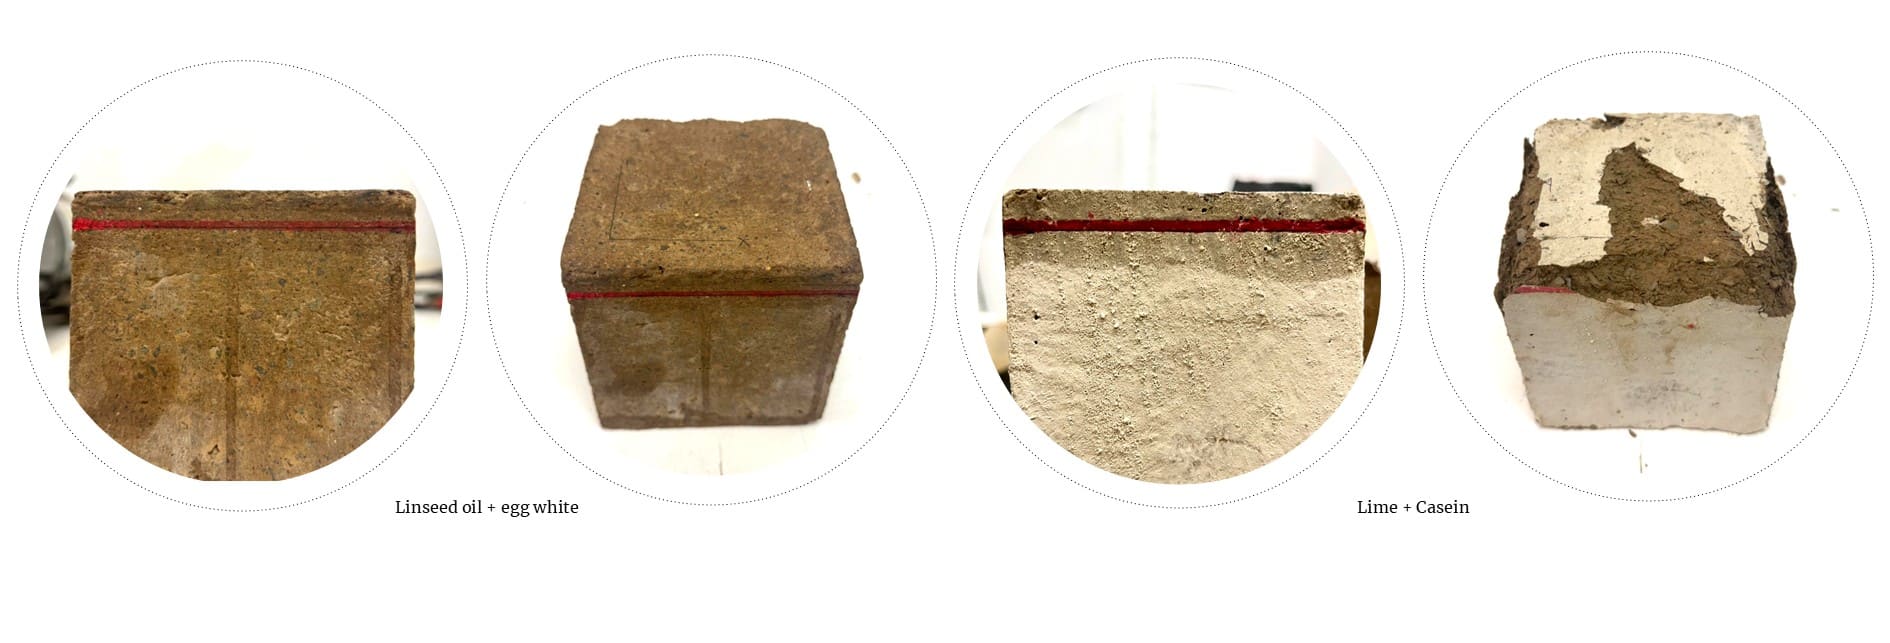
The two best coatings from the drop test were used for the wetting/dry cycle test and the capillary absorption test. Lime + Casein, and Linseed oil + egg white.
Step 2
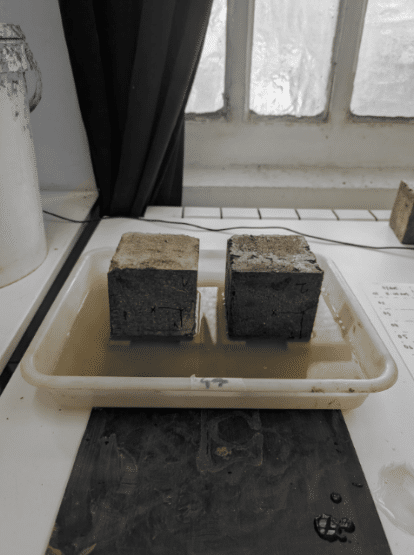
These two best coatings were then added to three 10x10x10 cubes. In the wetting/drying cycle tests, we visually observed if there were any cracks or damage. In the capillary absorption test, we weighed and measured the dimensions of the sample after each test to see how much water had been absorbed.
Step 3
After the wetting/Drying test and capillary absorption, the wetting/ drying test was performed one more time, but this time it was 30 min in water and 30 min outside, then the wet and dry weight was measured for each cycle.
Results
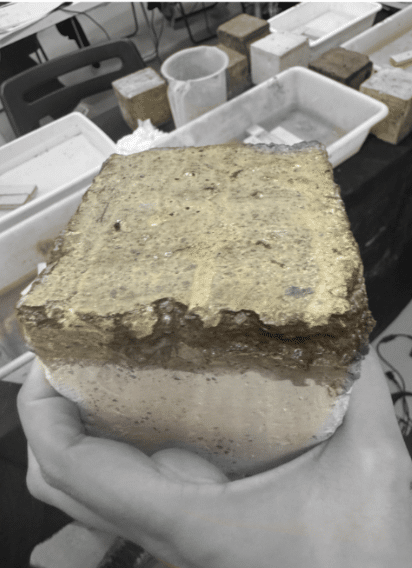
Wetting-drying cycle test: Lime + Casein after 4th or 5th cycle has proven to be completely broken for all samples except for the sample with the additive tannin. Linseed Oil and Egg White have sustained all the cycles with little to no damage for all samples.
Lime and casein leave a significant whitish colour on the samples
Drop test: Black soap–only surfaces exhibited visible absorption and material loss. Black soap was the worst of all the coating material.
Linseed oil + eggwhite was the best as the egg whites protect the surface, without creating a very visible colour difference, while the linseed oil protects the sample deeper into the cubes.
Conclusion
For the coating, linseed oil + egg white was by far the best mix among the natural coatings, performing similarly to the synthetic coating in most tests, and in the wetting/drying cycle, even better than the synthetic.
Global Discussion:
Main findings and Expectations
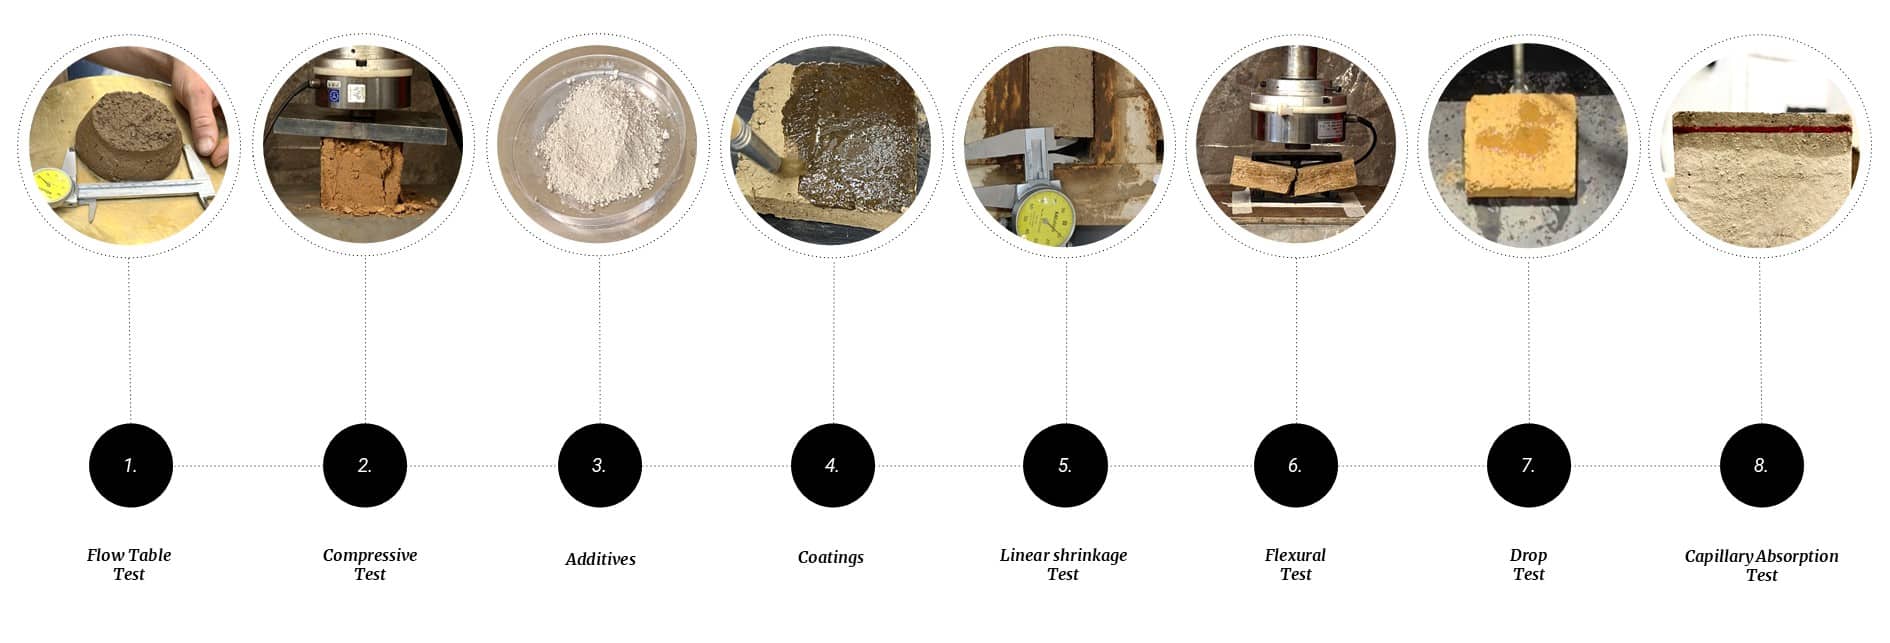
- Flow Table Test :
Performance :
The spread difference was smaller for extruded samples compared to pumped ones.
An ideal spread difference is about 1.2 cm which is the best performance for smooth flow and stable printing.
Results :
- Pumped samples showed greater spread 1.0–2.2 cm indicating higher flow.
- Extruded samples showed smaller spread 0.5–1.0 cm indicating higher stiffness.
2. Compressive Test :
Performance :
2.5 MPa target (DIN German regulation).
In printed Models the highest average compression strength was 2.09 with was with addition of clay.
Results :
- In Phase 1 the highest average compression strength is 1.42Mpa occurs with Earth + 22% water .
- In Phase 2 the highest average compression strength is 2.44 MPa which was with 1% Cl and 1 % tannin
3. Additives :
Performance :
The mean of the initial rates of water absorption to the nearest 0,1 kg/(m2 × min).
All the Additives performance are analysed with the criteria of compression strength tensile strength and Capillary absorption.
Results :
- Tannin (Tnn) exhibitied better compression Calcium lignosulfonate (NaL) improved compressive and flexural strength.
- Calcium lignosulfonate (NaL) , exhibited better results 0.16 x 10 -3 than tannin which was 0.76 x 10 -4.
4. Coatings :
Performance :
All the coatings are analysed with the surface erosions and cavities formed.
Results :
- Lime and caseine leaves a significant whitish colour on the samples.
- Black soap–only surfaces exhibited visible absorption and material loss.
5. Linear Shrinkage :
Performance :
Maximum shrinkage criteria used:
DIN 18947 – Germany = 2%
Results :
- In Phase 1 the mixture with Earth +22% water + Sand had the least shrinkage of 2.87%
- In Phase 2 CL and NaL had the lowest shrinkage with 1.33% and 2.50 % respectively .A crack was observed in Cl
6. Flexural Test :

Performance :
0.7 MPa target (DIN German regulation).
Results :
- In Phase 1 the highest average tensile strength is 0.89 occurs with Earth + 22% water.
- In Phase 2 the highest average tensile strength is 0.78 which was with 1% Tnn ( material was not dried).
7. Drop Test :
Performance :
The Criteria for the suitability of the coating was judged with the depth of the Cavities which was 0 ≤ D ≤ 10.
Results :
- Lime–casein, linseed oil and egg white coatings resisted water droplets showing no surface penetration.
- The block soap and beeswax coatings shows coating loss and it was cracking.
8. Capillary Absorption Test
Performance :
The capillary water absorption test confirmed that lime–casein and linseed oil–egg white coatings provided the best resistance to capillary rise, maintaining surface integrity even after extended exposure.
Results :
- Lime + Casein after 4th or 5th cycle has proven to completely broken.
- Linseed Oil and Egg White have sustained all the cycles with less damage hence giving better results.
Further steps
Future investigations should focus on enhancing material standardisation, performance optimisation, and long-term sustainability of 3D-printed earthen materials. The following directions are proposed: