It is natural for the climate to changes over the millions of years, it is a way in which the planet regulates itself. The problem is that before the industrial revolution, before all the gas emissions started (around 1870), the planet would heat up one degree every 1000 years. Now it’s one degree every 100 years.
Flooding is a worldwide phenomenon that represents around 70% of natural disasters, affecting more than 1,8 billions of people. The drastic increase in global temperature in recent decades has severely influenced the intensity and frequency of flooding. What happened in Valencia, October this year, prompted us to look into it in depth and try to understand why Valencia got flooded. While there are many causes of flooding in a city, in this work we will focus on flooding caused by the Dana.
Specifically, throughout this work, we want to address a question that was the trigger for this research: Could the Valencian Dana rains occur in other areas?
What is DANA?
Depresión Aislada en Niveles Altos (DANA)
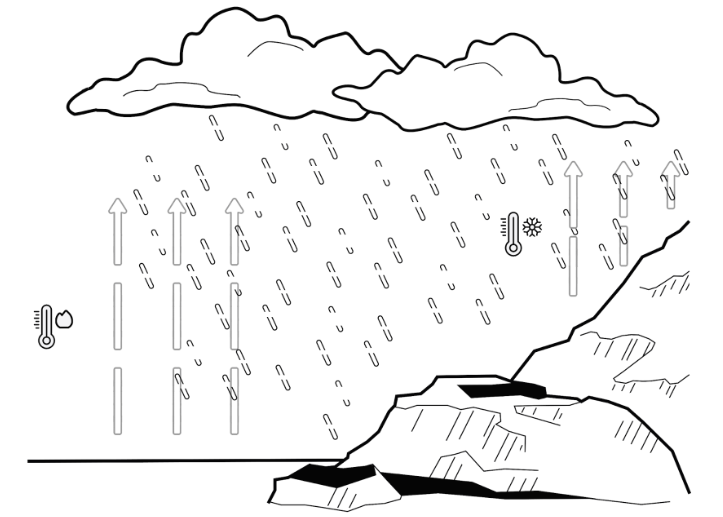
DANA, is a natural phenomenon of the Mediterranean sea. As its name suggests, Isolated Depression at High Levels (in English), happens when a warm mass of air from the sea combines with an isolated mass of cold air. This produces atmospheric instability, which translates into intense rainfalls in a very short period of time.
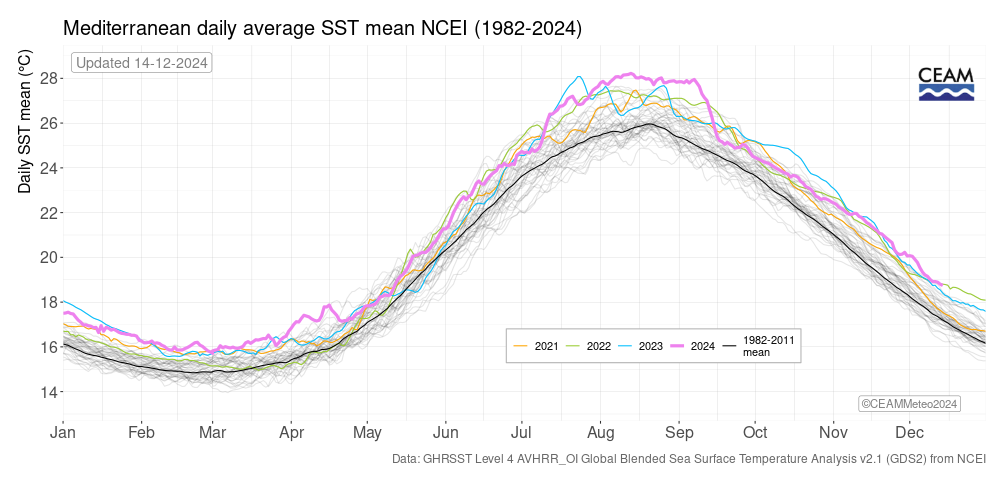
CEAM, 2024
But the problem here is that the temperature of the Mediterranean sea is dramatically increasing since the last years. For every degree rise, 7% more water accumulates in the clouds. Since 2011 the temperature has increased more than 2.5°C, and the actual trend indicates that it is increasing 0.3°C per year. This situation generated more amount of water and intense rainfall, is a very short period of time. Therefore, in the case of Valencia, it rained in one day what was expected in a year.
The reason why the temperature of the Mediterranean is increasing rapidly is because of climate change. While it is natural for the climate to change over millions of years, it is not the abrupt and accelerated manner in which it is doing so.
Why is the Mediterranean rising?
Geological changes and Anthropocene interventions

It is important to note that these climatic changes are not linear, but rather dynamic. Water, for example, in its dynamism can take different forms. A river can rise and fall and move again and again over the years.
It is natural phenomena, such as floods, that cause changes in the climate that transform the landscape and thus the species that live in it. Each species feels these atmospheric changes in different ways and on different time scales.
Today, the acceleration of climate change, especially as a result of human activities, generates atmospheric imbalance due to the greenhouse effect. This means that the sun’s energy that used to flow in and out of the earth now stays inside. The most important fact here is that 91% of this energy (heat) is absorbed by the ocean.
In the case of the Mediterranean Sea, the situation is even worse, because being an isolated sea, it is more predisposed to retain heat and not to cool down very easily.
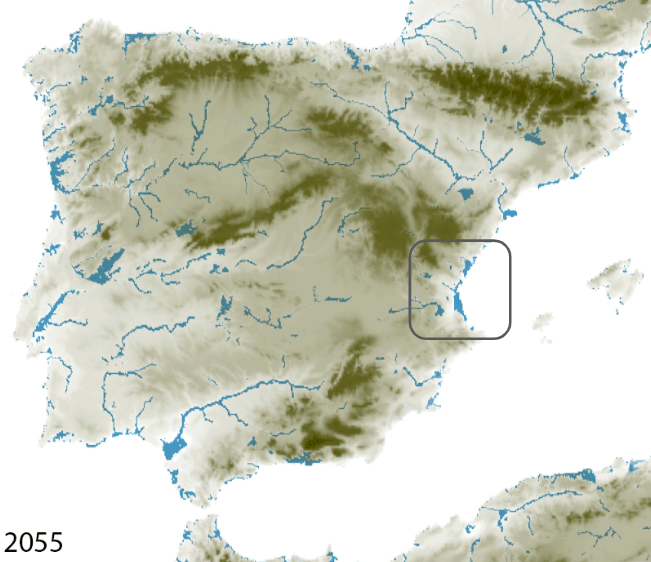
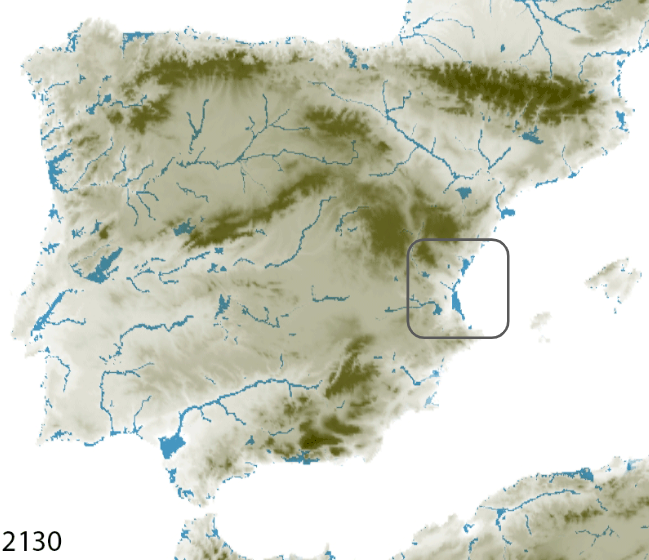
In this flood forecast for Spain we can see how the situation is worsening throughout the country. In particular, in the case of Valencia we can also observe a notable increase in the amount over the years.
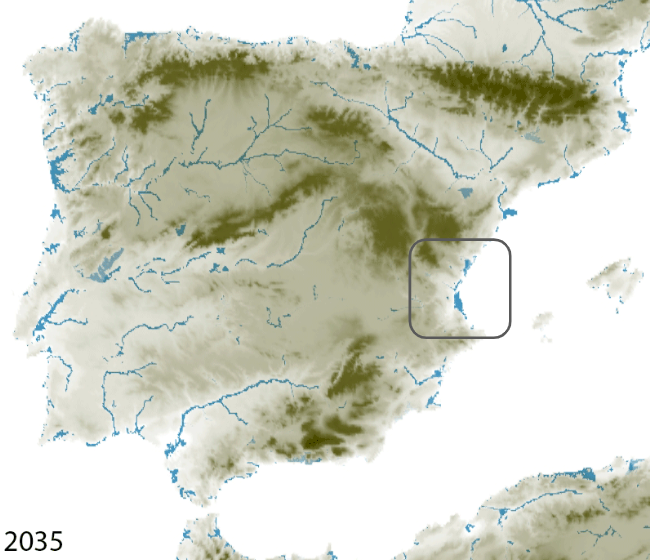
Map develop with grasshopper based on Ward, Winsemius, Kuzma, Bierkens, Bouwman, Moel, Díaz Loaiza, (2020), Prediction based on 2013 data
Understanding the Valencia case
Which factors increase flooding risk by a Dana?
Historical Factors
Up to here we had seen the external factors that contribute to a city get flood, such as, the increase of the air and water temperature. But, there are factors that predispose to a city to get flood: historical and physical.
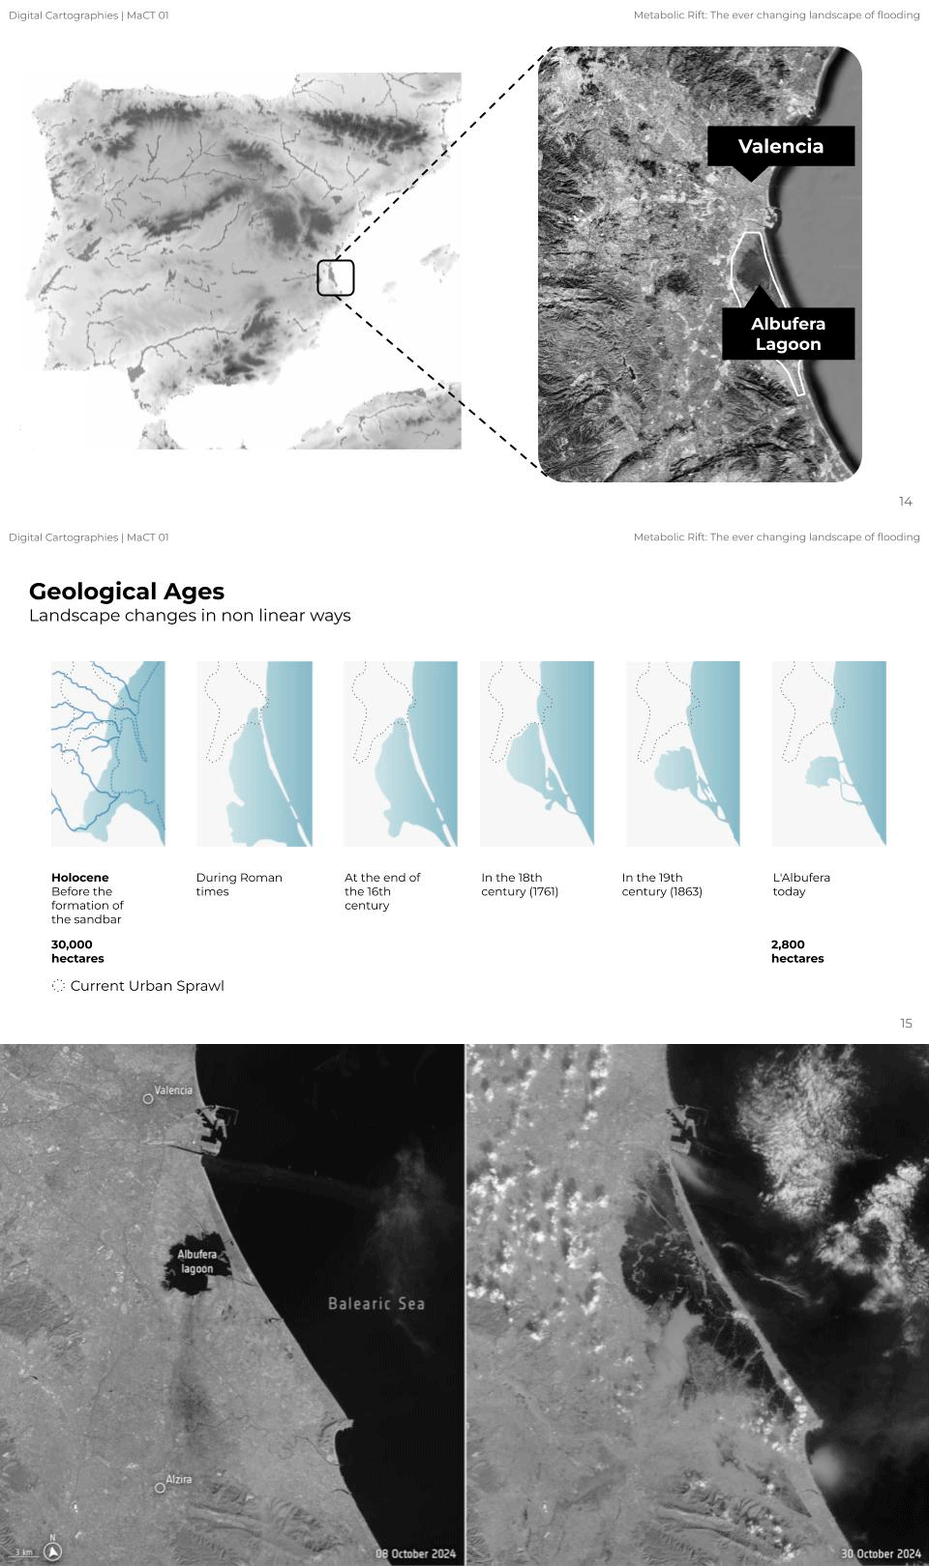
Some important information to understand Valencias territory is that Valencia is located right next to the Albufera Lagoon. This lagoon has not been the same always. In the roman’s time, the lagoon started to get intervened by humans and intentionally dried. Over time, the lagoon has undergone several human-induced interventions until it has reached the present situation, where it is less than 10% of its original size.
In the pictures on the left we can see a before and after the flood of 28 October. It is interesting to see how much it resembles the Holocene landscape, as if it is trying to recover its original shape. Water is dynamic and every time we try to control it the long-term consequences are increasingly devastating.
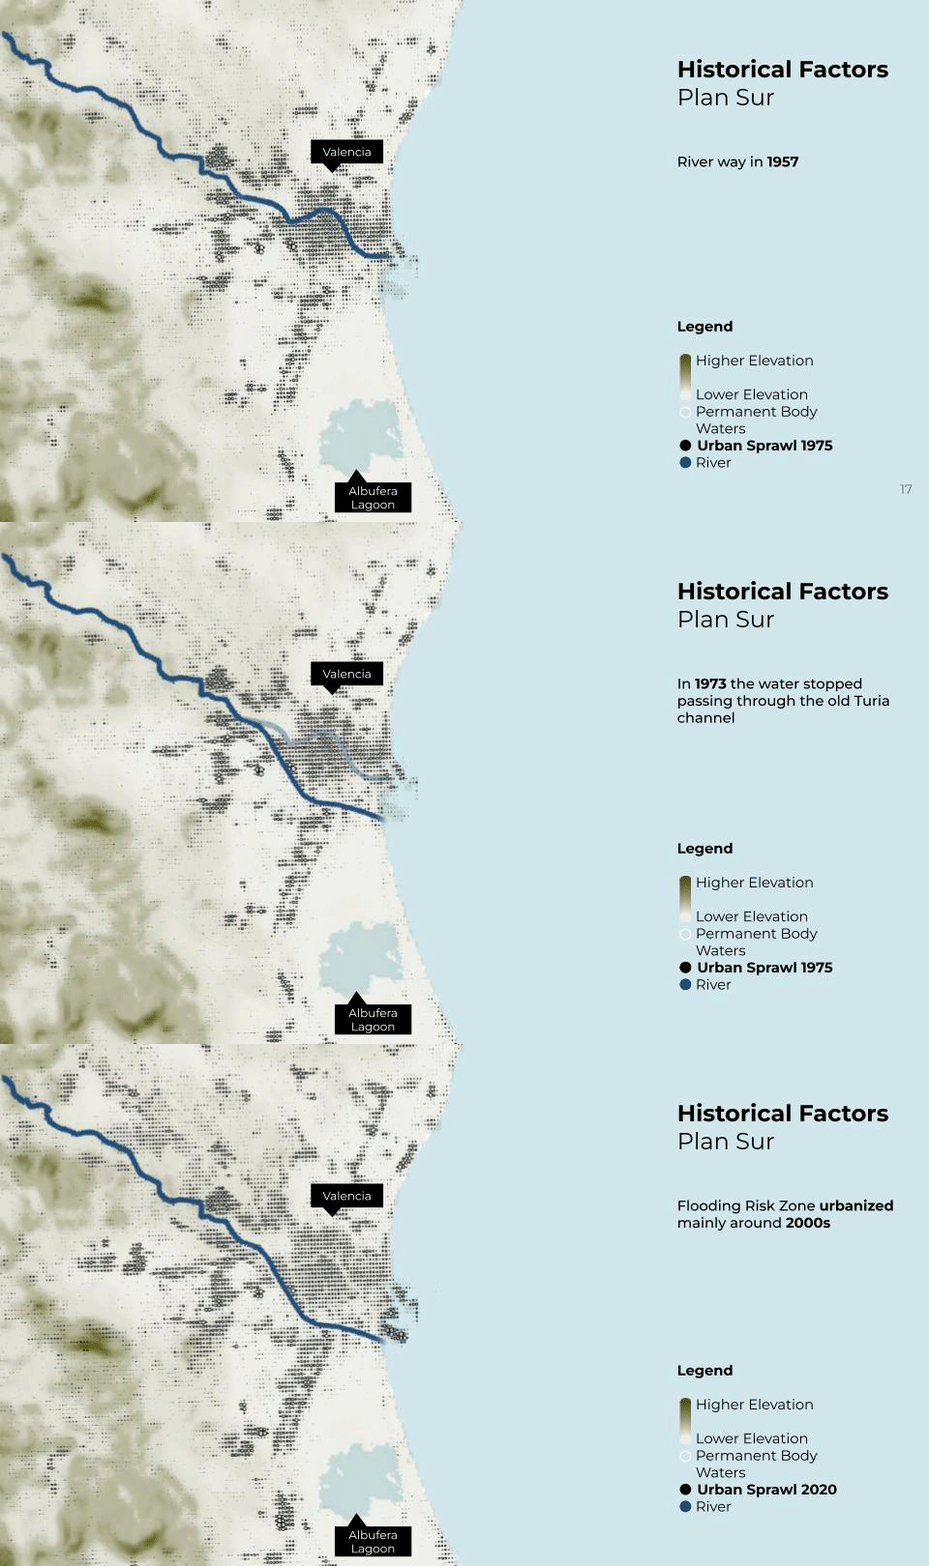
Another important intervention in Valencia was that of the riverbed in 1957. A massive flood that year left the city centre under water. For this reason, the Plan Sur was created, which consisted of changing the riverbed so that it would overflow elsewhere. As there was no urbanisation in the south of the city at that time, they decided to change it to its current location. In the 2000s, with the real estate boom, this area was urbanised at an accelerated rate without considering the fluctuation space for the river, because again: water is dynamic.
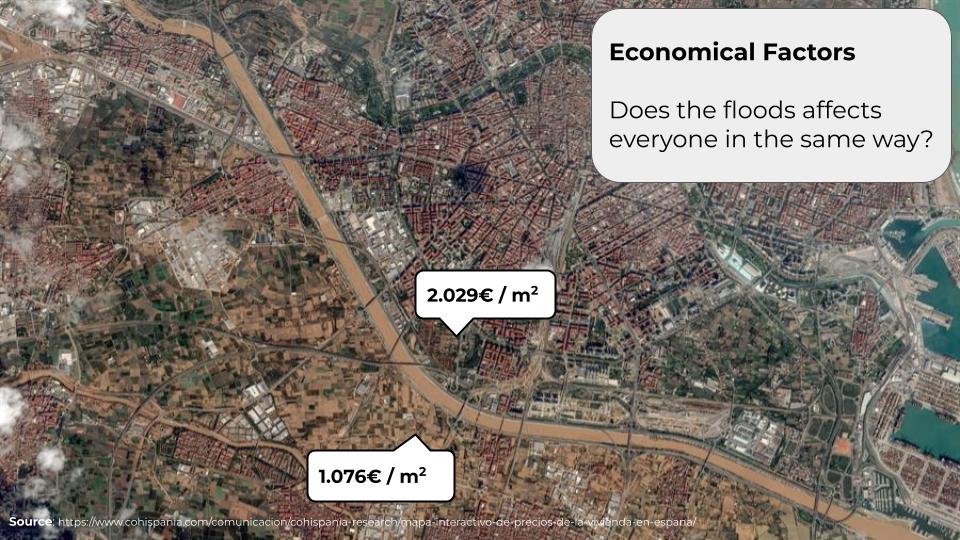
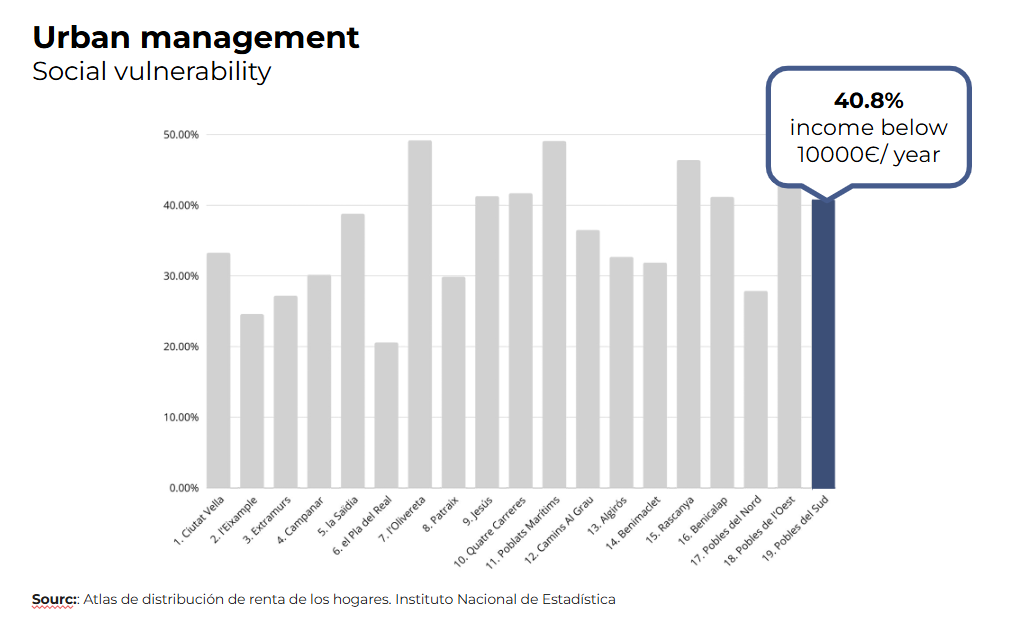
Not surprising to see how the power dynamics are seen in the socioeconomic distribution around the city. The flooded area is cheaper than the not flooded, which makes the people who are already vulnerable even more vulnerable.
Physical Factors
In order to achieve the main question of this research, first we had to understand why Valencia got flood. For that we analyzed six different indicators: Topography, Catchments areas, Rainfall, Drainage network, Flooding Hazard and Land use and cover. The interpretation of those as a system allows to comprehend how flooding happens, and which factors are involved.
Topography
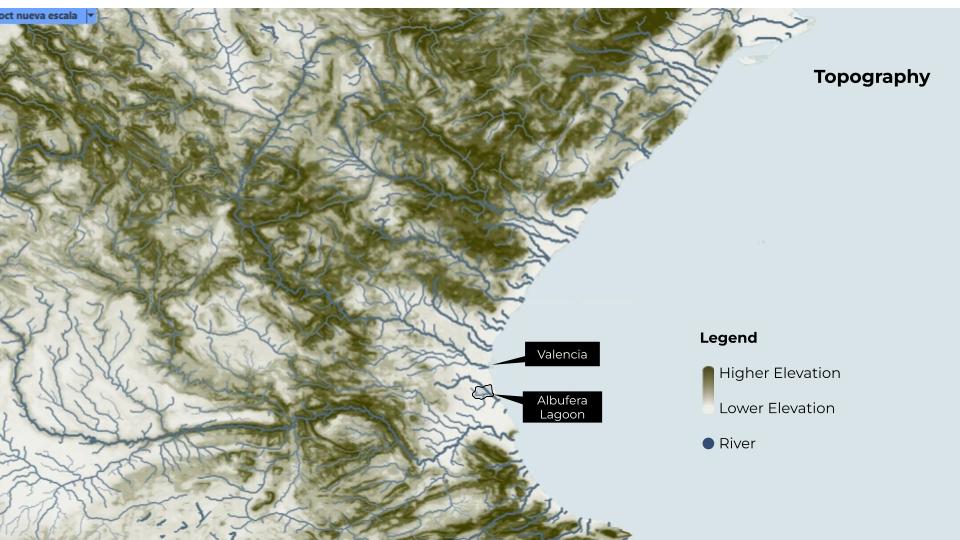
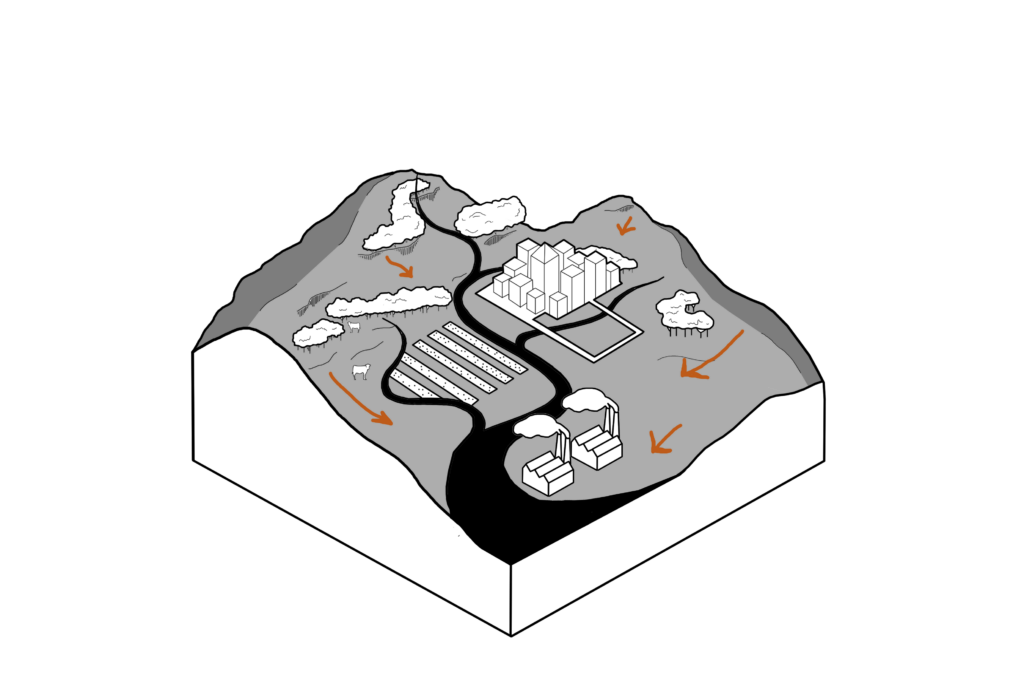
Topography plays a crucial role in flooding, influencing both surface runoff and infiltration rates. Steep or high slopes tend to result in rapid runoff of rainwater due to their higher velocity. In contrast, flat or low slopes are more susceptible to rapid ponding or flooding and have higher infiltration rates. The steeper the slope the higher the risk as the infiltration rate is considerably lower, Ray, S. K. (2024).
Catchments areas
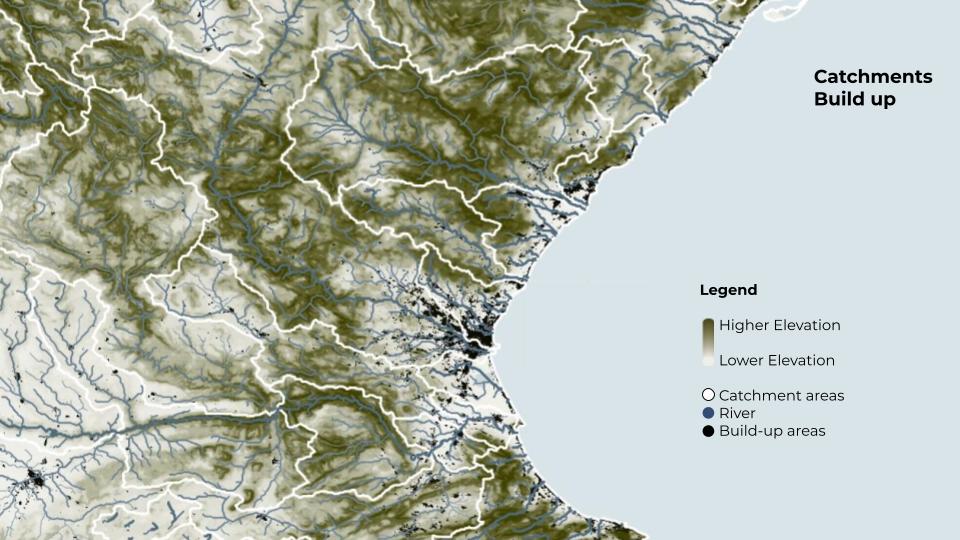

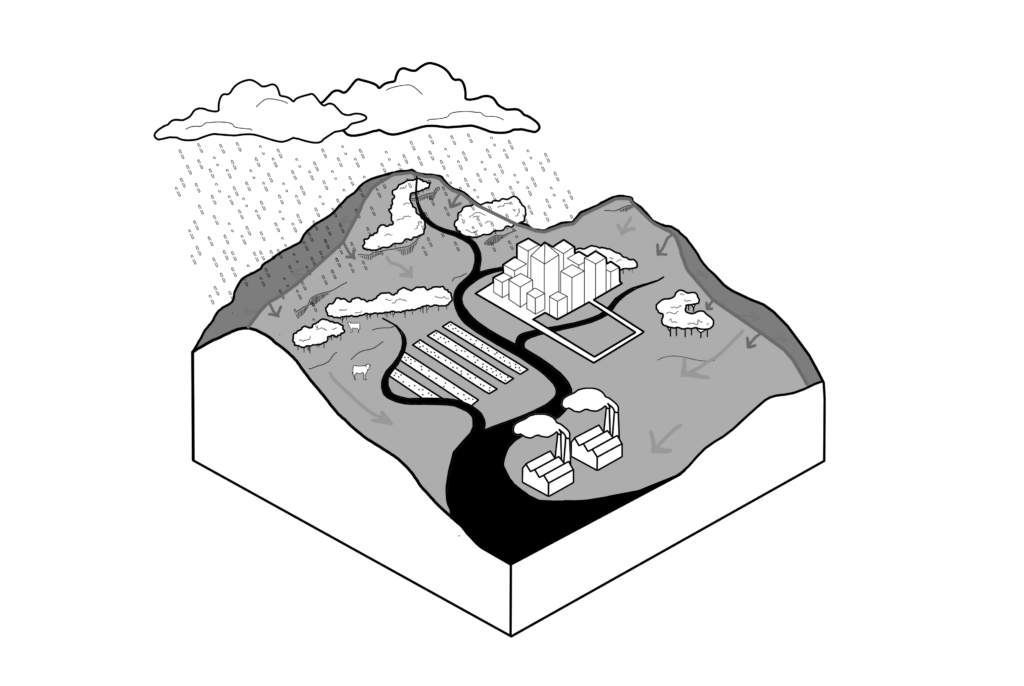
A catchment is a basin defined by the topography, bounded by natural features such as hills or mountains. The rainwater is collect it by the catchment area and flows into streams, rivers and wetlands inside it. If it rains on a hilltop, some of the rainwater will flow into one catchment and some into neighboring catchments. In the left picture we can see that Valencia is receiving water from three different catchments.
Rainfall
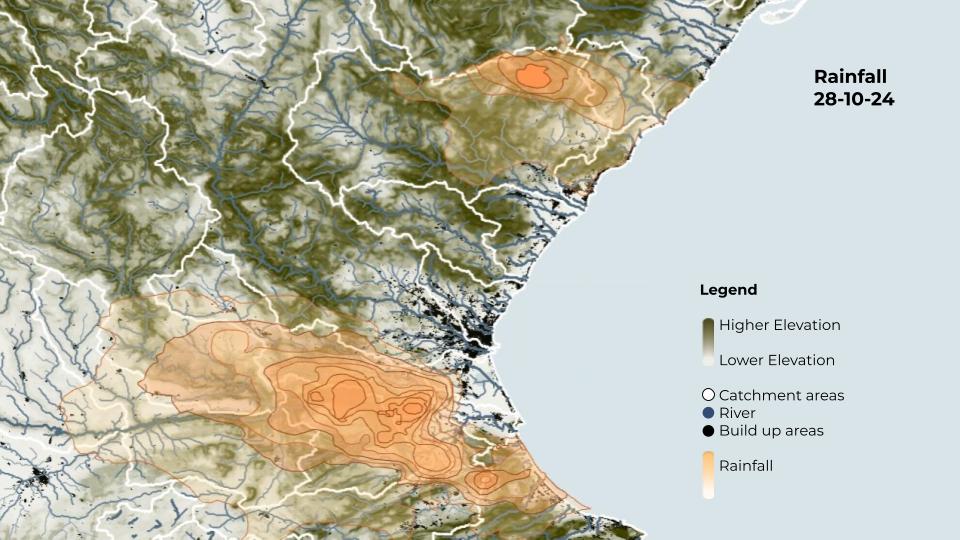
In the image on the left, we can observe that the first rainfall episode was on the south of the city. The rainwater of 28 was collected by one of the catchments that arrives to the city.
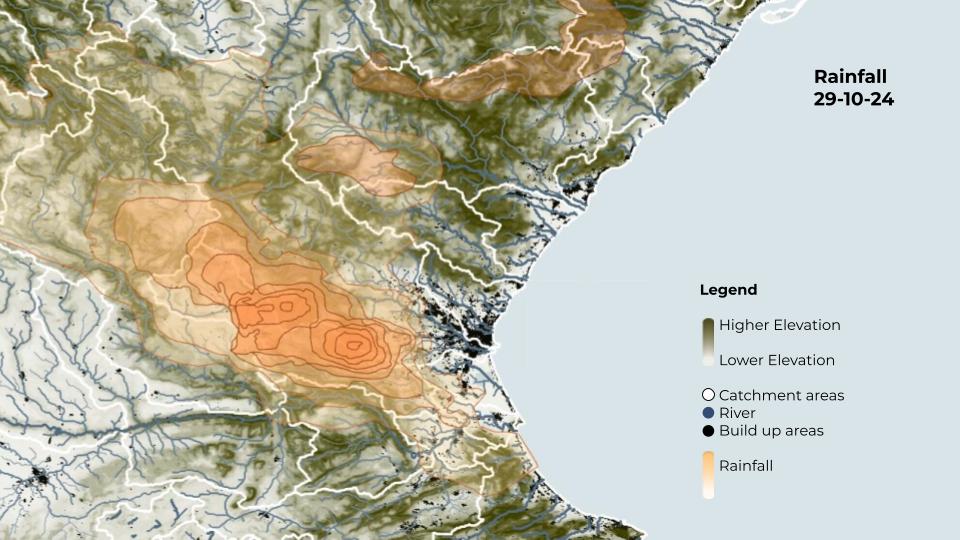
In the image below, we can see how the heavy rainfall of the 29th moves westwards, over the main Valencia catchments.
Drainage Network
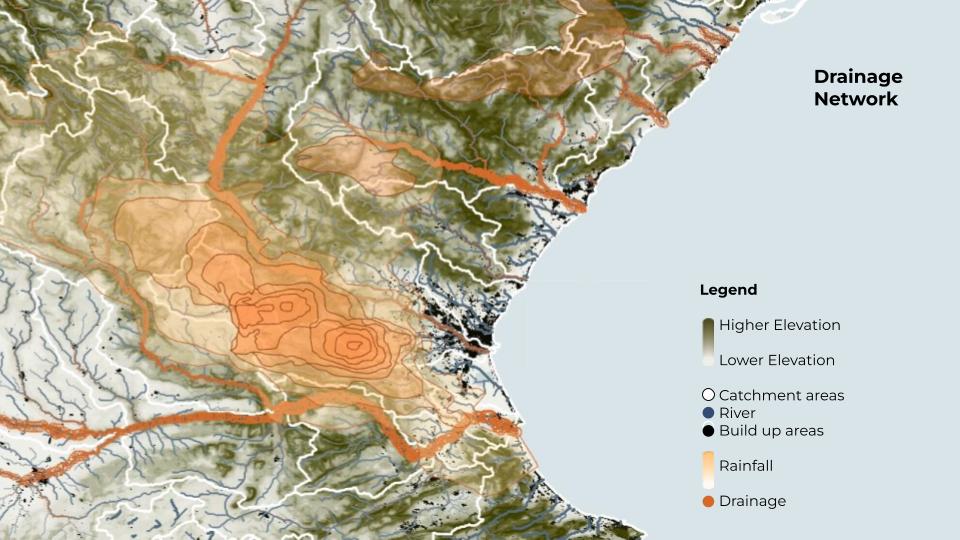
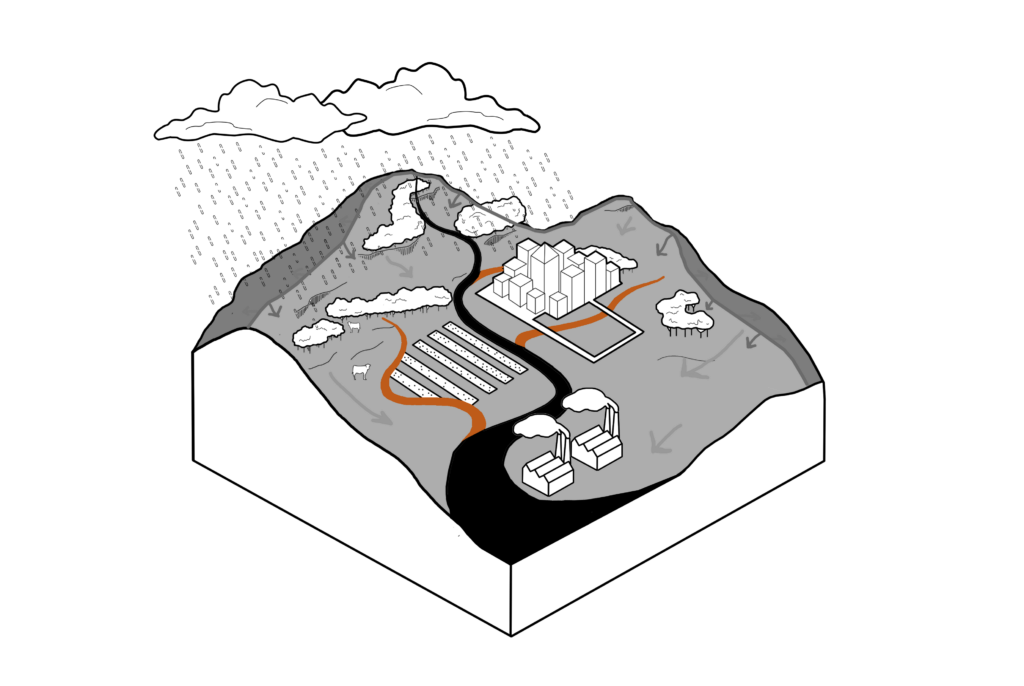
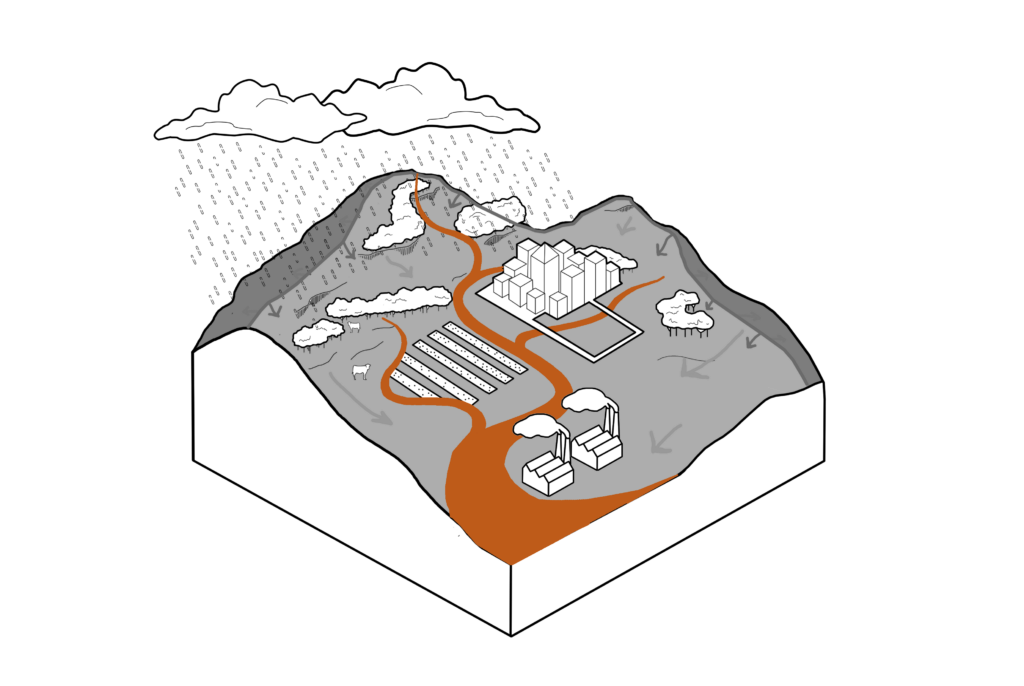
When it rains, water collects in the lowest part of its catchment area, but it doesn’t mean that it will just stay in its area. The system of streams that transport the water from a catchment area are called drainage network. There are to kinds of streams: the tributary, which are the ones that start collecting water and are thinner; and the main, which collect all the tributary, and become one (WRC, New Zeeland Government).
In the image above, we can see how the rainwater flows into the main drainage network “discharge” it on Valencia city and Valencia’s lagoon.
Flood Hazard
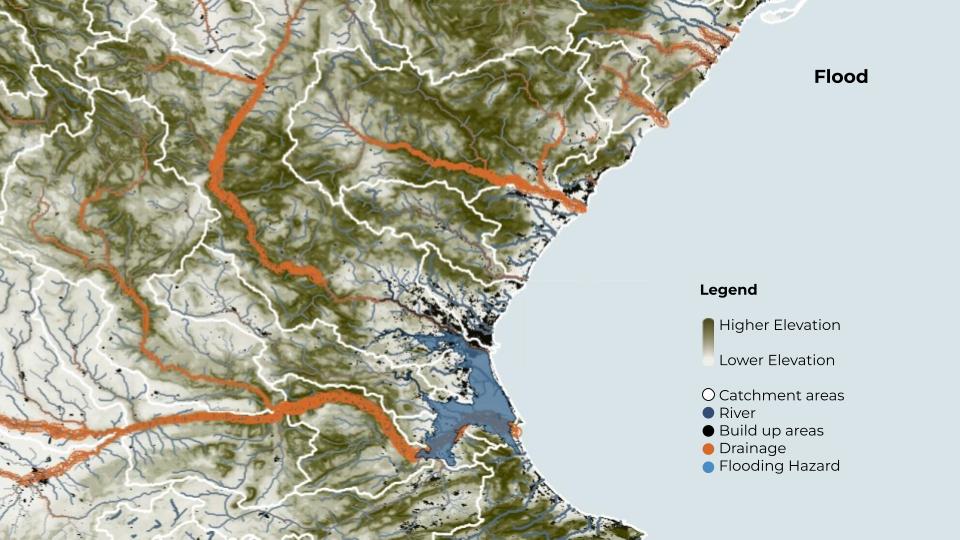
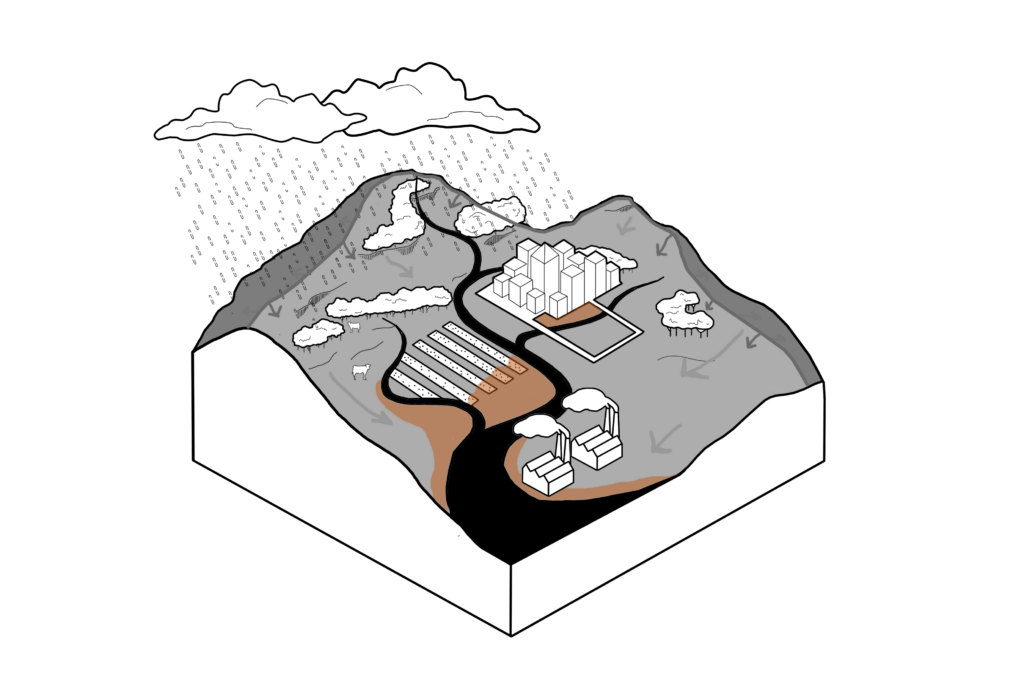
What happens then is that when the drainage networks discharges close to a city and the river is “limited” to certain thickness it will overflow aggressively on the urbanized area.
Land use and land cover
Once we know how the water flow, is important to take a deep look in how the water is absorbed. For that we develop a Land uses and covers categories, in order to understand what happens when it’s rains on a natural surface. Does all the water is absorbed? are all the green areas absorbent?
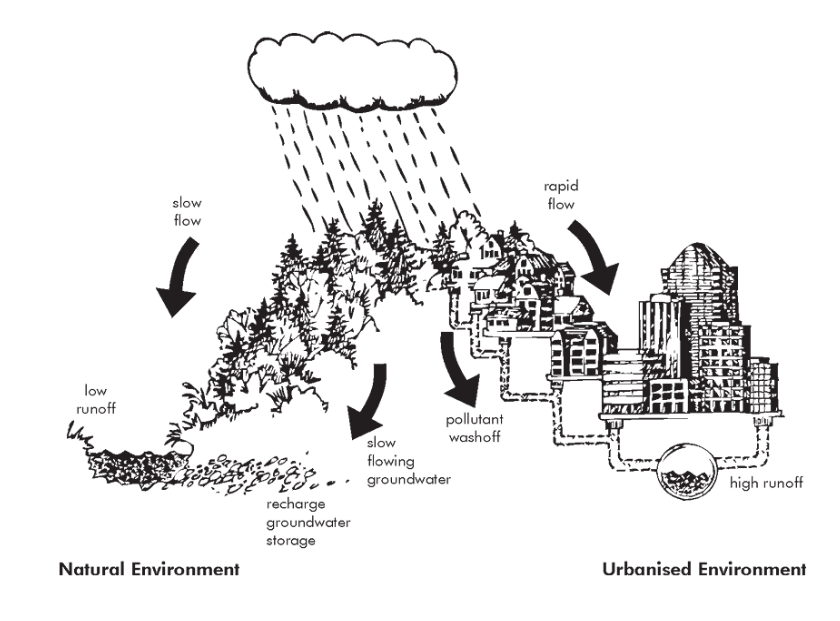
In the image on the left we can see that depending where the rainwater flow, the absorption will be significantly different. If the rains fall in a natural environment the water flow and runoff will be slower. But if its rains fall in an urbanized environment the water flow will be rapid and the runoff high. Depending on state of the human made drainage network, may collapse and cause flooding.
The vegetation on the catchment area, have a key role on how many water is not absorbed and simply runs.
In this research we classified the land type and vegetation into 5 categories Forest, Barren, Agricultural, Water Bodies, and Built-up. And we assigned each one a percentage of absorption, Ray, S. K. (2024). In order to know which areas are more absorbent.
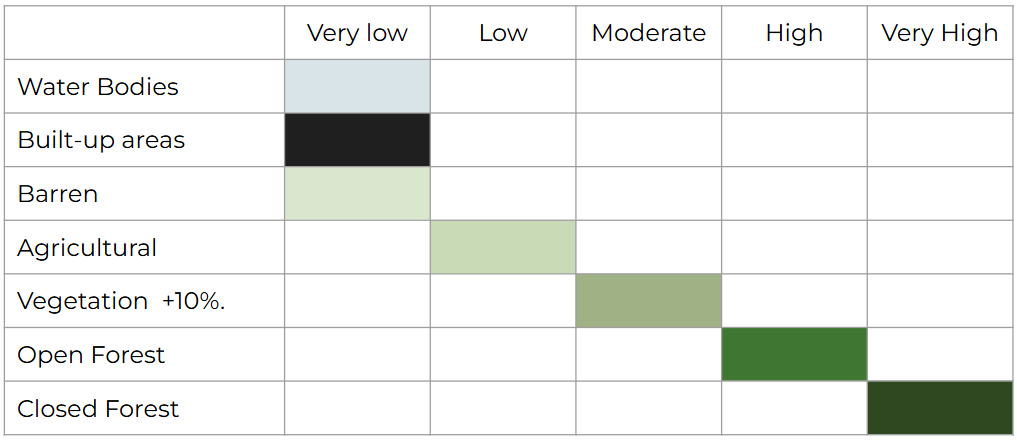
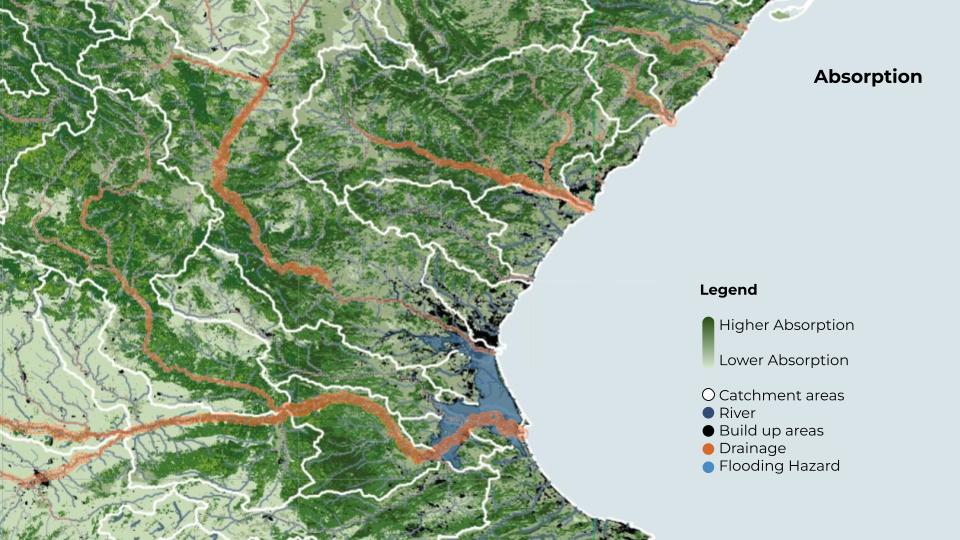
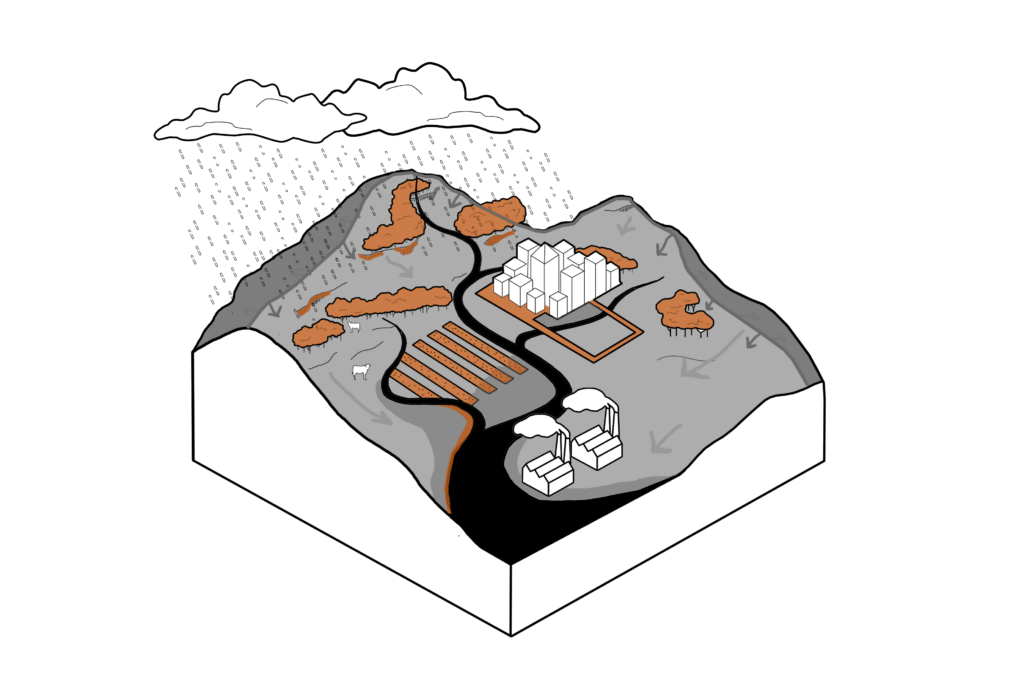
Here we can see that absorption in Valencia’s drainage networks is very variable. Mostly it’s depends on where it rains: if it rains on the catchment area where the drainage network has lower absorption, increase the possibility to get flood.
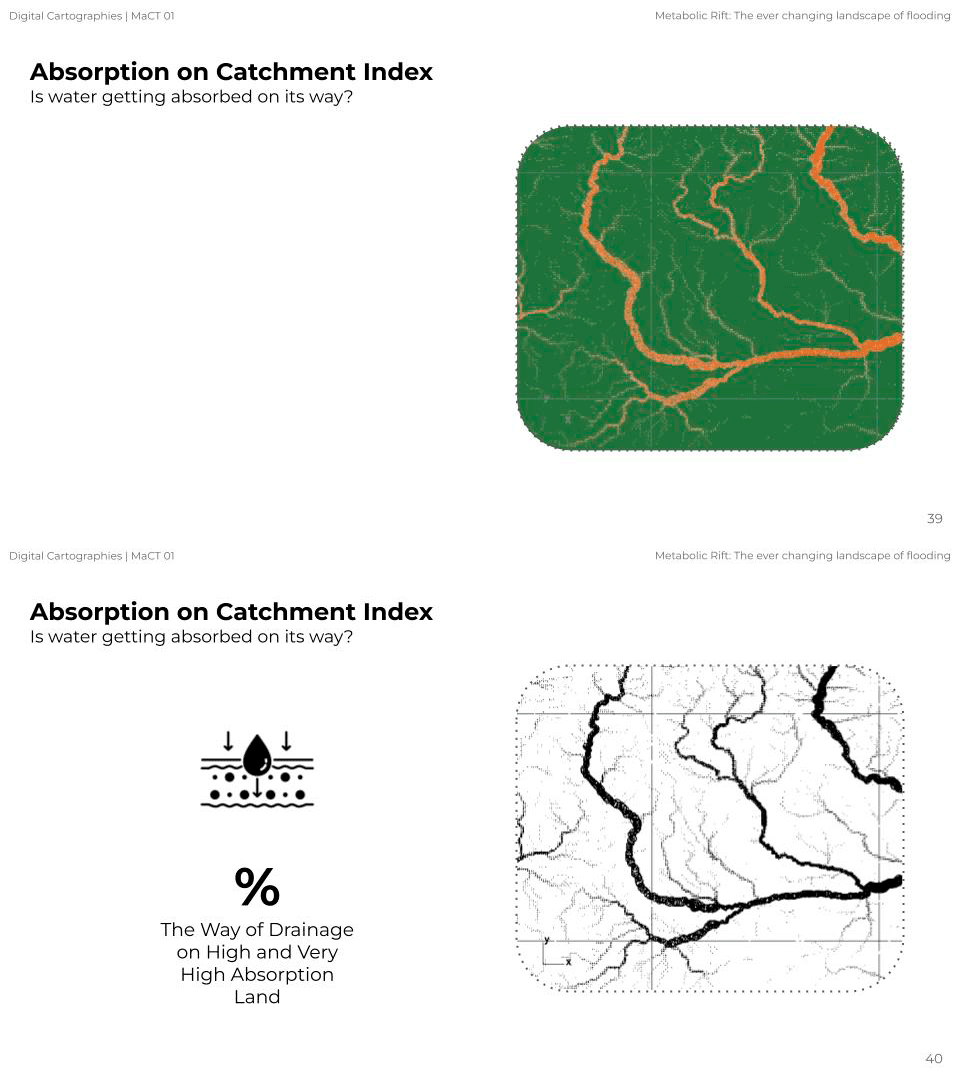
In order to be able to replicate these indicators in the next stage, it was essential to develop an index that would allow us to know the percentage of absorption of each drainage network located in each catchment area. For this index, using Python, on the one hand the surface area of the drains located in the catchment area of each city, on the other we grouped the indicators of high and very-high absorption, and finally we extracted the area of intersection between the two indicators, to come up with the index.
What other cities are prone to flooding from DANA?
Replicability and Indexes
Having identified the various external factors that place a city at risk of flooding and having analysed those that predispose cities to flooding, we are now in a position to answer the question that has motivated this work: Could the Valencian Dana rains occur in other areas?
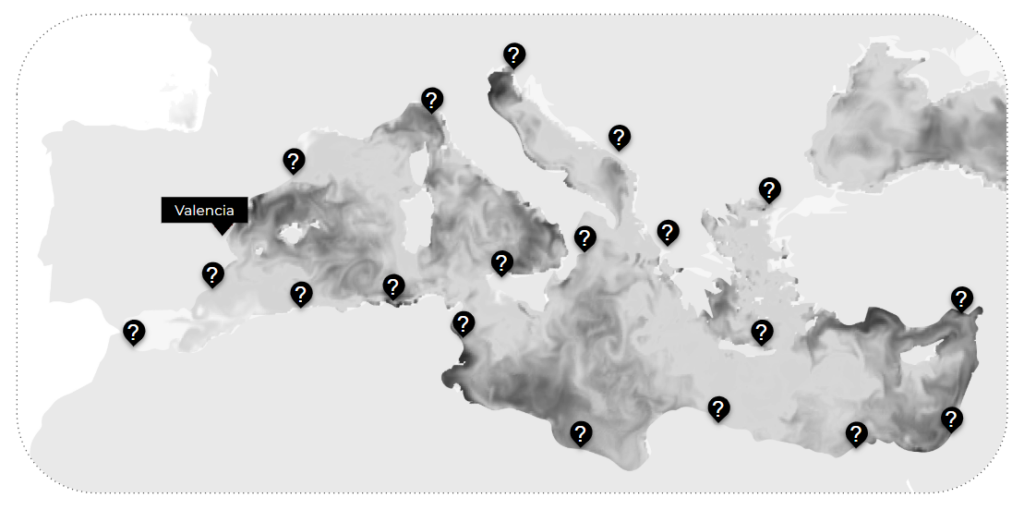
As we know up to here, DANA is Mediterranean phenomenon, so we will focus just on the cities that are on this area and have similar features that Valencia in order to compare them.
For the replicability we used three different filters, to have the cities with higher risk to have a DANA rains and get flood.
Filter 1
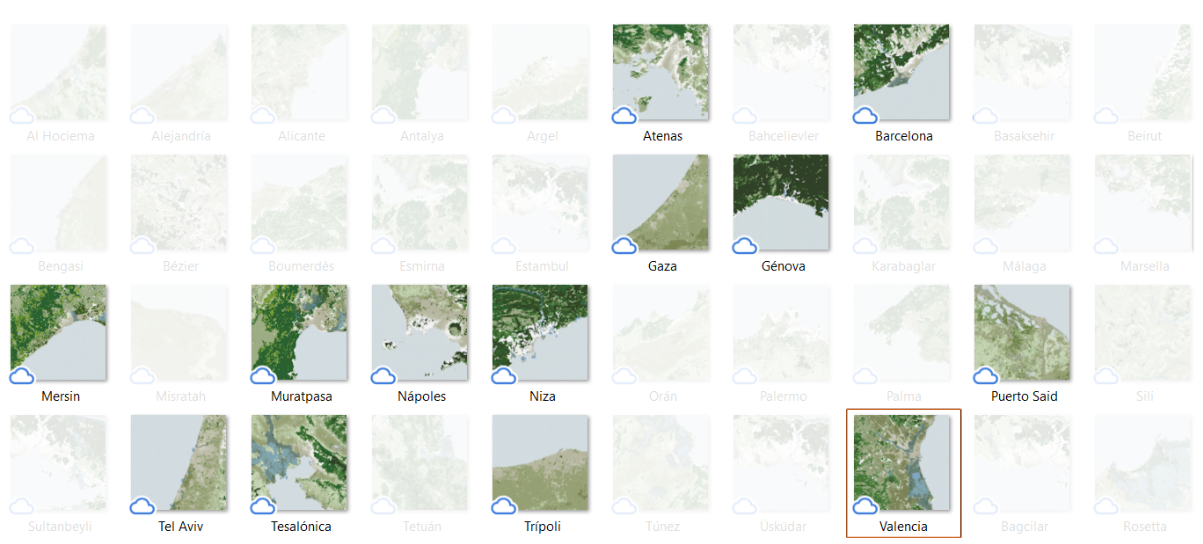
For this filter we select all the Metropolitan cities as Valencia, that mean cities that have more than 300 000 inhabitants, and that they are bordering the Mediterranean Sea. The output of the first filter was 40 cities.

Filter 2
From the filter before (bottom left image), we selected the ones that are located in the warmer areas of the Mediterranean Sea, above 22,8°C which was Valencia’s Sea temperature on average on October 2024 (bottom right image)
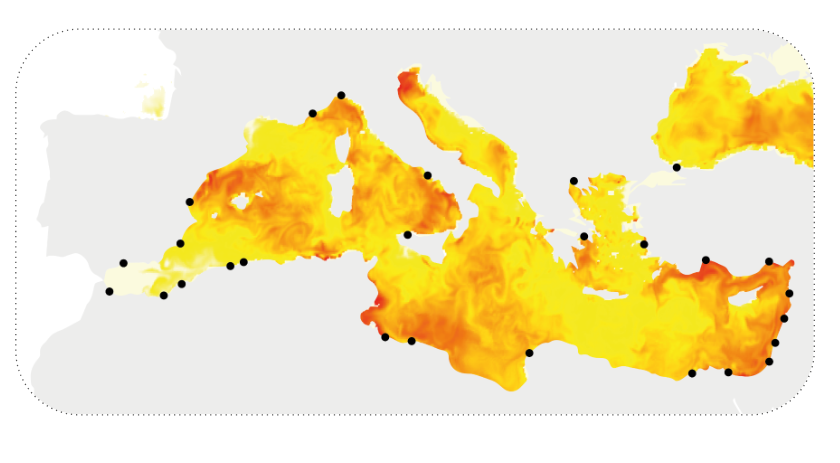
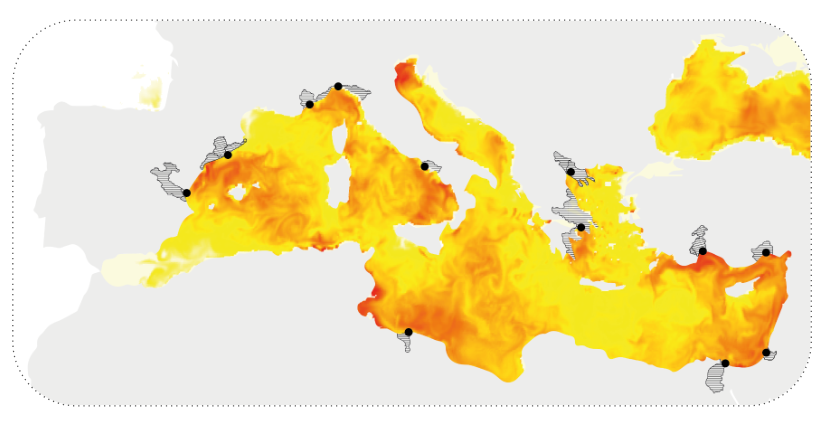
For the second output we had 13 cities
Filter 3
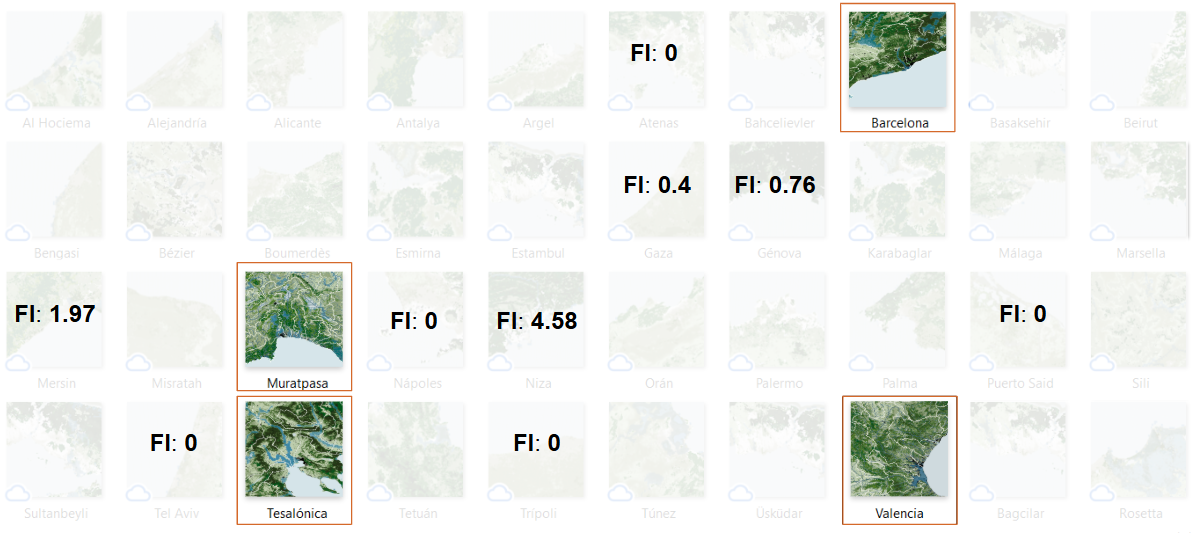
For the final filter, we based on the google earth engine flooding projection to know which of the 13 cities has flooding risk.
Its important to highlight that the predictions made by Google are based in other kind of analysis and does not take into consideration the same indicators we used for this work.
The final output of the three filters, come up with the four cities more prone to flooding: Thessalonica FI: 17.67, Valencia FI: 13.10, Muratpasa FI: 6.38 and Barcelona FI: 4.92.
What other cities are prone to flooding from DANA?
Final Results
For each of the filtered cities we develop three different index: absorption in the catchment areas, absorption in the drainage network and flooding in the catchment For the first index we convert the categories we develop for the land use into percentage of absorption and compare them with the surface of the catchment area. For the second, we did a similar process, but only using the high and very high absorption and compare them with the surface on the drainage corresponding to the catchments. Finally, for the flooding, based on the GEE prediction we compare both surface flooding and catchment. This process was possible by using Python.
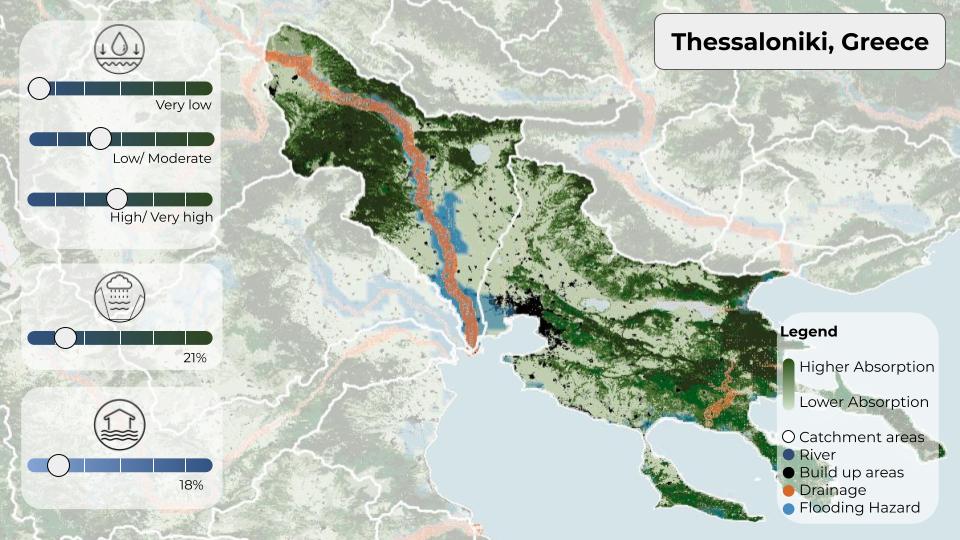
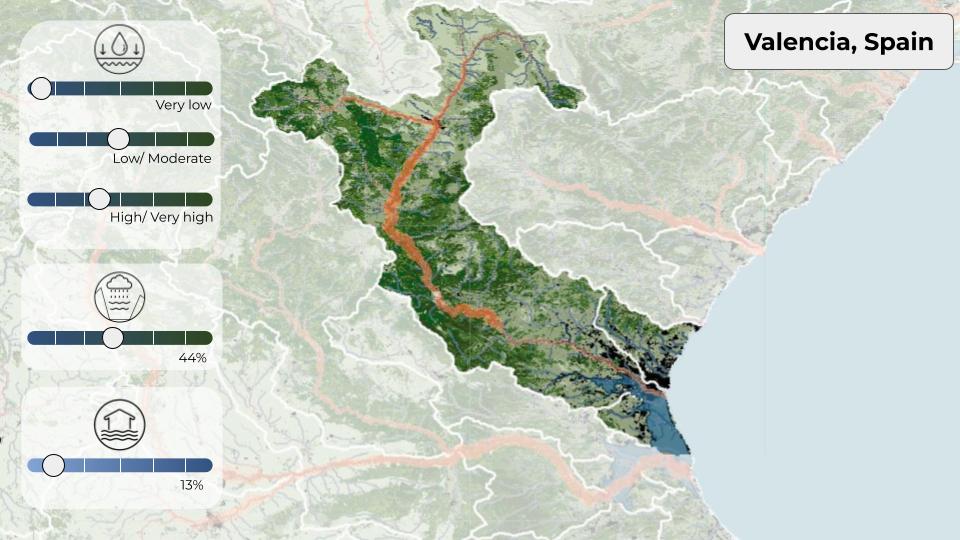
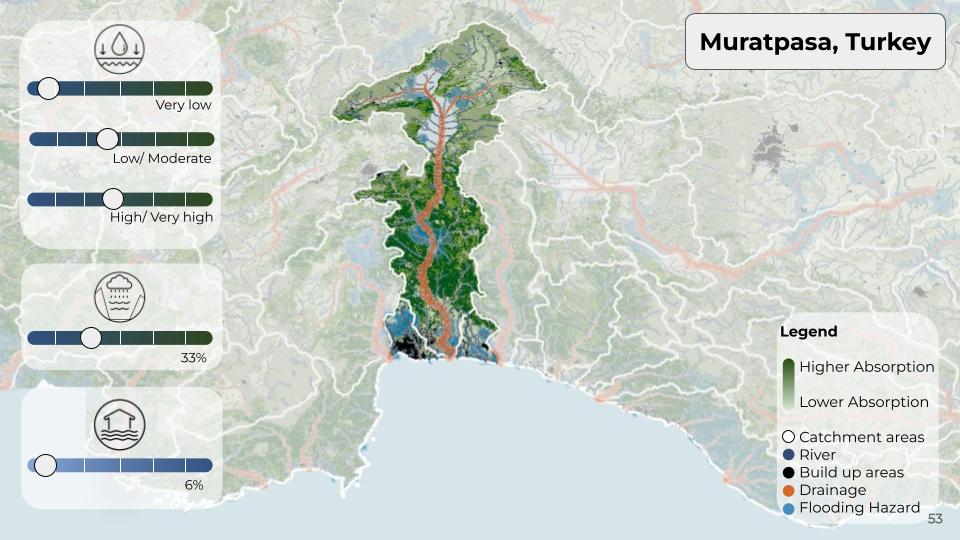
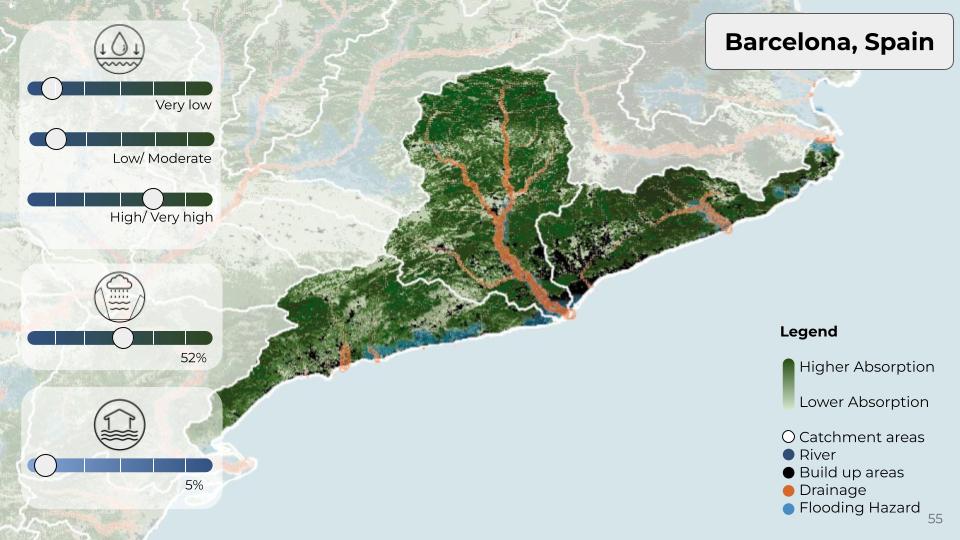
From those cities we can conclude that the ones that have higher risk of flooding, had the lower index of absorption in the catchment area

