
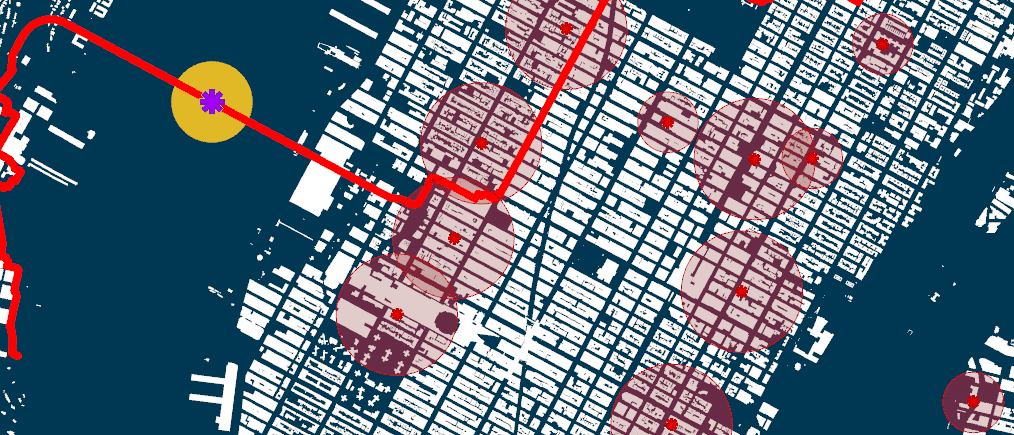
The aim of the project is to map the sky visibility in New York City as one walks from one public park to another with an added analysis layer of Heat Vulnerability Index (HVI) to neighbourhoods.
HVI is an index of the likelihood of someone from a neighbourhood to die due to excessive heat exposure, which is in direct correlation to open sky visibility which leads to the heat Island effect.
Pseudocode
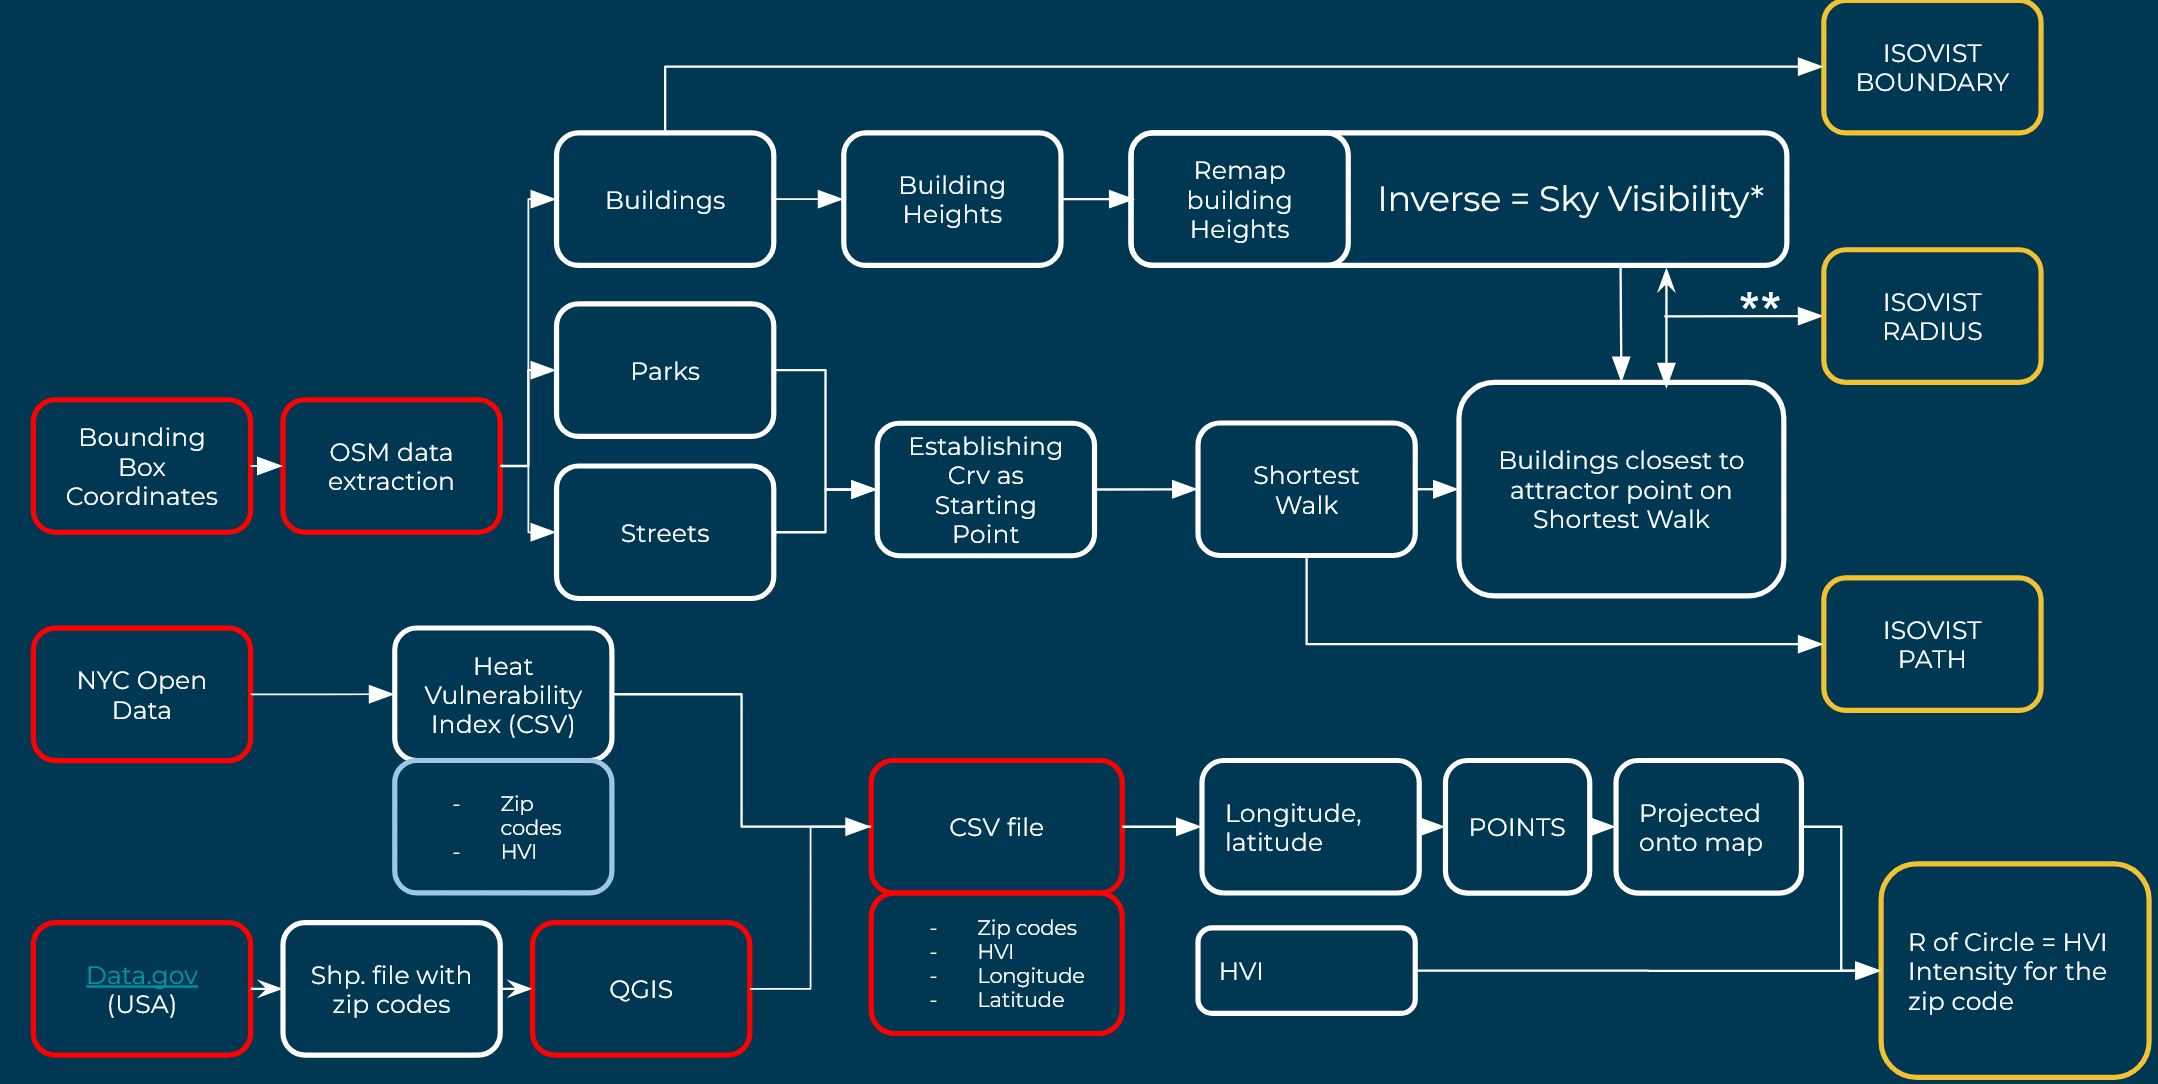
* In a 2D orthogonal view of a city what is not a building is sky and so with respect to mapping visibility the inverse of the building footprint and height of the building is sky
** The visibility radius of the isovist is a function of average heights of the buildings closest to the position of the viewer on the shortest path from one park to another
Data Sources
- OSM
- QGIS
- https://data.cityofnewyork.us/Health/Heat-Vulnerability-Index-Rankings/4mhf-duep/about_data
- https://catalog.data.gov/dataset/2020-cartographic-boundary-file-kml-2020-zip-code-tabulation-areas-for-united-states-1-500000/resource/fc6e1ebf-0813-482e-8df8-a74df98e0fca
- Open AI to develop a CSV file that correlates Zip codes from (3) to geo-coordinates from (4)- uploaded to drive
