
Aim
The project was aimed to develop a methodology to detect damages in walls with the help of Yolo’s trained models furthering to gain the quantitative and economic analysis of the development any project.
Workflow
Initially, we conducted a site scan using an RGB camera of Dji drone the site was mapped section by section to extrapolate the data, capturing data from the images. This data was then analyzed in Agisoft to generate a comprehensive overview. Concurrently, we utilized Roboflow to train our model with 86 diverse images, categorizing them into classes such as damages, holes, and people.
This training enabled us to obtain YOLO outputs, accurately identifying specified classes. Subsequently, we applied interpolation techniques to the datasets to pinpoint damaged areas within the point cloud. Following this, we analyzed the point cloud data to calculate the respective areas, yielding precise measurements.

Scanning and Data Collection
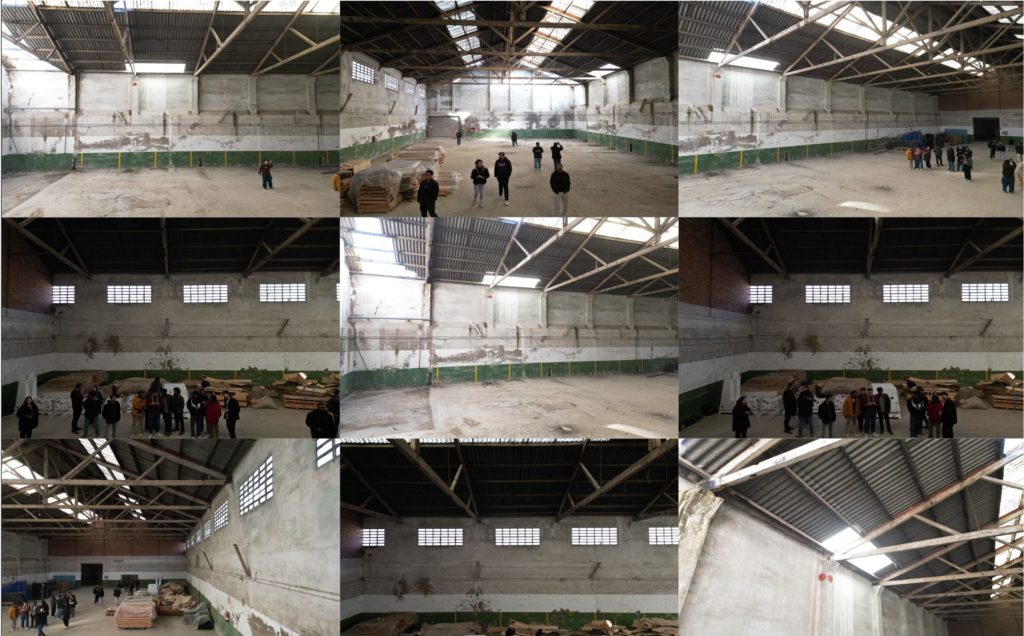
Figure 1 : IAAC’s new building, we scanned the inside environment using our phones and drones to capture multiple aspects of the building. Picking up a plethora of angles we were able to map features upon a map.
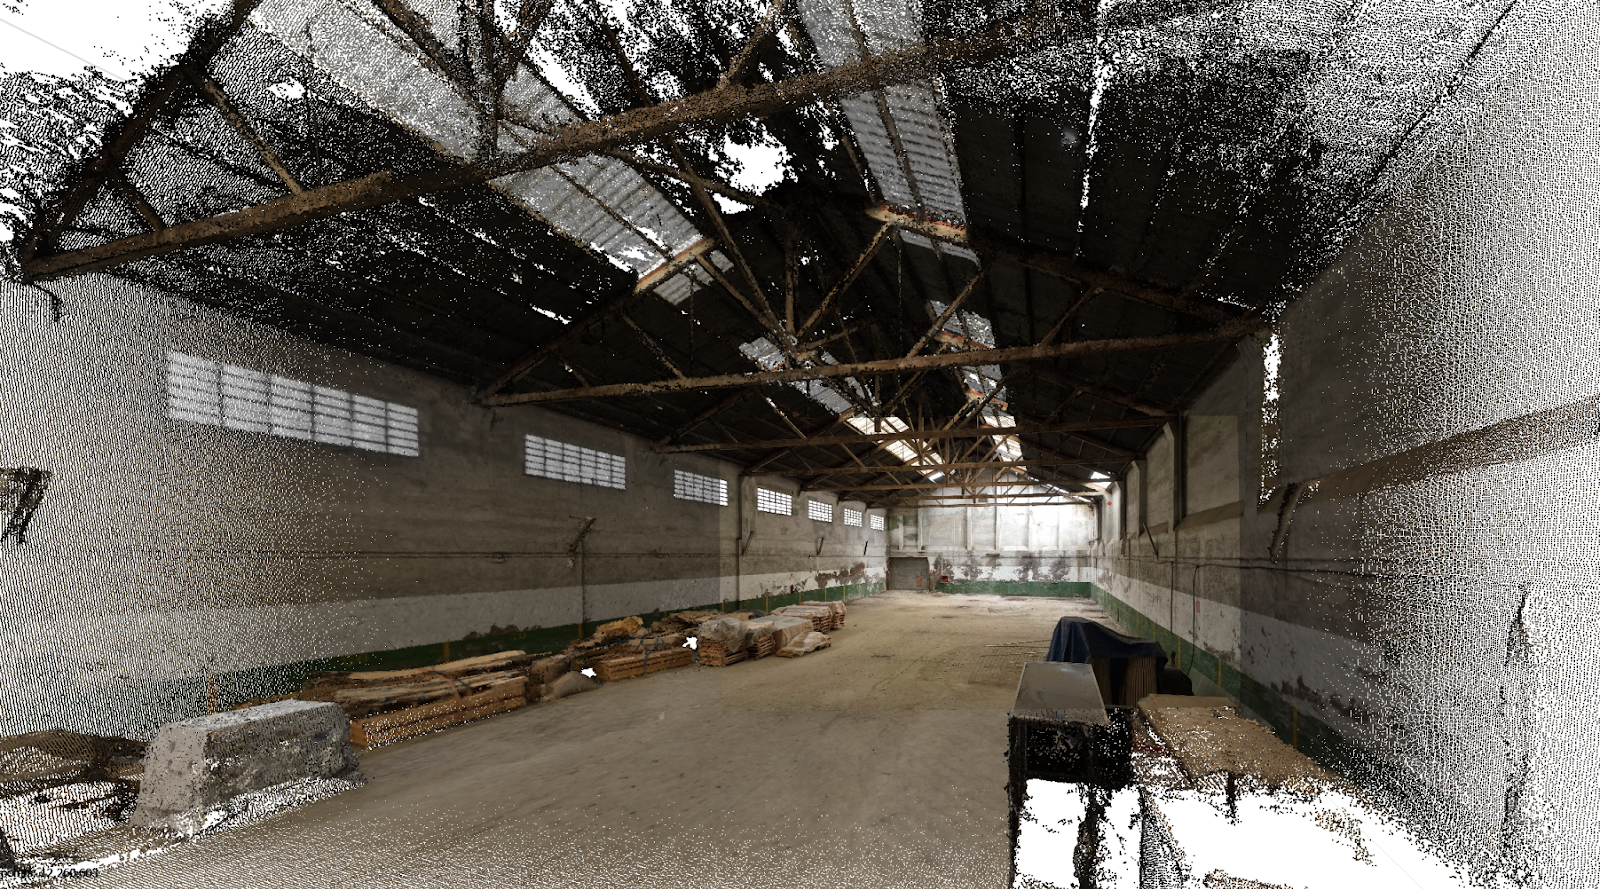
Figure 2 : Point cloud was generated with the help of Agishoft MetaShape with the help of. the above image shows how a single image has been successfully mapped in the pointcloud.
Analyse Data

Figure 3 : Analyzing the point cloud with the help of Agisoft Meta Shape on the basis dense cloud confidence the data is filtered.
Classes and Model Training
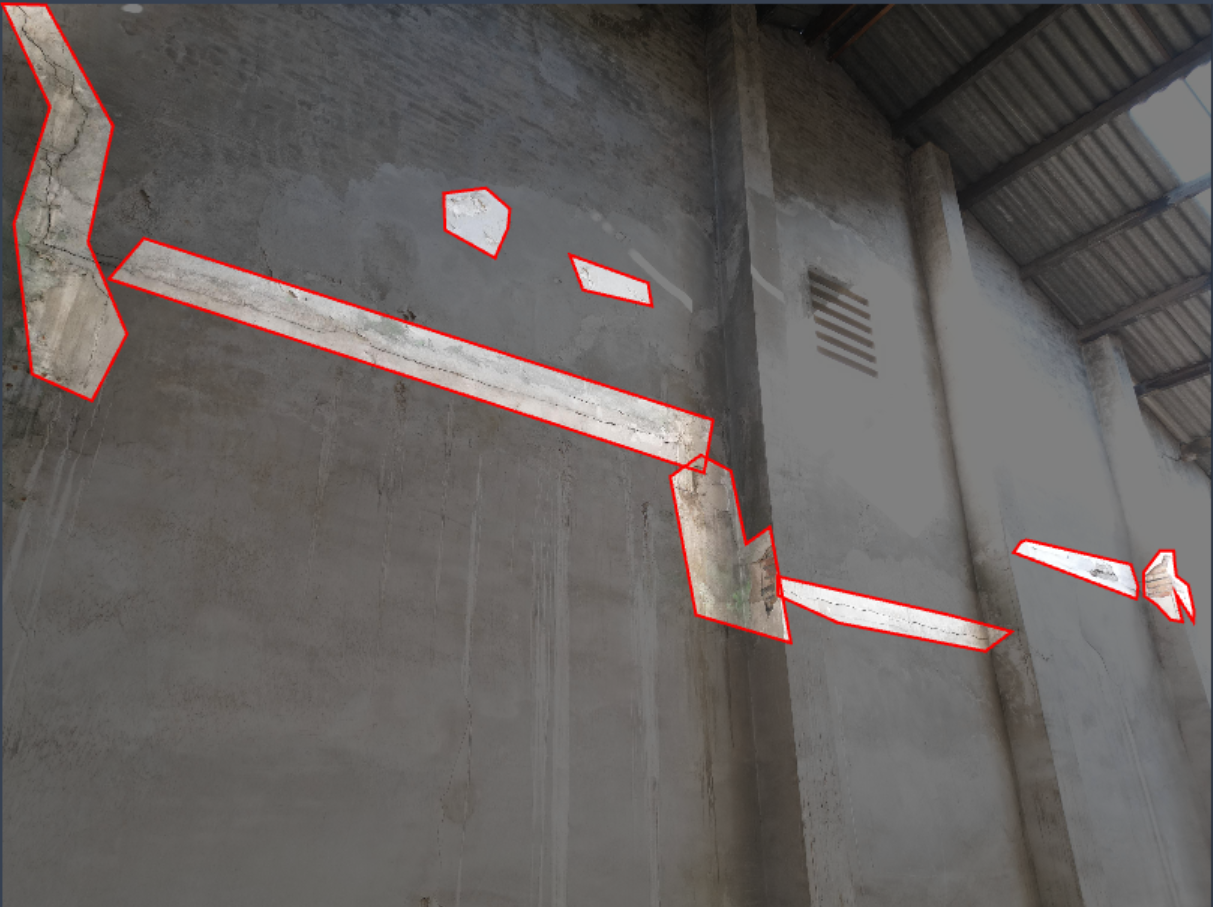
Figure 4: Some images where selected for outlining it is specified to different classes for further training the model

Figure 5: Differentiating classes were created for the model to train and detect different classes objects. 1. damages (red) 2. people (people)
Figure 5 :
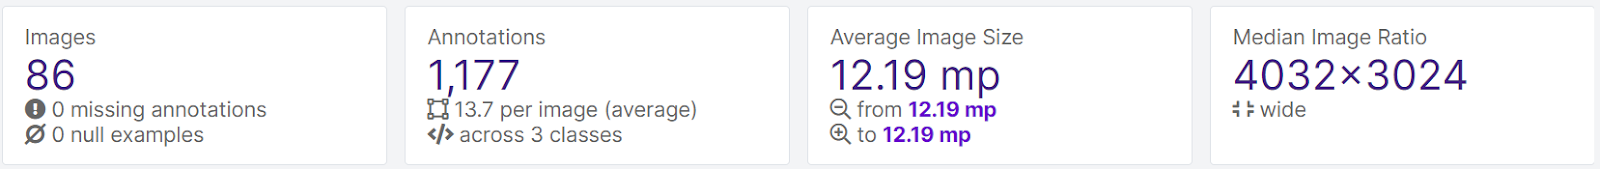
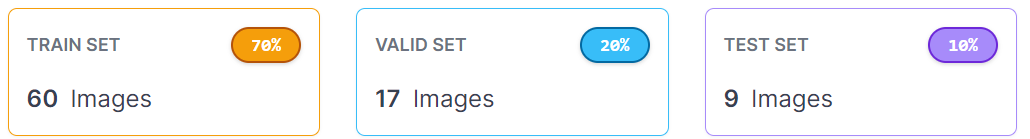

Figure 6: This is the result of the trained images which were ranked according to their detections. After outlining the classes and training the model, we can see the output from the training.
Ai Filtering
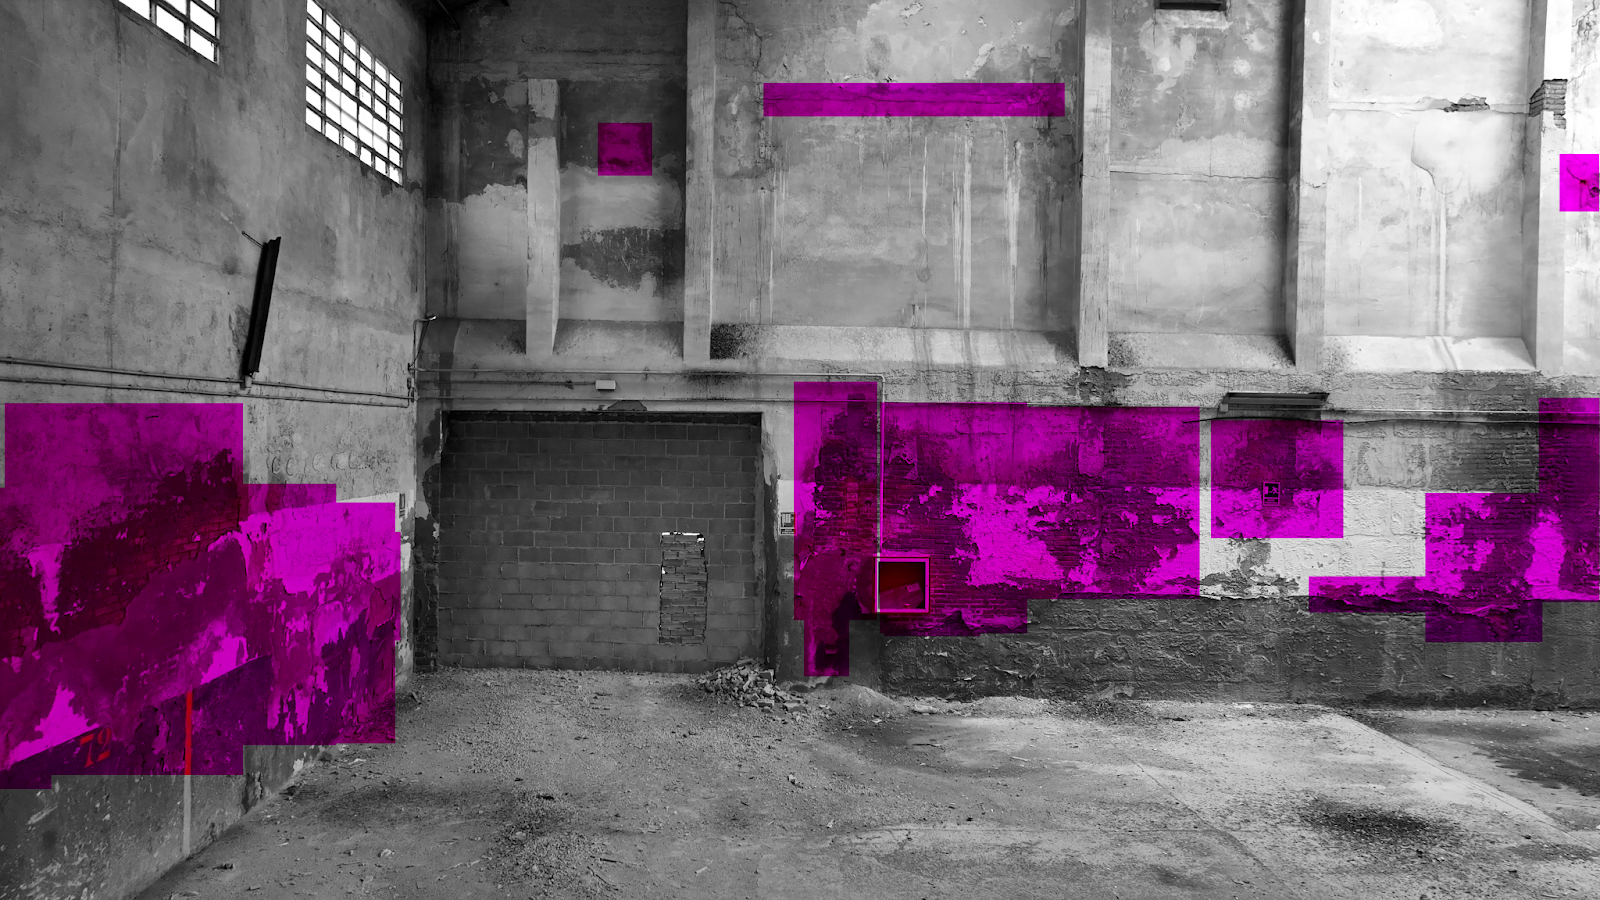
Figure 7: After the training the model is then processed all our base mapping images we can see the classes across each on all images.

Figure 8: This images were further processed to the pointcloud to generate the pointcloud of the detect the damage class in the project.
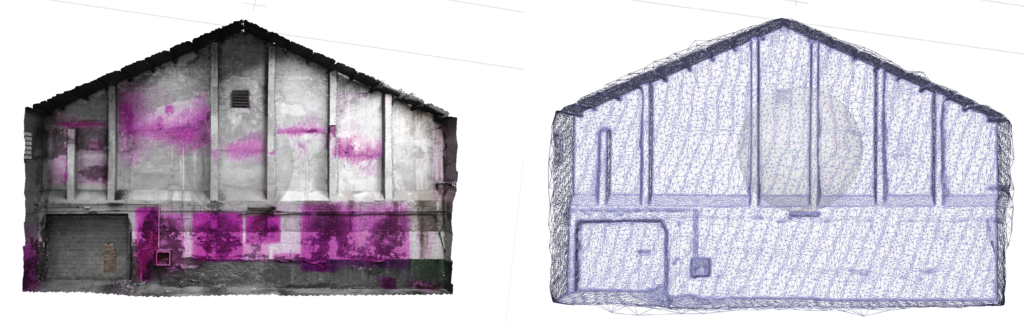
Figure 9: The point cloud model was split into orthographic projections with the help of markers to develop the orthographic mosaic for further analysis.
Estimating areas

Figure 10: This image shows the final area calculation developed to calculate the area of Damaged sections and their respective areas .
