
Used in this project:
Main: Rhino3D, Grasshopper3D,
Grasshopper Plugins: Wasp, Elk, Ladybug
3D Context: OpenStreetMaps / Geofabrik
Maps: policymap.com, strava heatmaps, Urban3, Connect Dallas (2021),
2011 Dallas Bike Plan, American Enterprise Institute (AEI) aei.org
State of the Art Precedents: Block’hood by Jose Sanchez, Habitat 67′ by Moshe Safdie, VM by BIG + JDS
Introduction
Our project is located in Dallas, TX, a metropolitan area of 7.7 million people that is expected to rise to 17 million by 2050. Dallas, like many American cities, is auto-centric. This urban model puts its citizens at risk in several different ways. Texas’ own Department of Transportation reported that “Texas drivers put out more carbon dioxide than every train in the world combined,” a reported 0.48% of global carbon emissions. And then there are the problems of health and safety. “Dallas has the second worst traffic fatality rate in the country,” according to a headline in D Magazine.
Excessive road infrastructure is costly to pay for. Expansion of the Dallas-Fort Worth area most often occurs on the outside of the metropolitan area where it is least efficient. Many of these neighborhoods pay for their road infrastructure in unsustainable ways, such as selling bonds that are akin to putting the bills they cannot afford on their credit card. A study on the North American city by thecostofsprawl.com found that auto-centric households cost their city $3,462 annually, whereas more urban households cost $1,416 annually. Those figures mean that the city of Dallas could spend either $5 bn or $2 bn per year on city services depending on the choices that it makes. Last year, the city spent $4.3 bn due to the high ratio of inefficient households. Those homeowners aren’t entirely to blame though as the city doesn’t give them much choice.
Walking around Dallas is extremely dangerous. Pedestrians are often faced with the choice to either walk an additional mile to the nearest crosswalk and another mile to get back, or to take a chance and run across the road. While many are successful, others are struck down by cars moving at high speeds. A dog owner in Dallas needs to drive their dog to a park, as walking around their own neighborhood may involve walking without sidewalks. Additionally, those wanting to cycle should probably drive their bike to a park.
The problem our project aims to tackle is that the option to live without a car isn’t available to 98% of the population in Dallas.
One mistake that cities have often made in the past is assuming that there are two types of cyclists: experienced and inexperienced. Roger Geller wrote “The Four Types of Cyclists” in 2006, dividing people into four persona types based on their safety profile:
- Strong & Fearless: <1%
- Enthused & Confident: 7%
- Interested but Concerned; 60%
- No Way, No How; 33%
In Dallas, people who are interested but concerned are limited to cycling on bike trails. We took inspiration from the name of raDAR where DAR stands for detection and ranging and soNAR where NAR stands for navigation and ranging. We created a system called PAR as program and ranging that imported all the types of programs from the nearby area and searched what specific program types were contained within a 300 m offset from the available bike trails.
We found that residents living on this site who might not want to drive would not have access to groceries, a bank, or a post office. They do, however, have access to schools, churches, tattoo parlors, restaurants, bars, and jobs. So if we want residents in the bike trail to have a choice in giving up their car all together, this site needs a new supermarket, a bank, and a post office at minimum.
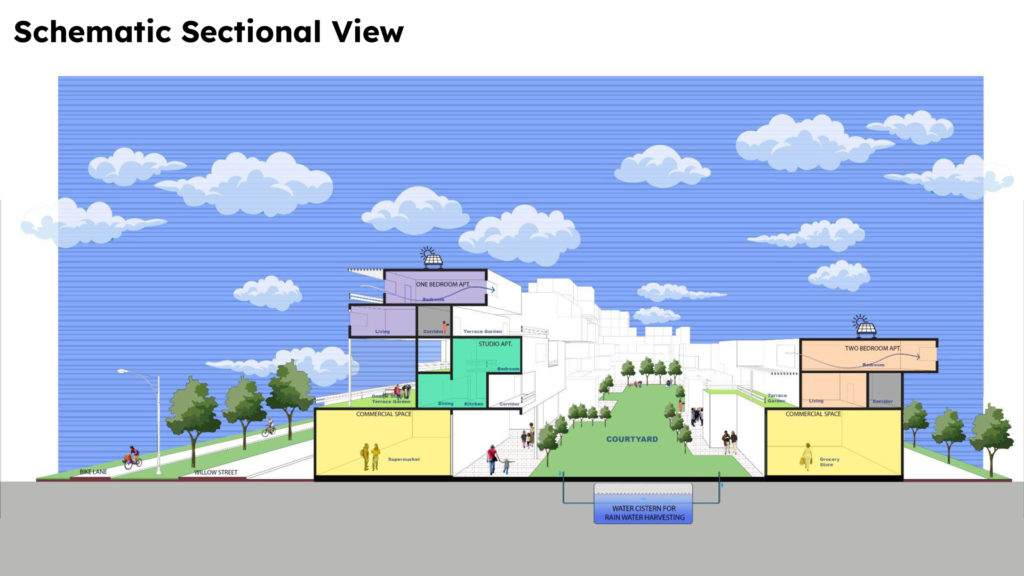
Our site is located on the Santa Fe Bike trail between the commercial area to the west and the residential area to the east.
First Wasp Aggregation
We were influenced by the ratio between volume to surface area that can be smooth and spherical to reduce heat loss, as done by an igloo and by the Gherkin designed by Foster and Partners. It can also be spikey and differentiated to increase heat loss in hot climates, as done by the cactus. It is also how heat sinks attached to CPU cores work. We thought that a stochastic aggregation could help generate this complex form for us.
The challenge from our first attempts was how to control this aggregation, as using proximity3D after the aggregation proved challenging.
Mesh Constraint
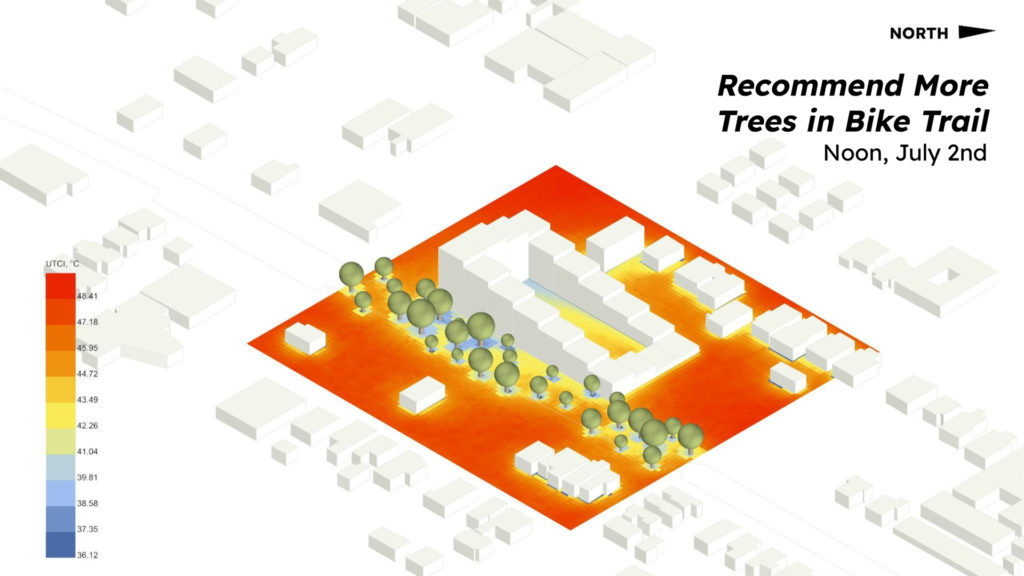
Our first form of control is a mesh constraint. This mesh took the form of a courtyard block restricting the aggregation from growing outside of its set boundary. The variant with the tallest volume on the southwest corner was selected after a solar radiation study in Ladybug found the lowest total radiation.
Thermal comfort studies showed the benefits from planting more trees in the bike trail and the success of the courtyard block at making a more comfortable exterior environment for people.
Stochastic Aggregation of Parts
A parts catalog was used with voxels of 3m x 3m x 3m that were assembled into units of residential, retail, and grocery. Each part saved its meta-information in ordered lists. These included the width of the part, the interior square meters, and the porosity.
Connections for the aggregation were aligned to the corridor circulation. The locations of the corridor could be at different positions within the block. These positions were also saved as an ordered list.
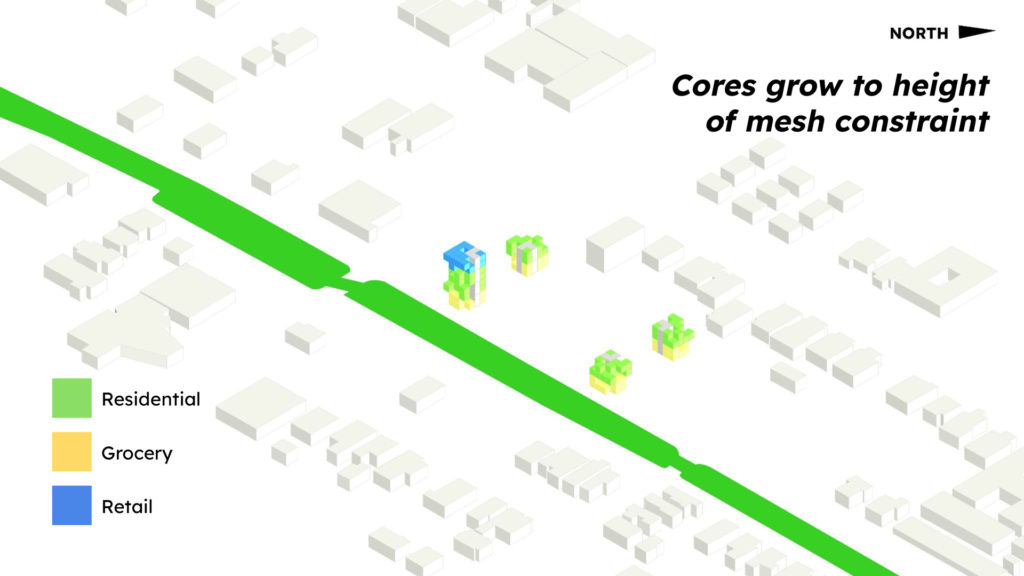
The starting positions for the aggregation are the structural cores. Each floor chooses which parts aggregate from it within the rules generator component. Cores can grow vertically as high as the mesh constraint allows them to grow. Retail only spawns where a tall enough mesh constraint allows it.
This aggregation offered a lot more control than our first attempt using the mesh constraint, parts catalog, and the various core starting positions.
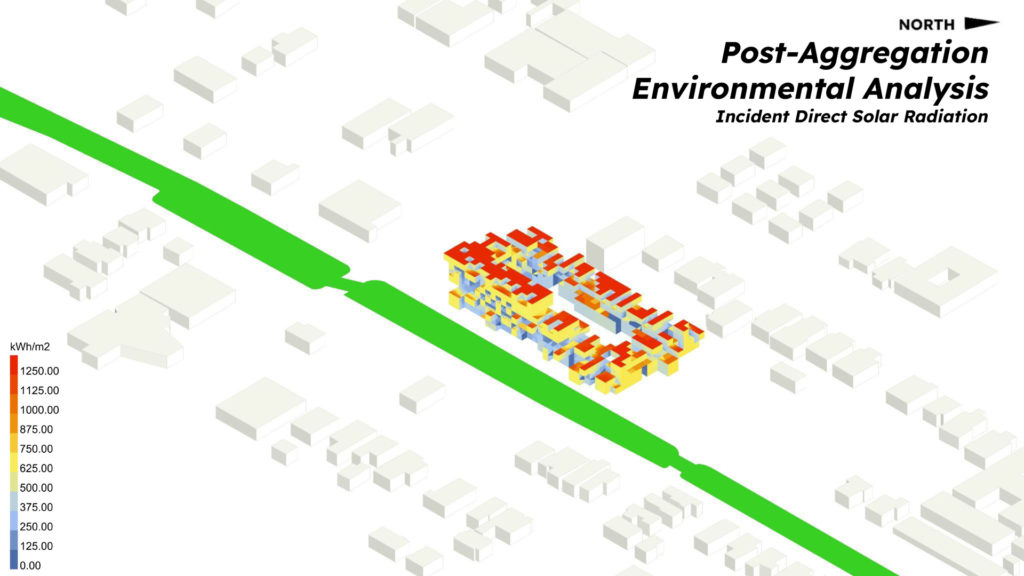
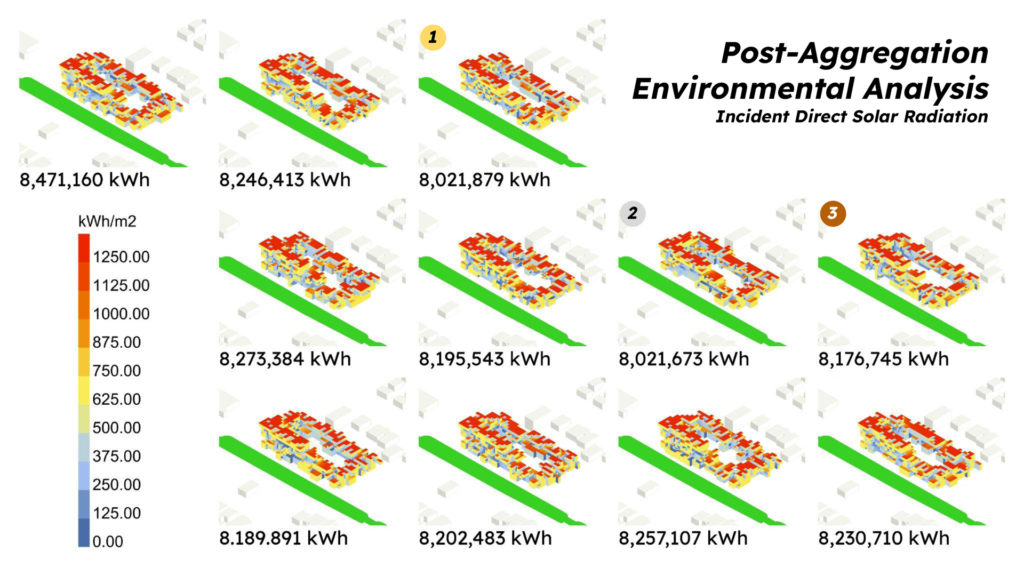
The outputs from the aggregation could be further analyzed in Ladybug a second time to further fine-tune for the lowest total radiation.
Structure
The project’s structure was optimized in Karamba3D. More info on our structural analysis and optimization can be found in this separate blog post.
Filtering The Parts Catalog
The saved lists from the parts catalog can further control the aggregation. Parts can be controlled either by the maximum ratio or maximum number of parts. We can identify parts that have a porosity value of 0 and multiply their #maxparts number by 0, resulting in those parts being removed from the aggregation altogether. Alternatively, we can select specific parts in the catalog such as “width>2”, “size<90,” or “circulation=1,” and then multiply those parts by a number between 0.0 and 1.0 to control the ratio that they will appear in the final aggregation.
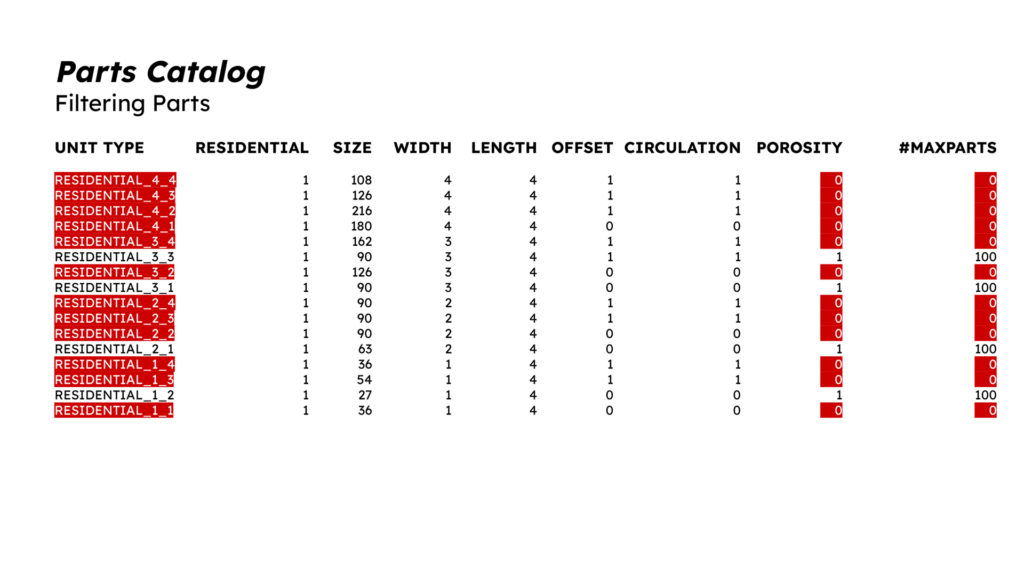
A south elevation of the aggregation when all parts with porosity of “0” are disabled.
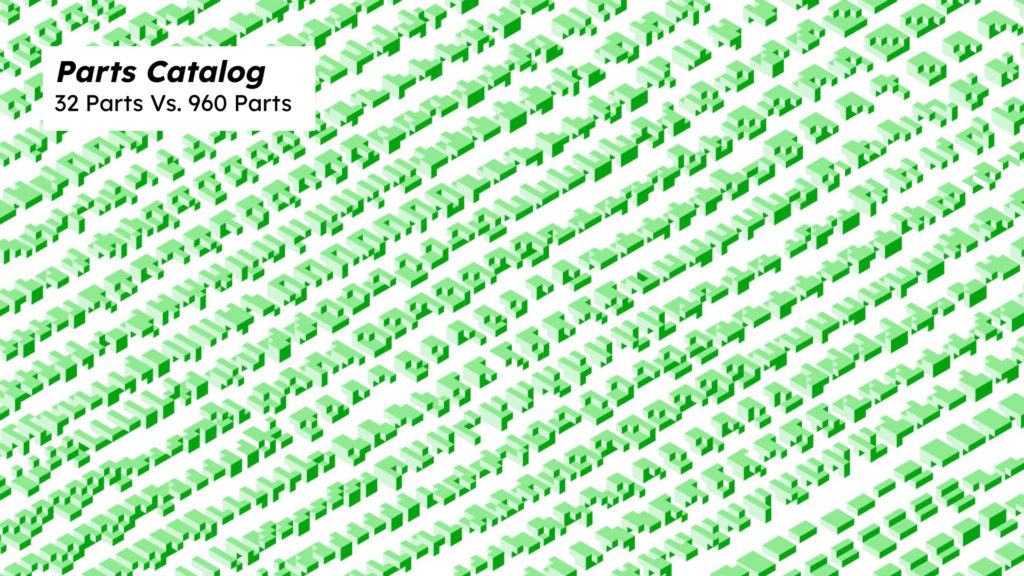
Expanding The Parts Catalog
What we love about this computational process is how scalable it is. Our parts catalog could better adjust to what is needed with even more parts. Most buildings use several simple three-bedroom apartment plans. A large parts catalog could have parts categorized as a larger master bedroom than other bedrooms for families with two kids or less, parts as a smaller master bedroom than other bedrooms for families with three kids or more, and parts with equal-sized bedrooms for professionals or students sharing. Parts for families might have a larger ratio of living room space to bedroom space, whereas parts for students and professionals might have the opposite, as they prioritize private space over socializing with people they barely know.
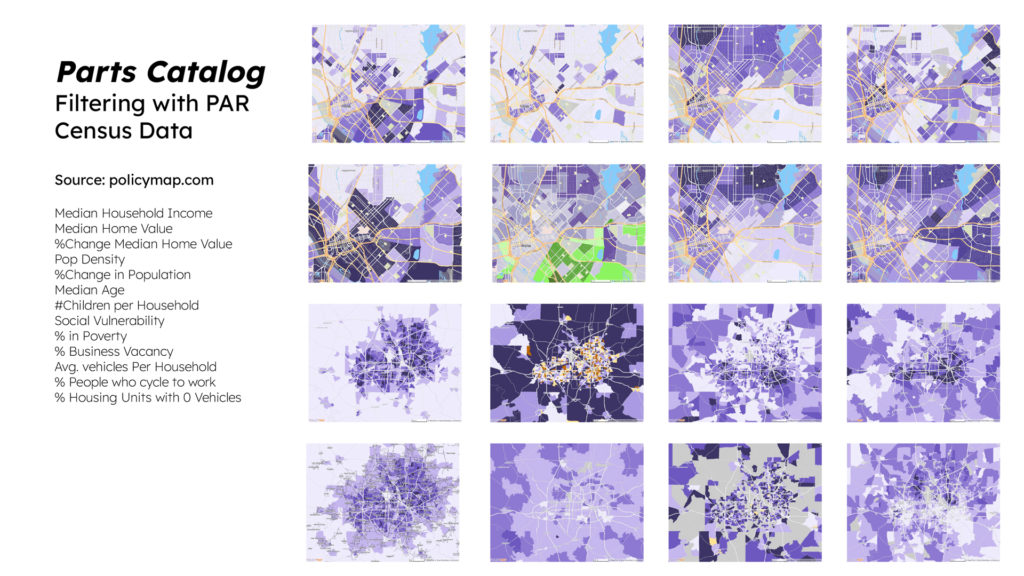
The parts catalog can be controlled manually with sliders or in a spreadsheet. An even smarter system would import several types of census information and figure out how to set the parameters within the parts catalog automatically.
Feedback Loop
We (James, Ninad) wrote our theory blog post with Raghad on “Simulating Personas.” Using these methods for collecting data, we think our building could measure its performance, reporting back on how well it is achieving its primary objective as described as the start of this post.
