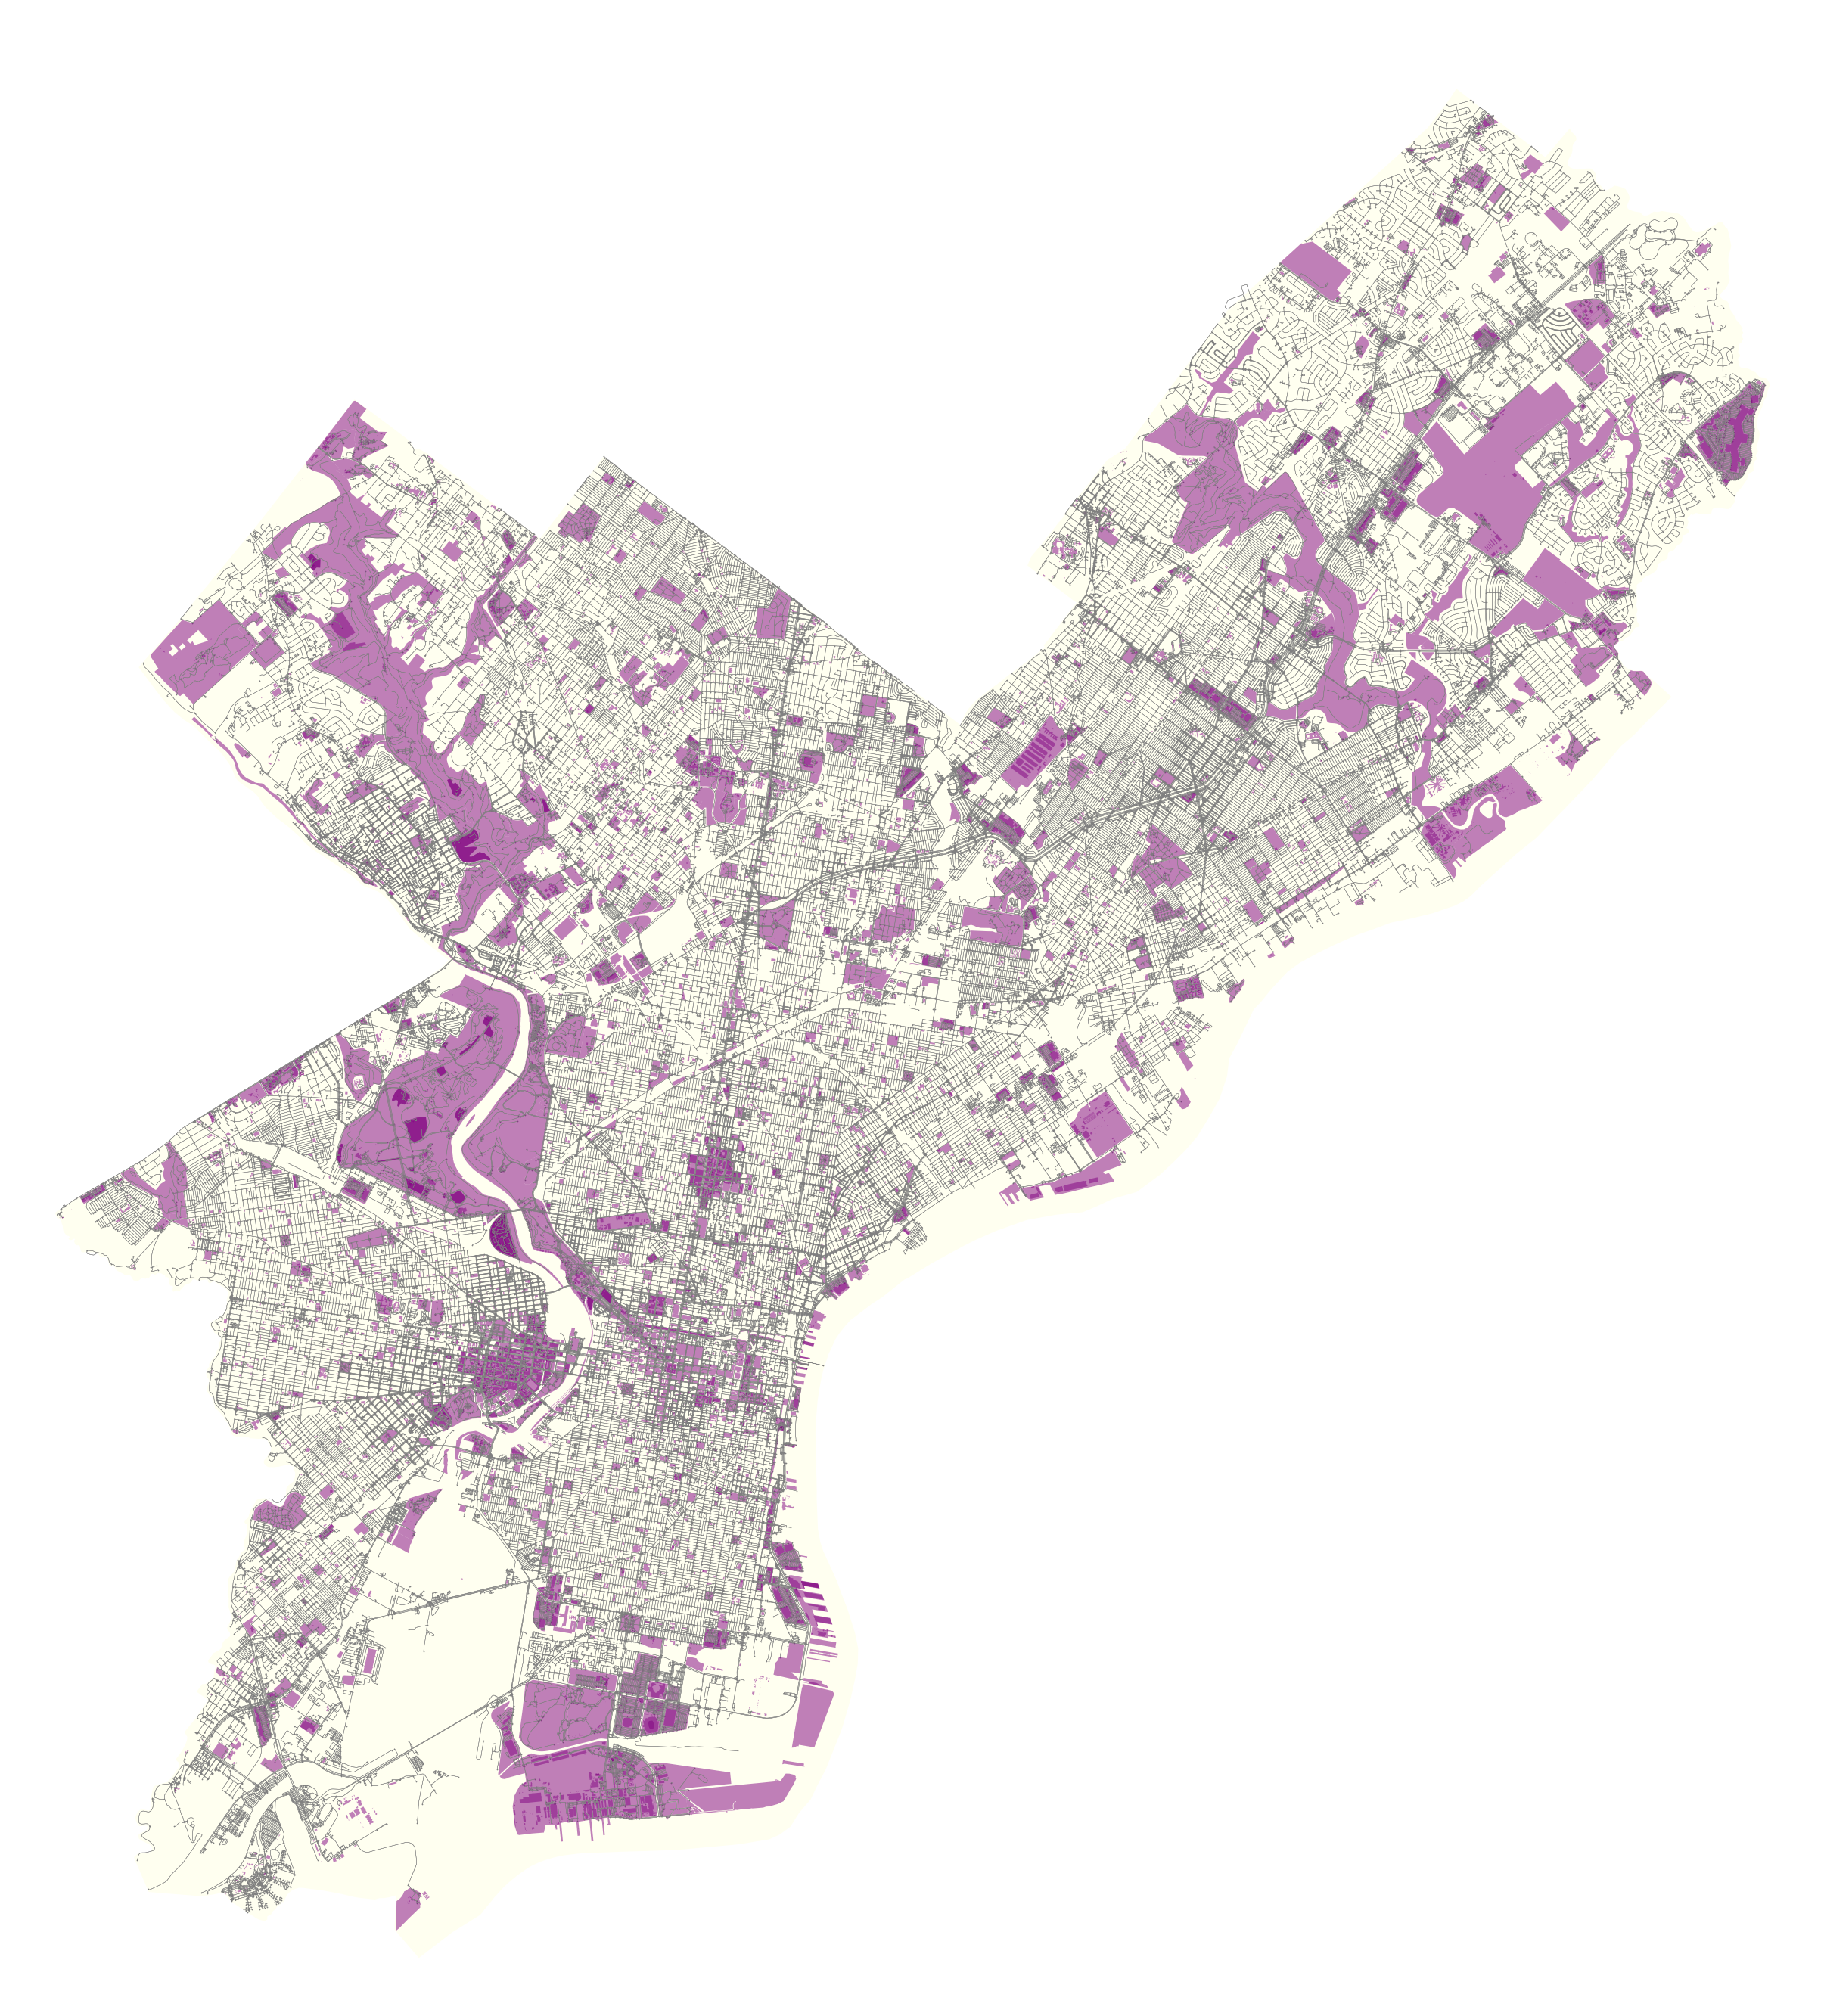
Dataset Our database contains more than 181,000 rows, each with comprehensive information. The primary database includes 17 variables, though not all are necessary for our analysis. The most crucial data points are location (latitude and longitude), type of food establishment, type of inspection, inspection results, and risk level. As the person who uploaded the database … Read more
The MaCAD is a unique online programme training a new generation of architects, engineers and designers ready to develop skills into the latest softwares, computational tools, BIM technologies and AI towards innovation for the Architecture, Engineering and Construction (AEC) industry.
Kyoto Blossoms & Tourism Machine Learning
Project Focus For our Graph Machine Learning project, wanted to look at the city of Kyoto and Tourism Behavior around Cherry blossom patterns. Specifically, we set out to find out how cherry blossom patterns might affect the behavior and walking paths of tourists within the city. Data Sets We started by collecting our data sets … Read more
Predict Yelp Ratings based on Urban Data using GML
Hypothesis The goal of this research was to investigate if open spatial data could predict Yelp ratings utilizing graph machine learning (GML) methods. We hypothesize that urban phenomena, events, and objects will indicate customer reviews and popularity, and therefore, could be used predict ratings. In particular, we perform edge classification using the DGL library. For … Read more
Balancing Tourists and Residents in Barcelona
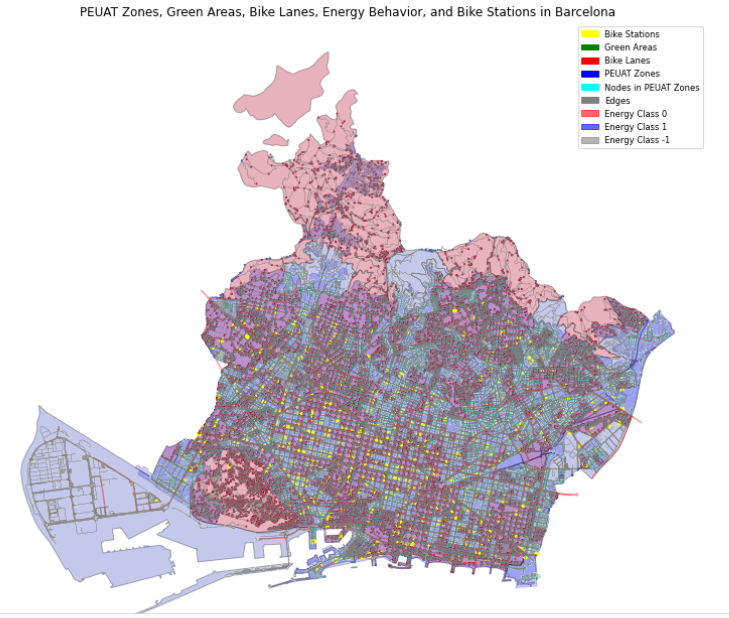
To predict whether a location in Barcelona is a key tourist site or not using graph data and specific contextual features, including the impact of the PEUAT plan on regulating tourist accommodations. The features explored and the URL selected on the Barcelona open data are score or indicator related to the tourism plan PEUAT, Proportion … Read more
Metro Station Prediction in Stockholm
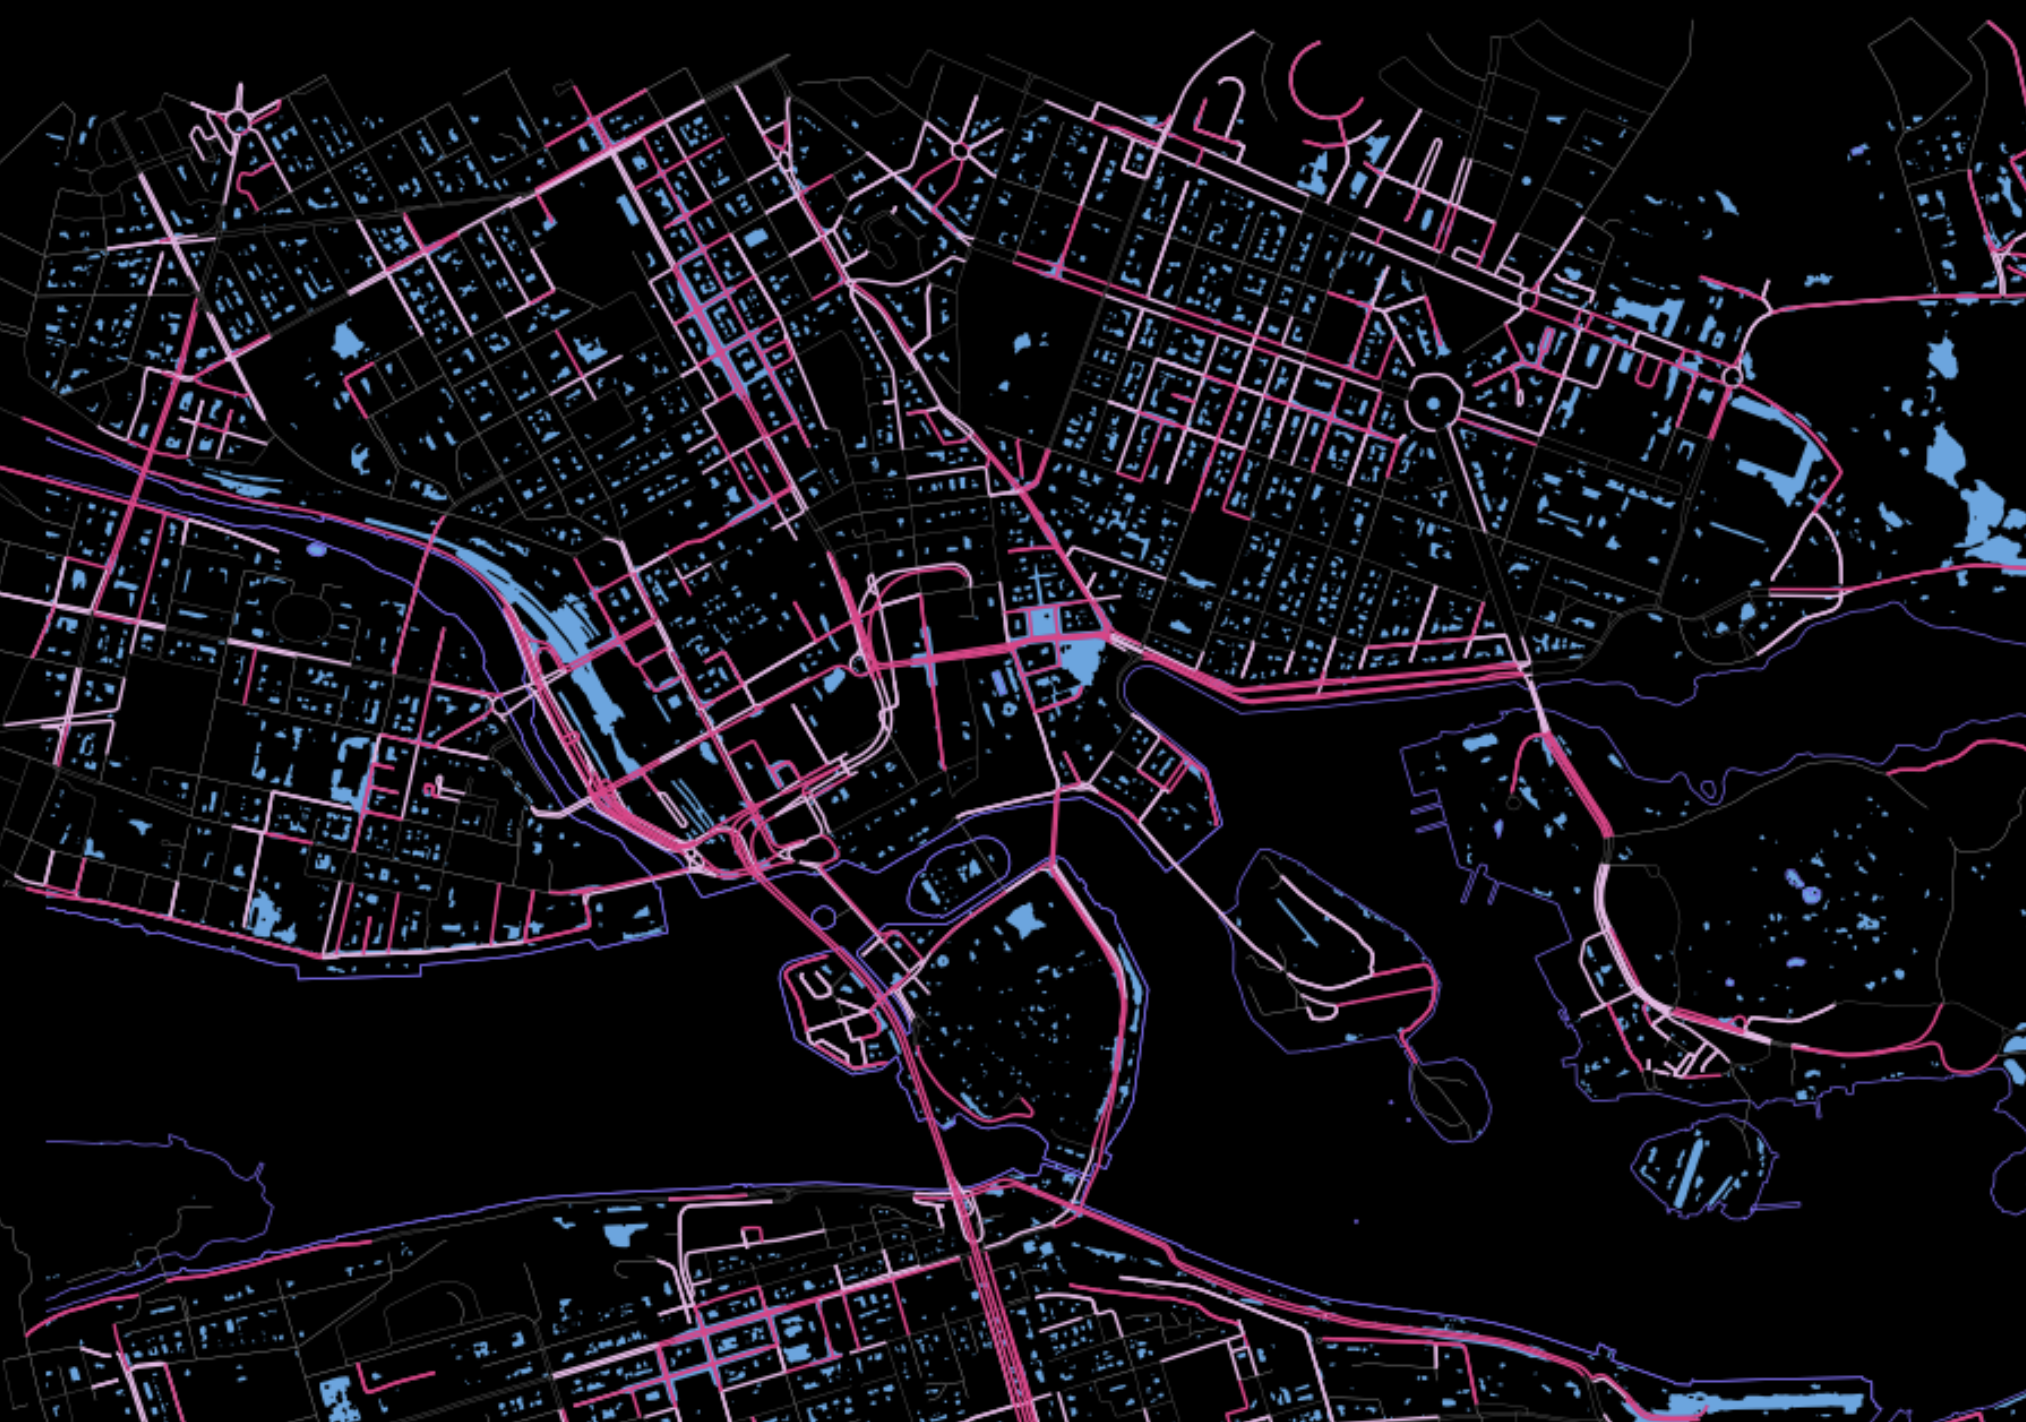
This post describes the development of a method to predict metro station locations using Graph Neural Networks (GNNs). Our journey began with a challenge familiar to urban planners: how to strategically place new metro stations to optimize transportation networks. In this case the city of Stockholm was used as testbed. The Challenge of Data Imbalance: … Read more
100-Year Flood Risk Road Intersection Classification
Beginnings Our project’s concept is to develop a classification model that identifies street intersections (graph nodes) in Stockholm, Sweden, susceptible to flooding during a 100-year flood event. Based on our initial research, we found that graph machine learning operates at three levels: the graph, its edges, and its nodes. With access to a 100-year flood … Read more
Drop by Drop – Simulate erosion
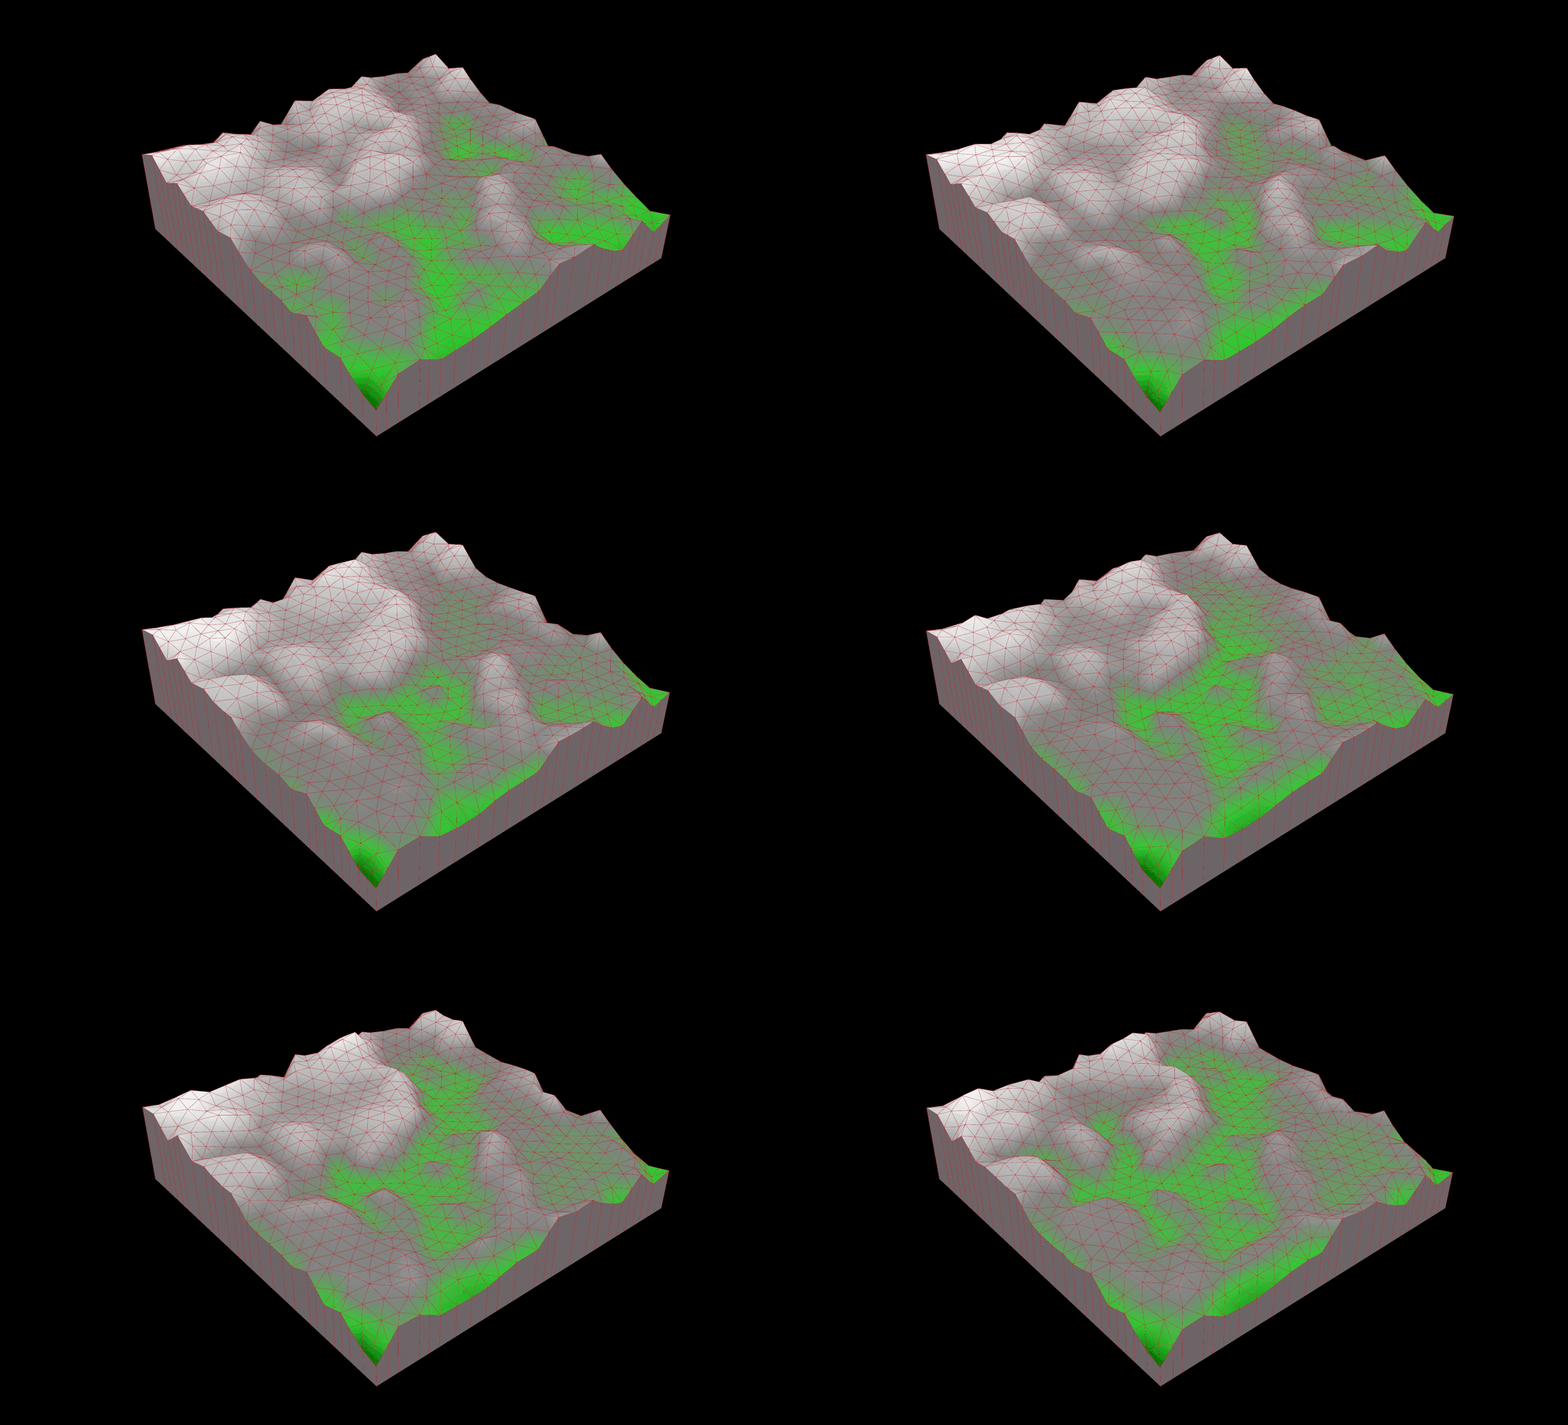
Introduction Fascinated by the formation of landscapes through geological processes, I wanted to develop an interactive tool that simulates the effects of erosion on a virtual terrain. The goal was to both illustrate how erosion works and to create an experimental playground for designing one’s own landscape forms. The development utilized VUE, ThreeJS, and Rhino.Compute. … Read more

