
Introduction
Fascinated by the formation of landscapes through geological processes, I wanted to develop an interactive tool that simulates the effects of erosion on a virtual terrain. The goal was to both illustrate how erosion works and to create an experimental playground for designing one’s own landscape forms. The development utilized VUE, ThreeJS, and Rhino.Compute. VUE, a progressive JavaScript framework, ensures a smooth and intuitive user experience. ThreeJS, a comprehensive 3D library, was used to visually present the landscape models and erosion processes in real-time. Rhino.Compute, a geometric computing platform, enabled the complex modeling and manipulation of 3D geometries in the background. The following sections will explain the key functions and technical implementation of the project.
Terrain Preparation
Initially, users are tasked with preparing a terrain for simulation. Two methods have been implemented for this purpose: Uploading a .3dm file and generating a procedural landscape.
Uploading a .3dm File: This option allows users to feed an already existing terrain model into the system. This method is especially intended for those who already possess detailed models of their study areas.
Generating a Procedural Landscape: For users without a specific model, the opportunity is provided to generate a landscape using the Diamond-Square algorithm. This is a technique from the early 80s, used in computer graphics to create height fields.
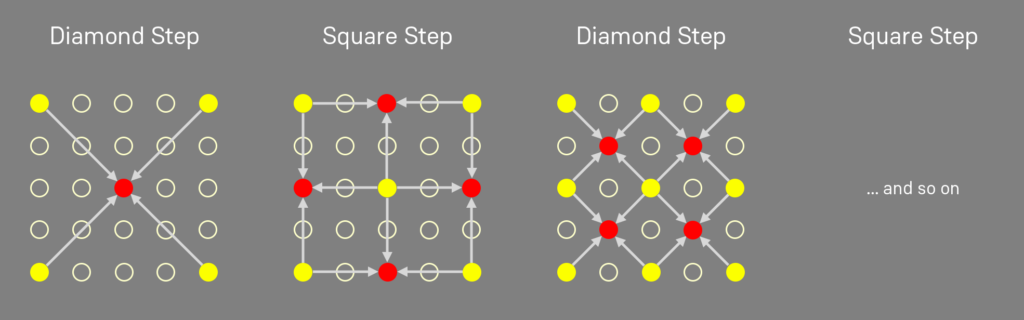
The starting point for generation is a square with given height coordinates of the corners. The algorithm recursively subdivides the square into smaller squares, defining the height value of the midpoint as the average of the four corner points, plus a random offset (>>Diamond step). Similarly, the height value of the side midpoints of a square is defined as the average of the four horizontally surrounding points, plus a random offset (>>Square step).
These two steps are repeated until a height is assigned to every point in the landscape. This algorithm was chosen because it is relatively simple to implement, yet can generate landscapes that appear realistic. Various parameters such as the number of iterations and the roughness allow control over the landscape form in the web app. . Further information on the algorithmcan be found here:
https://janert.me/blog/2022/the-diamond-square-algorithm-for-terrain-generation/
https://en.wikipedia.org/wiki/Diamond-square_algorithm]
Erosion Simulation
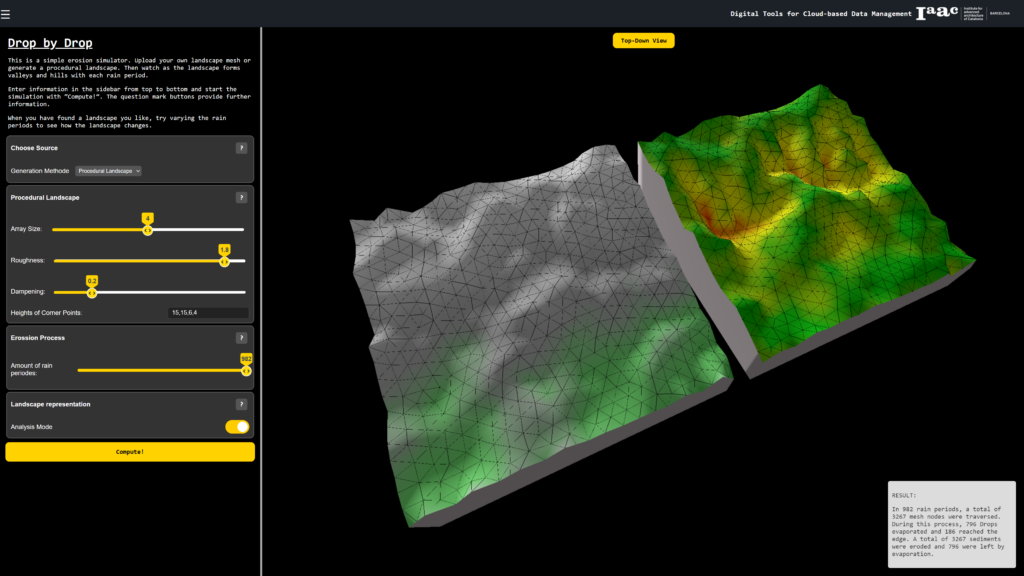
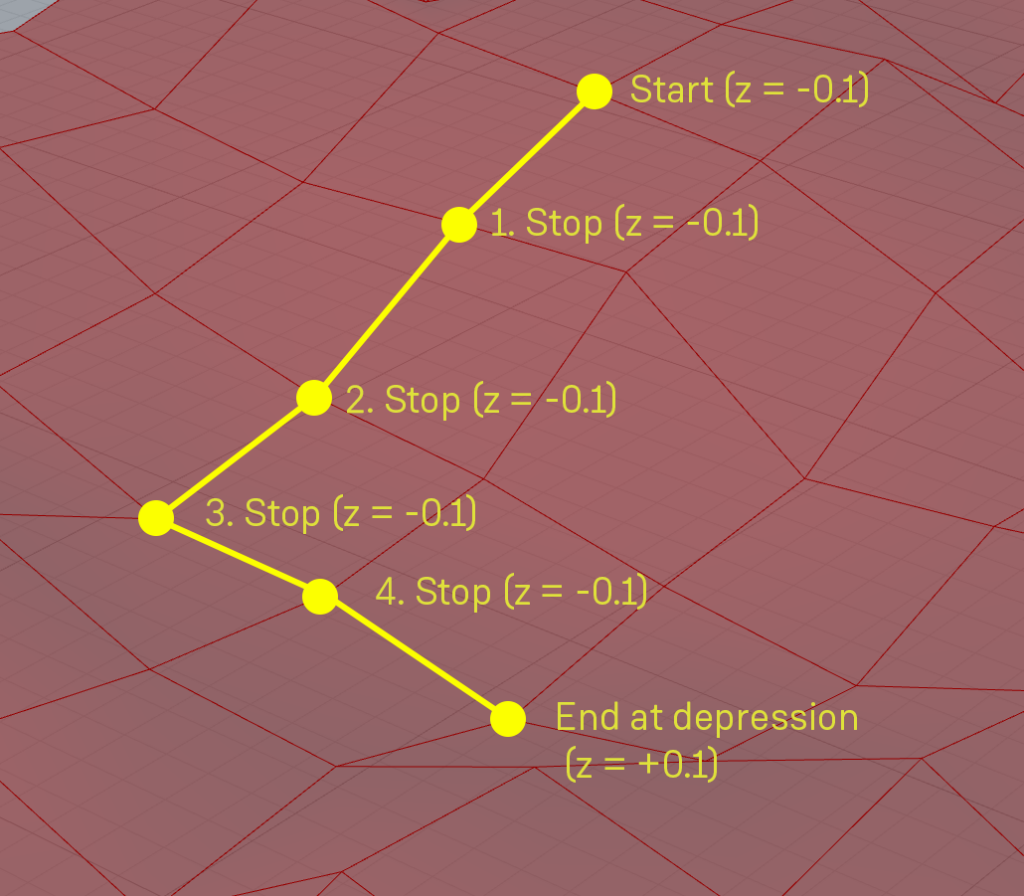
After generating the terrain, users can define the number of rain periods to be simulated. In each rain period, a point on the terrain mesh is randomly selected, where a virtual raindrop is generated. This drop then follows the steepest descent on the connections between the individual mesh nodes. As it passes the individual mesh nodes, erosion, or the removal of material, is simulated by reducing the height value of the node by 0.1. This creates erosion traces, basins, and valleys in areas with frequent water flow. If the virtual water droplet reaches the edge of the mesh or a basin from which no further descent exists, this rain period is ended, and the entire process begins again with the next period until the preset number is reached.
The challenge in this implementation was that only a limited number of Grasshopper plugins were installed on the server of the web app – plugins that could more easily implement the aforementioned procedure were not available. Therefore, the process was mainly solved using a Python component in Grasshopper. The landscape data is stored in a 2D array, which maps the height values of the individual mesh nodes. This simplifies especially the determination of neighboring mesh nodes and their manipulation significantly. Only afterwards the square mesh is converted into the triangular mesh that is also outputted.
Terrain Representation
Through a toggle, the user has the option to display their eroded landscape either with natural coloring or to invoke an analysis mode. In natural coloring, a mountainous landscape is generated simply by assigning different colors to mesh nodes depending on their height. In analysis mode, on the other hand, the strongest height change is highlighted in red and the least in green. This view shows the areas with the greatest erosive effect at a glance.
User Experience
For a good user experience, related inputs were grouped together. This allowed me to enable clear and logical navigation through the various simulation options and settings. In addition, “?” buttons have been integrated next to each input field and option. Activating these help buttons opens small information windows that offer further context-related tips and assistance for the respective functions.
Another important aspect of the user experience is error handling. For the most common sources of error, I am providing tooltips and help texts that are displayed directly when errors occur.
Video Presentation
Below is a short video presentation of the app and you can also try it out for yourself at https://datamgmt24.iaac.net/ (the button at the top left opens the side menu and allows access to the web app).
