Introduction
Pokémon GO, the groundbreaking augmented reality mobile game developed by Niantic, has revolutionized the gaming industry since its launch in 2016. With millions of players worldwide, the game transcends traditional gaming boundaries by integrating virtual creatures known as Pokémon into real-world environments. As players explore their surroundings, they encounter Pokémon spawns in various locations, adding an element of adventure and discovery to their gameplay experience. Behind this seamless integration lies a complex web of data and patterns that govern the spawning and migration of these digital creatures. In this project, I delve into the world of Pokémon spawns, exploring the methodologies and findings of the background behind the game algorithm.
Research question
What environmental factors influence the spatial distribution of Pokémon spawns, and how do they interact with game mechanics to determine spawn locations?
Data collection
To conduct this research, a comprehensive dataset comprising various types of data is required. The data collection process involves gathering the following information:
- Coordinates of Pokémon Spawns (2016): This dataset contains the geographical coordinates (latitude and longitude) of Pokémon spawn locations recorded during the initial release of Pokémon GO in 2016 from Kaggle community dataset. With over 300,000 data points, it provides a substantial sample of spawn locations across different regions. (https://www.kaggle.com/datasets/semioniy/predictemall/data)
- Pokémon Name and Type: Information about the Pokémon species is essential for understanding the distribution and characteristics of spawns. This dataset includes the names and types (e.g., Normal, Fire, Water) of Pokémon species encountered in the game.
- OpenStreetMap Data: OpenStreetMap (OSM) is a valuable source of geospatial data that provides detailed information about the physical environment, such as roads, parks, landmarks, and water bodies. Utilizing OSM data allows for the analysis of environmental factors that may influence Pokémon spawn locations, such as land use, terrain, and proximity to amenities.
- Third-Party Sources and References: Supplemental data from third-party sources and references can enhance the analysis by providing additional context and insights. This may include research papers, articles, blogs, and community forums discussing Pokémon spawn mechanics, habitat preferences, and player observations.
Research Methodology
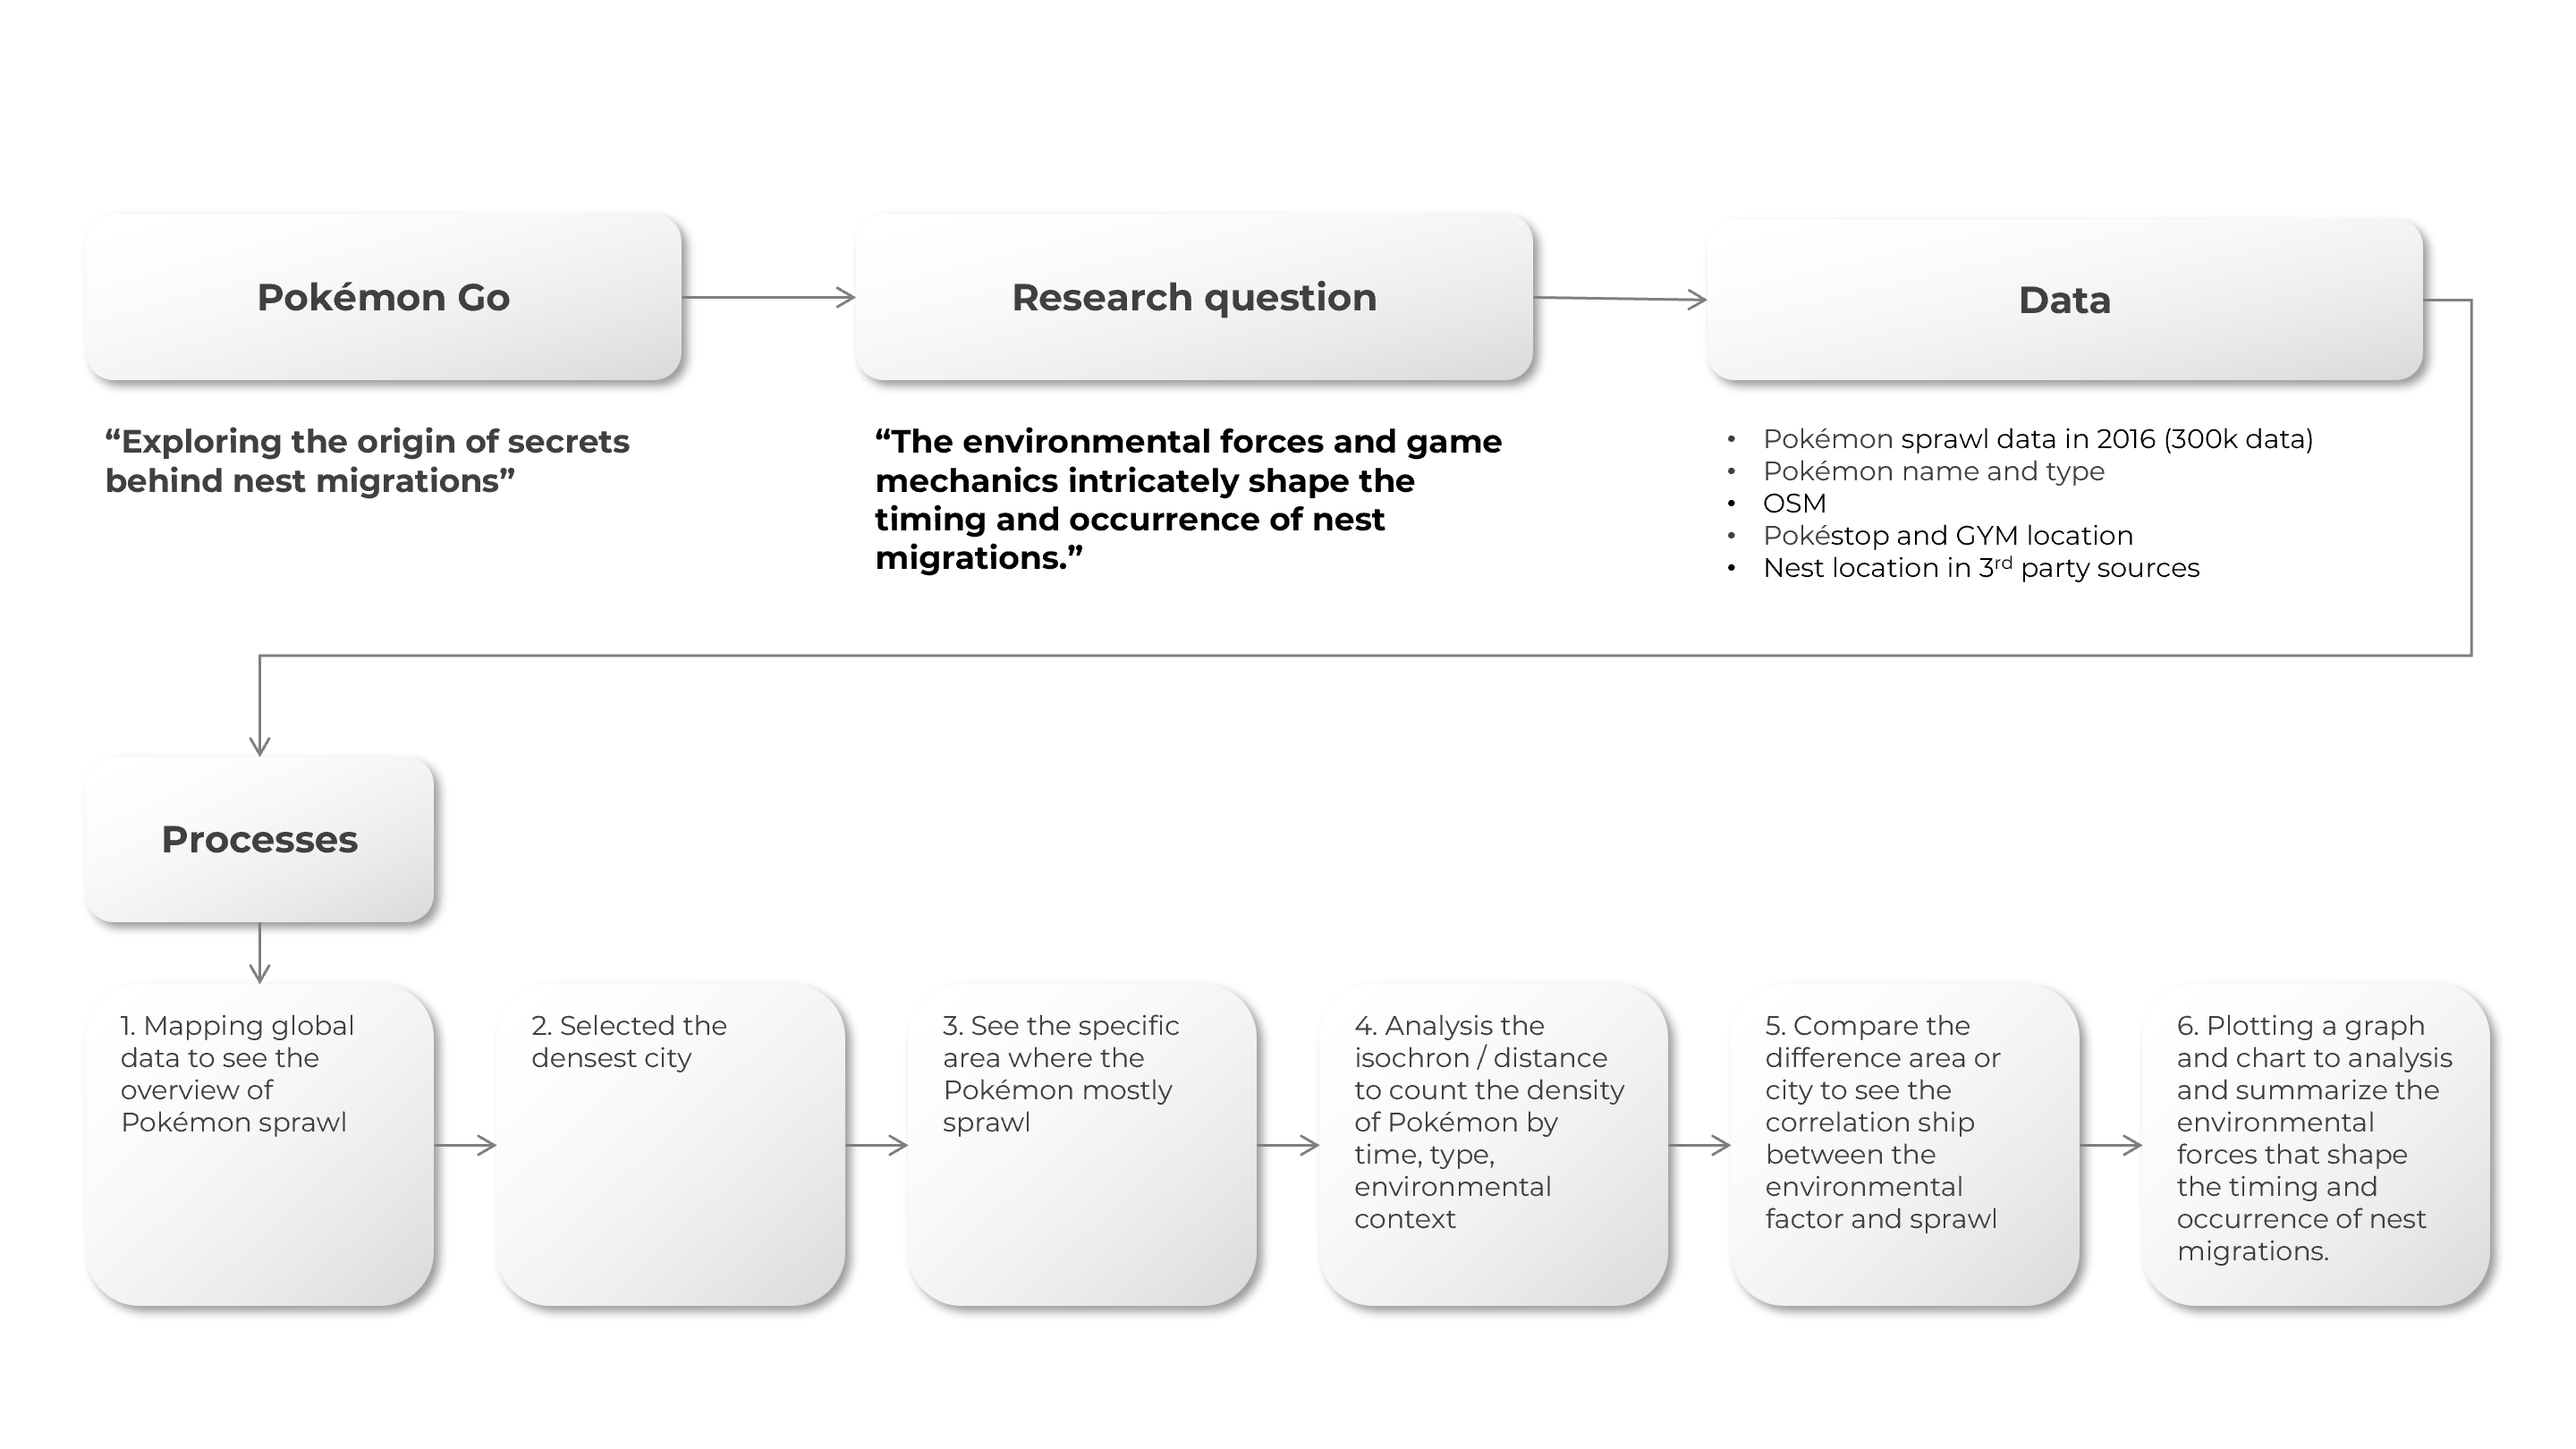
To investigate the environmental forces and game mechanics that shape Pokémon spawns and nest migrations in Pokémon GO, I employed a comprehensive research methodology consisting of several key steps:
1. Mapping the Global Data
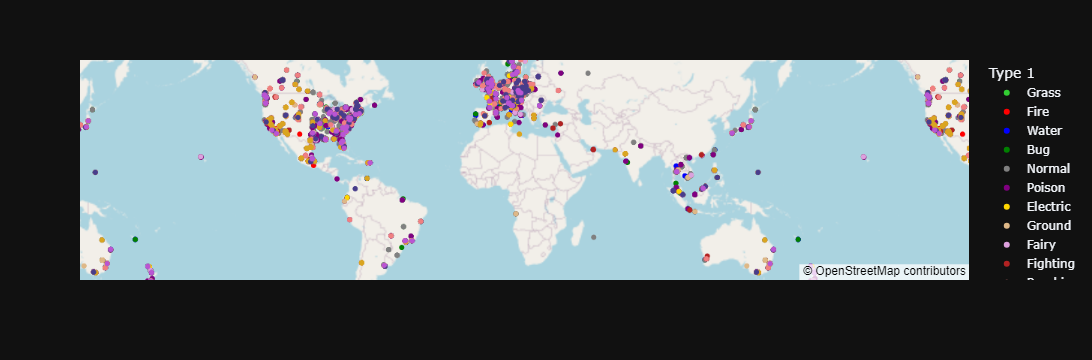
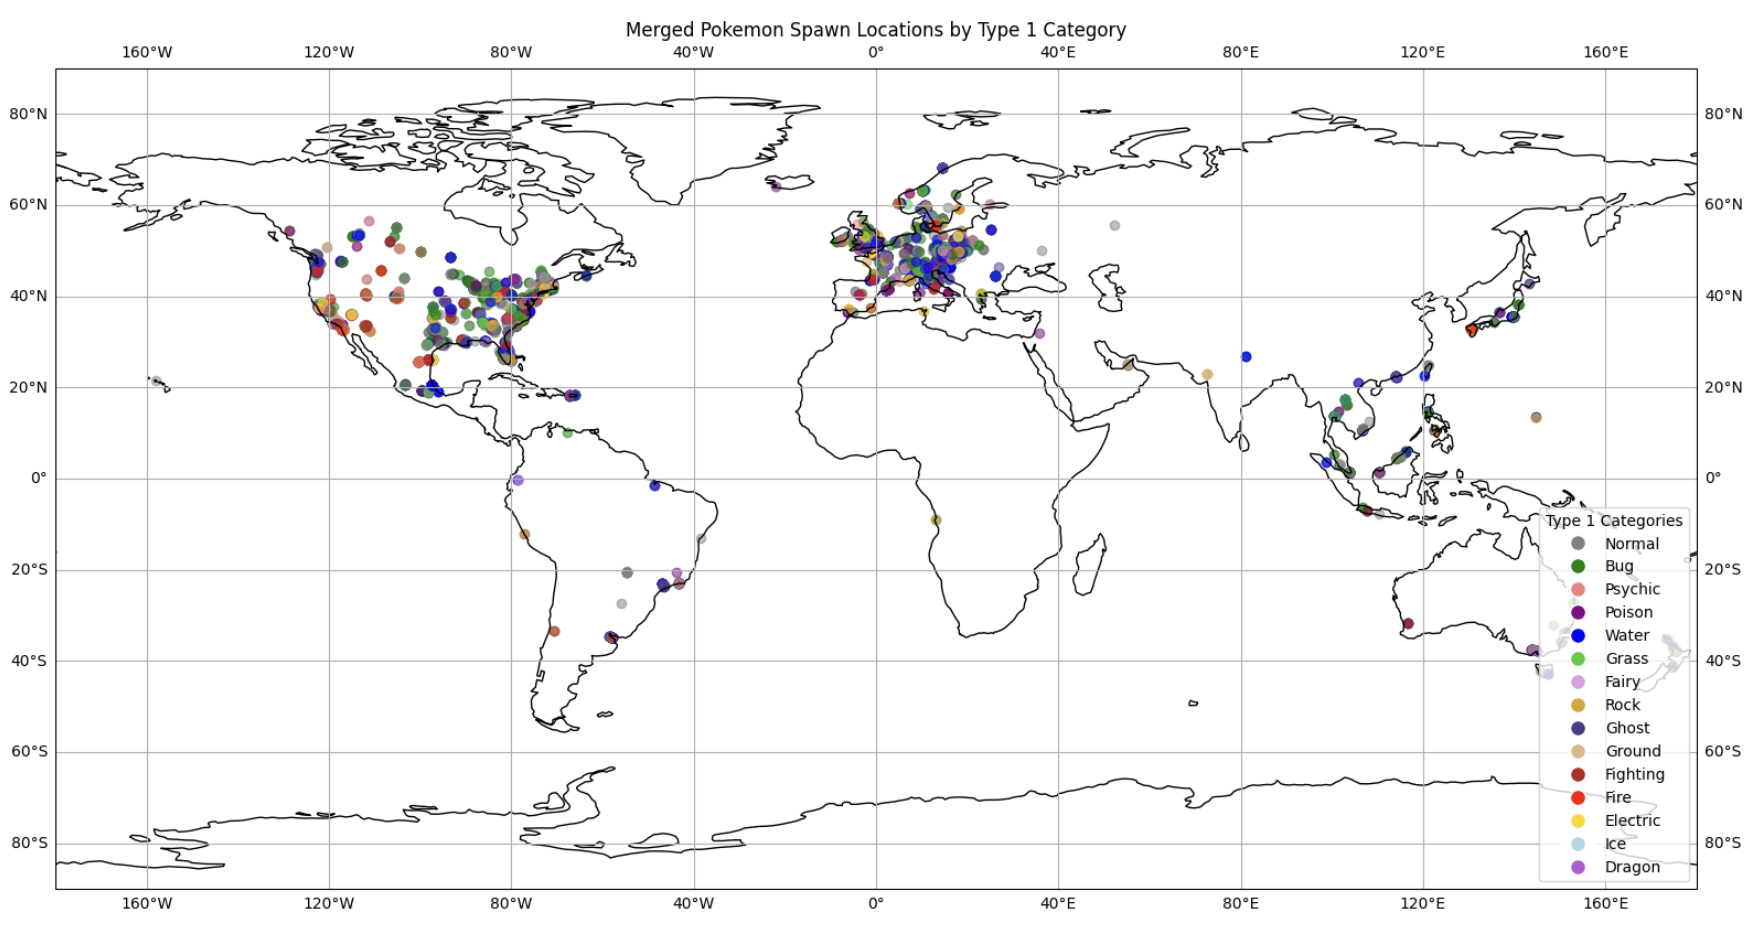
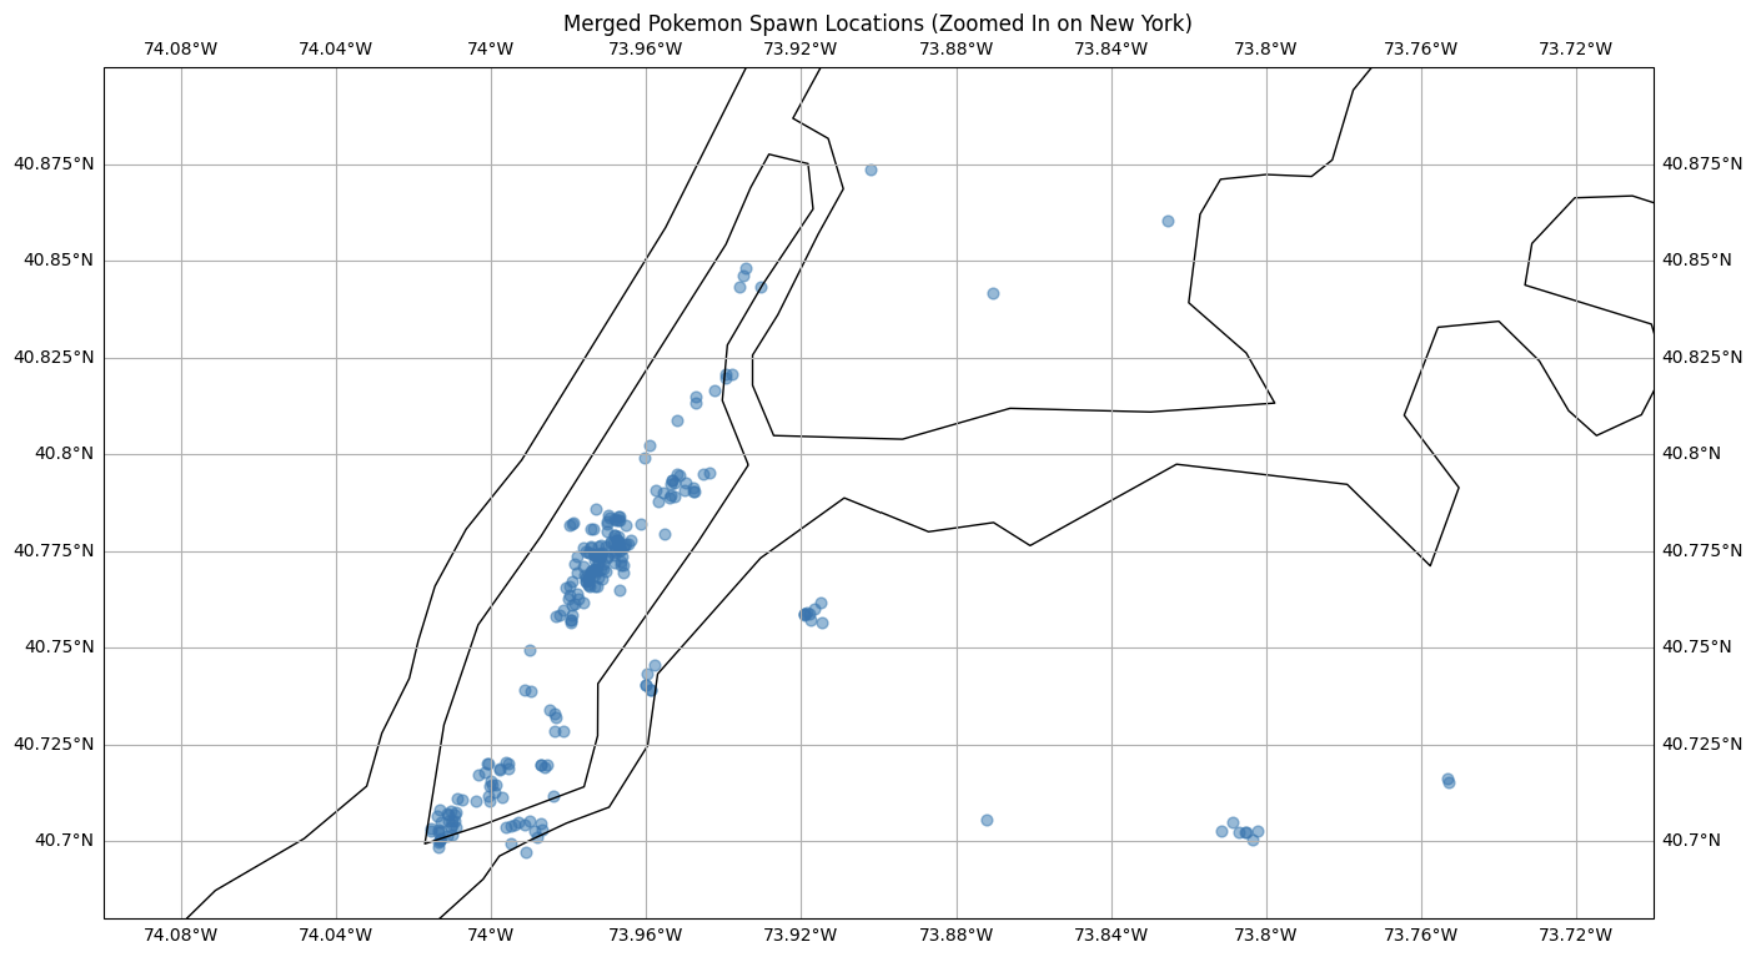
This step involves using Python libraries like GeoPandas and Cartopy to merge the Pokémon spawn dataset with OpenStreetMap data. By leveraging Python’s merge function, I can combine over 300,000 Pokémon spawn coordinates with spatial attributes extracted from OpenStreetMap. Using Cartopy, they can visualize the merged dataset on global maps, revealing spatial distribution patterns of Pokémon spawns in relation to geographic features. This approach provides valuable insights into Pokémon habitat preferences and spawn dynamics.
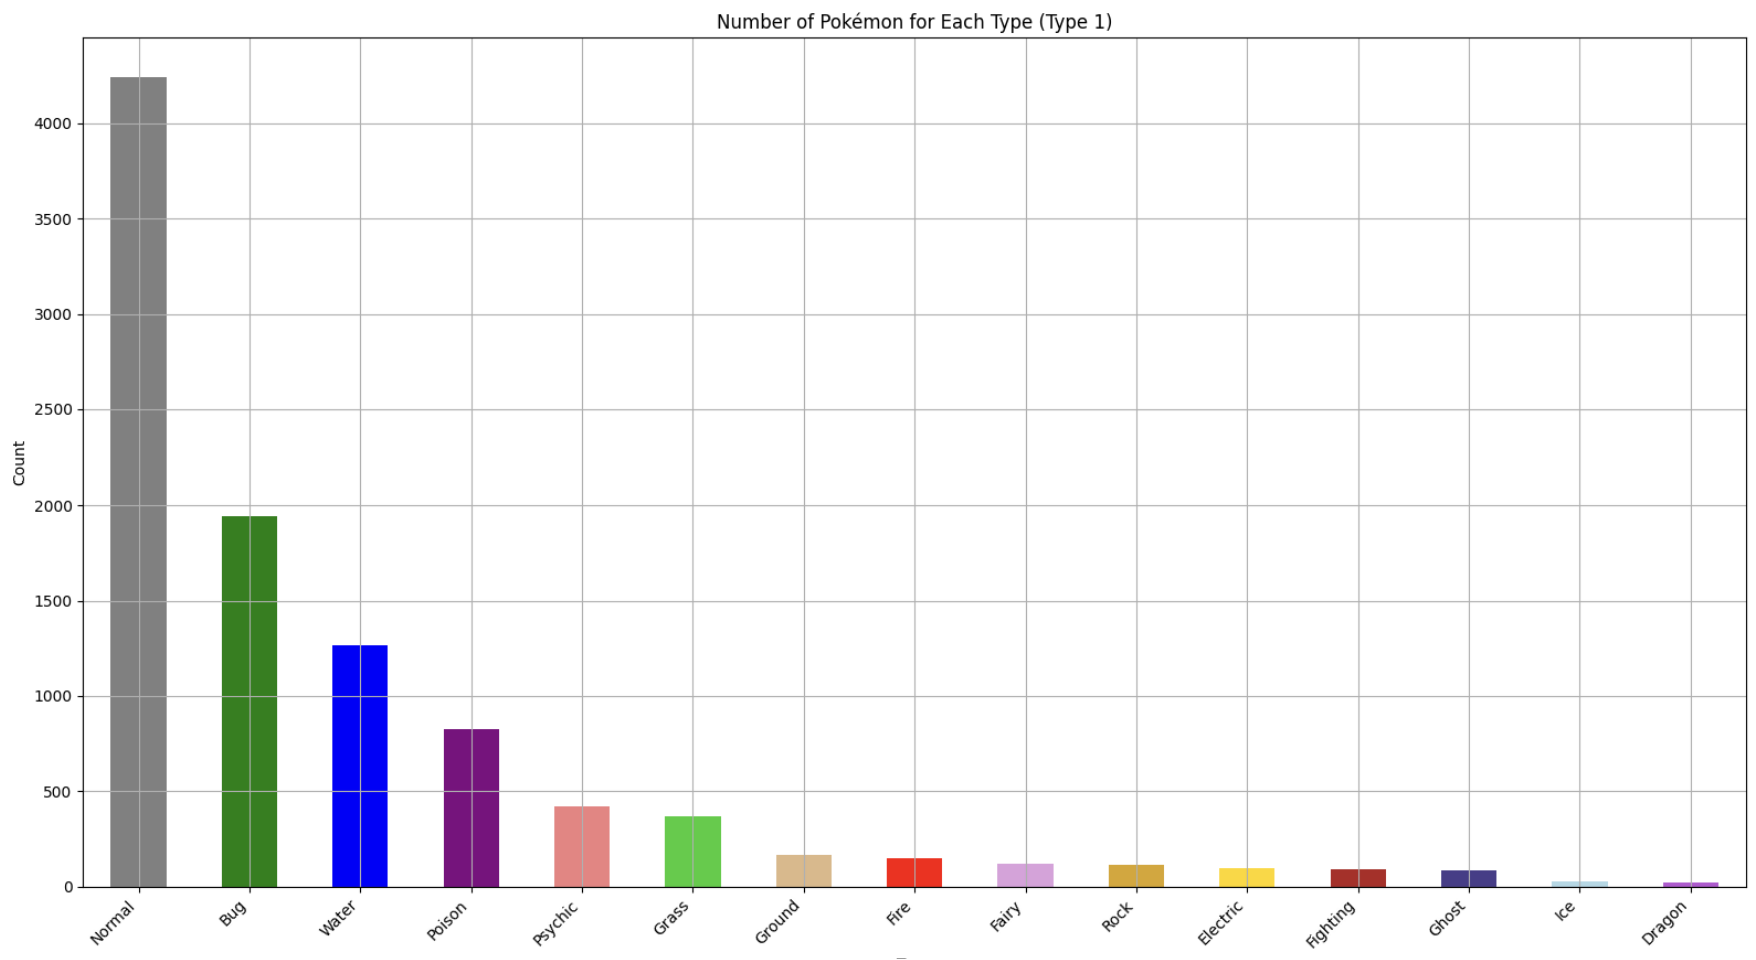
To create a bar chart to understand the size of each Pokémon type category, I can utilize Python’s matplotlib or seaborn libraries. By grouping the Pokémon data by type and counting the occurrences of each type, I can generate a bar chart displaying the frequency or proportion of each Pokémon type.
2. Selection of Study Area
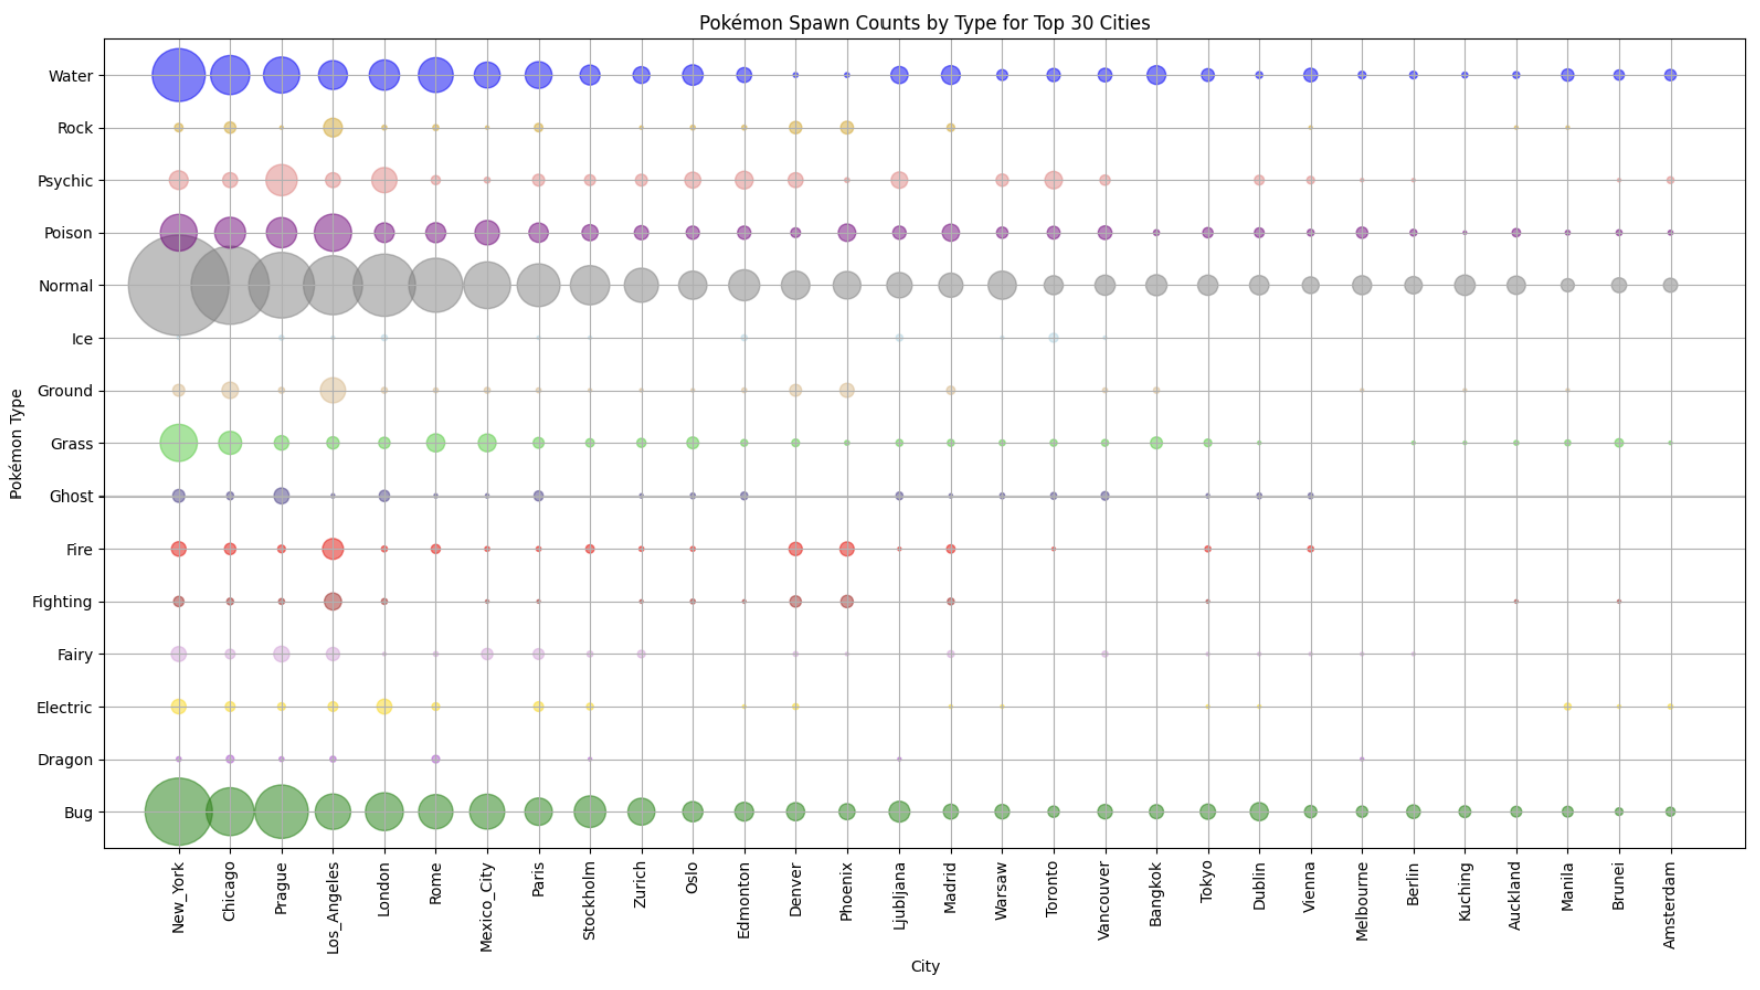
To visualize the relationship between Pokémon spawn size for each type in different cities, I can utilize scatter charts in Python. By plotting the spawn size of each Pokémon type against the city names, they can identify trends and patterns in Pokémon distribution across various locations. Additionally, they can identify the top 30 cities with the highest Pokémon activity to select them as study areas for further analysis.
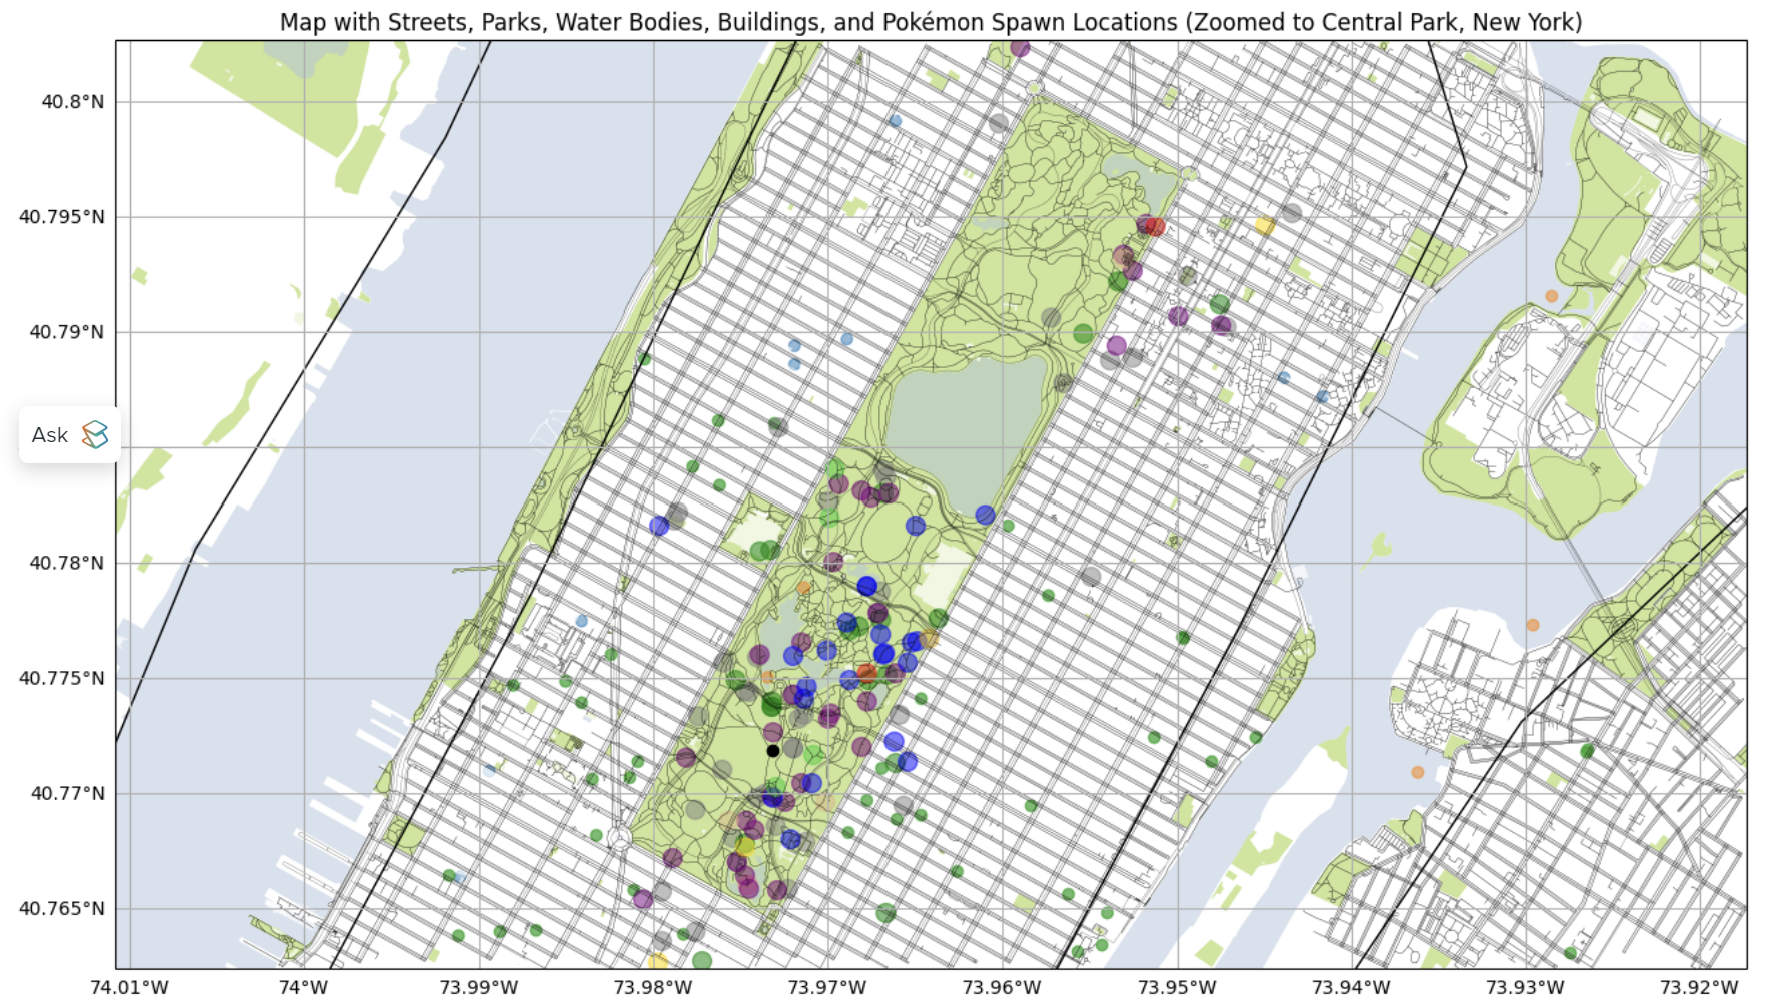
To focus on New York City as a study area, can utilize the pandas library in Python to plot the Pokémon spawn locations and their frequencies. Specifically, they can create a plot that highlights the hotspots within Central Park, one of the city’s iconic locations.
3. Spatial Analysis
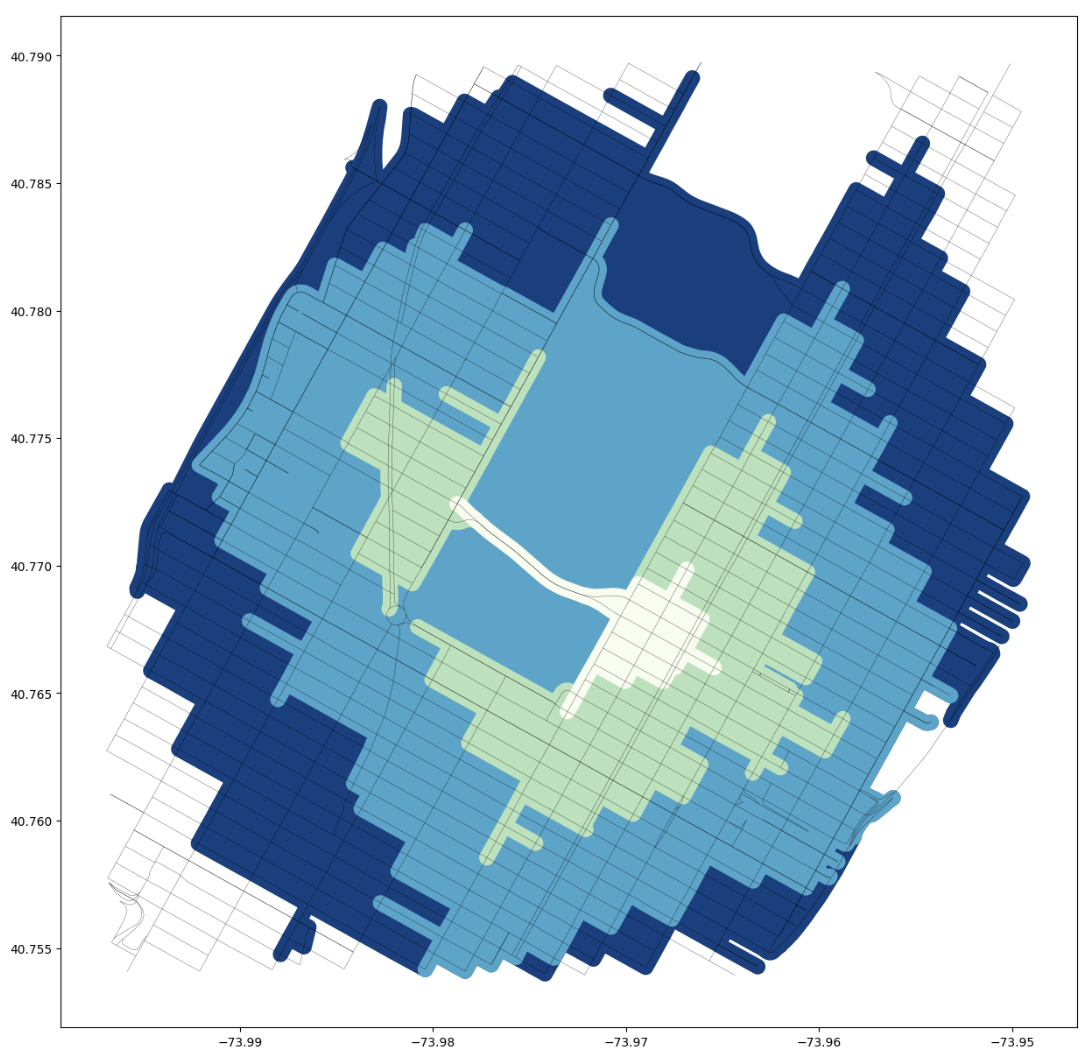
For in-depth spatial analysis, I employ Cartopy and OSMnx tools to explore the intricate relationship between Pokémon spawn locations and key landmarks or points of interest within the city. This approach allows us to delve into how the distribution of Pokémon spawns correlates with the proximity to significant urban features like Central Park, riverfronts, or city plazas. By leveraging these tools, I gain valuable insights into the spatial dynamics of Pokémon habitats and their interaction with the urban environment. This analysis enhances our understanding of the factors influencing spawn patterns, contributing to a more comprehensive exploration of Pokémon ecology in real-world settings.
4. Timing Analysis
I analyze temporal dynamics of Pokémon spawns to understand their patterns over time. Timing analyses examine relationships between spawn occurrences and factors like time of day. By identifying peak spawn periods and correlations with environmental conditions, researchers gain insights into Pokémon behavior. To visualize these patterns, ‘for’ loops create plots for morning, afternoon, evening, and night, revealing variations in spawn activity. This analysis enhances understanding of Pokémon ecological patterns in real-world environments.
5. Data Comparison
Comparative analyses compare Pokémon spawn patterns and environmental influences across multiple cities or regions within the study area. By comparing spawn data from diverse locations like Prague, ranked third in Pokémon spawn rate, I identify regional variations in habitat preferences, spawn rates, and species diversity. This comparative approach reveals common trends and unique characteristics specific to each city. Moreover, I explore the relationship between Pokémon spawn rates and distances from public spaces or city landmarks, offering insights into spatial patterns and urban ecology.
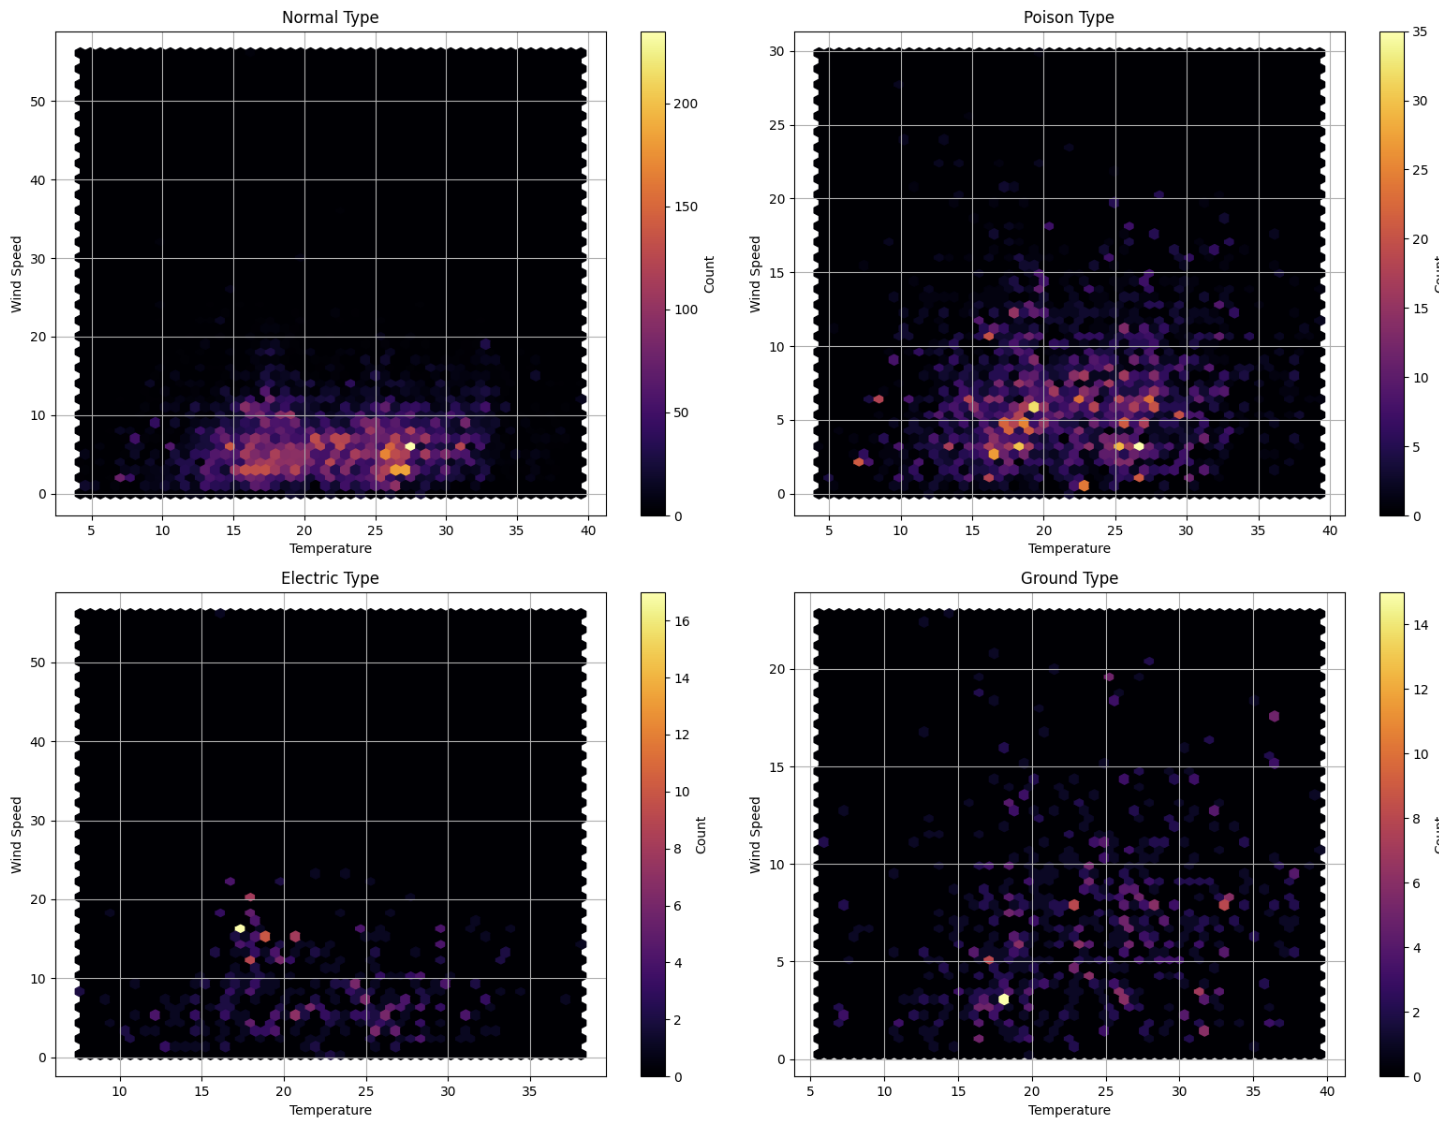
6. Statistical Analysis
Hexagonal binning charts, created using Matplotlib and Pandas, offer a concise way to visualize Pokémon spawn density across regions. By aggregating spawn data into hexagonal bins, I may can represent spawn distribution. Customizable parameters like grid size and colormap ensure clarity. These charts help identify areas of high spawn density and spatial patterns, aiding our understanding of spawn patterns and habitat associations.
Conclusion
There are several notable patterns emerging from both the spatial and statistical analyses of Pokémon spawns, which support players’ beliefs regarding the underlying logic behind these spawns:
Location:
Pokémon spawns tend to align with areas frequented by players, making it more convenient for them to catch or battle Pokémon. Common Pokémon, like Normal and Grass types, are often found in mid-urban areas, whereas rarer species, such as Dragon or Fairy types, are more likely to spawn in city centers, central parks, or large parks, as well as piers or ports in mega cities. Common vs. Rare Pokémon: Common Pokémon are typically abundant in mid-urban areas, while rarer types are more prevalent in central areas.
Geography:
Pokémon spawns often correlate with specific topographical features. For instance, water-type Pokémon and poison-type Pokémon are frequently encountered near riverfronts. Rare types such as Dragon and Fire Pokémon are more prevalent in large city parks, as well as popular piers or public spaces. Conversely, common Pokémon types are distributed more evenly and can be found in a variety of locations.
Weather Sensitivity:
Pokémon spawns may be influenced by weather conditions, with stronger Pokémon more likely to appear in areas with higher wind levels or temperatures. Ice Pokémon can may spqwn in the area with low temperature and high wind speed, In contrast, common or normal types are less sensitive to weather and can be found across various environments.
Timing:
Pokémon spawns tend to peak in the afternoon, followed by morning, evening, and nighttime. Common Pokémon are often found at night, particularly near gyms or public spaces.
Player Density:
Cities with higher player densities tend to host a greater variety of Pokémon species, making it easier to encounter rare Pokémon.
However, it's important to note that these findings are based on data from 2016, which represents the early stages of Pokémon spawn algorithms since the game's launch. It's possible that these algorithms have evolved over time, but the map provides valuable insights that can help players predict and enhance their Pokémon GO experience.! :)