

Abstract
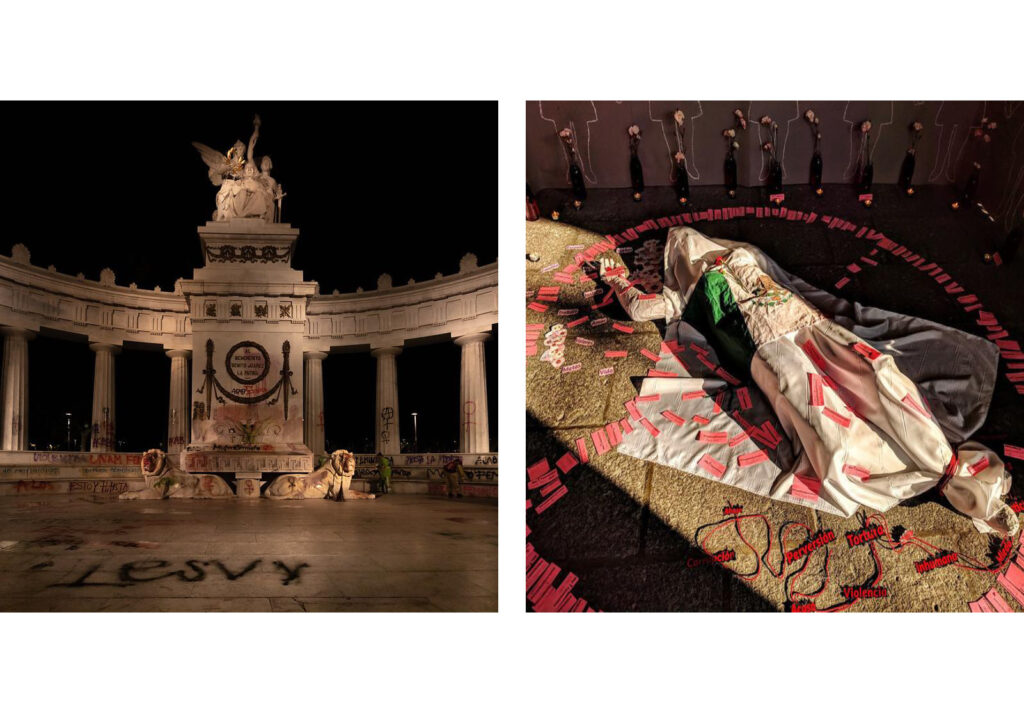
This study examines the pressing problem of violence against women in Mexico City, focusing specifically on strategies to prevent the escalation of violence that can lead to femicides. The persistence of gender-based violence in the city is aggravated by socioeconomic disparities, inadequate urban planning, and a deficiency of safe public spaces. The notable increase in femicides requires urgent interventions that address both the manifestations and root causes of this violence. This research aims to uncover the relationships between crimes against women, urban morphology, and the city as a network, especially in high-risk neighborhoods where women are disproportionately affected. Employing spatial syntax and graph machine learning (GML), we propose a data-driven framework that explores these interconnections to analyze specific urban interventions. This approach aims to alter the conditions that lead to the escalation of violence while promoting the creation of safer urban environments for women. The findings underscore the potential of integrating spatial analysis with machine learning methodologies to inform urban planning strategies that prioritize safety, equity, and prevention of gender-based violence in Mexico City.
At the same time, implementing Graph Machine Learning workflows to achieve complex issues, such as this one, is often cumbersome and not intuitive posing significant challenges. This study addresses these difficulties by integrating visual programming languages to simplify the processes involved in Graph Machine Learning. Using femicides and violence against women in Mexico City as a case study, we explore how visual programming tools can facilitate geometric manipulation and spatial analysis. This integration aims to improve the efficiency and accessibility of predictive models. By employing a simplified process that incorporates advanced Graph Machine Learning techniques with visual programming, this research aims to explore alternate methodologies in the way violence against women is addressed.
Introduction
Femicides in Mexico City have increased by an alarming 127% over the past nine years, creating an urgent need for effective, data-driven interventions. SafeNet is a project developed to address this crisis by combining Graph Machine Learning (GML) and Space Syntax with urban planning to propose solutions that can make public spaces safer for women.
Hypothesis
The integration of a comprehensive AI-driven methodology that incorporates an urban morphology analysis and space syntax can find relationships, identify and mitigate factors contributing to violence against women in Mexico City. By integrating advanced computational techniques and graph neural networks through causal analysis, this approach has the potential to lead to effective public space interventions that can enhance urban safety, reduce the risk of violence against women and, ultimately, prevent femicides.
This thesis work explores the methodology behind SafeNet, the insights gained from studying Mexico City’s Historic Downtown, and how a comprehensive Safety Score can guide interventions to reduce violence.
The Safety Score: Measuring Risk and Designing for Safety
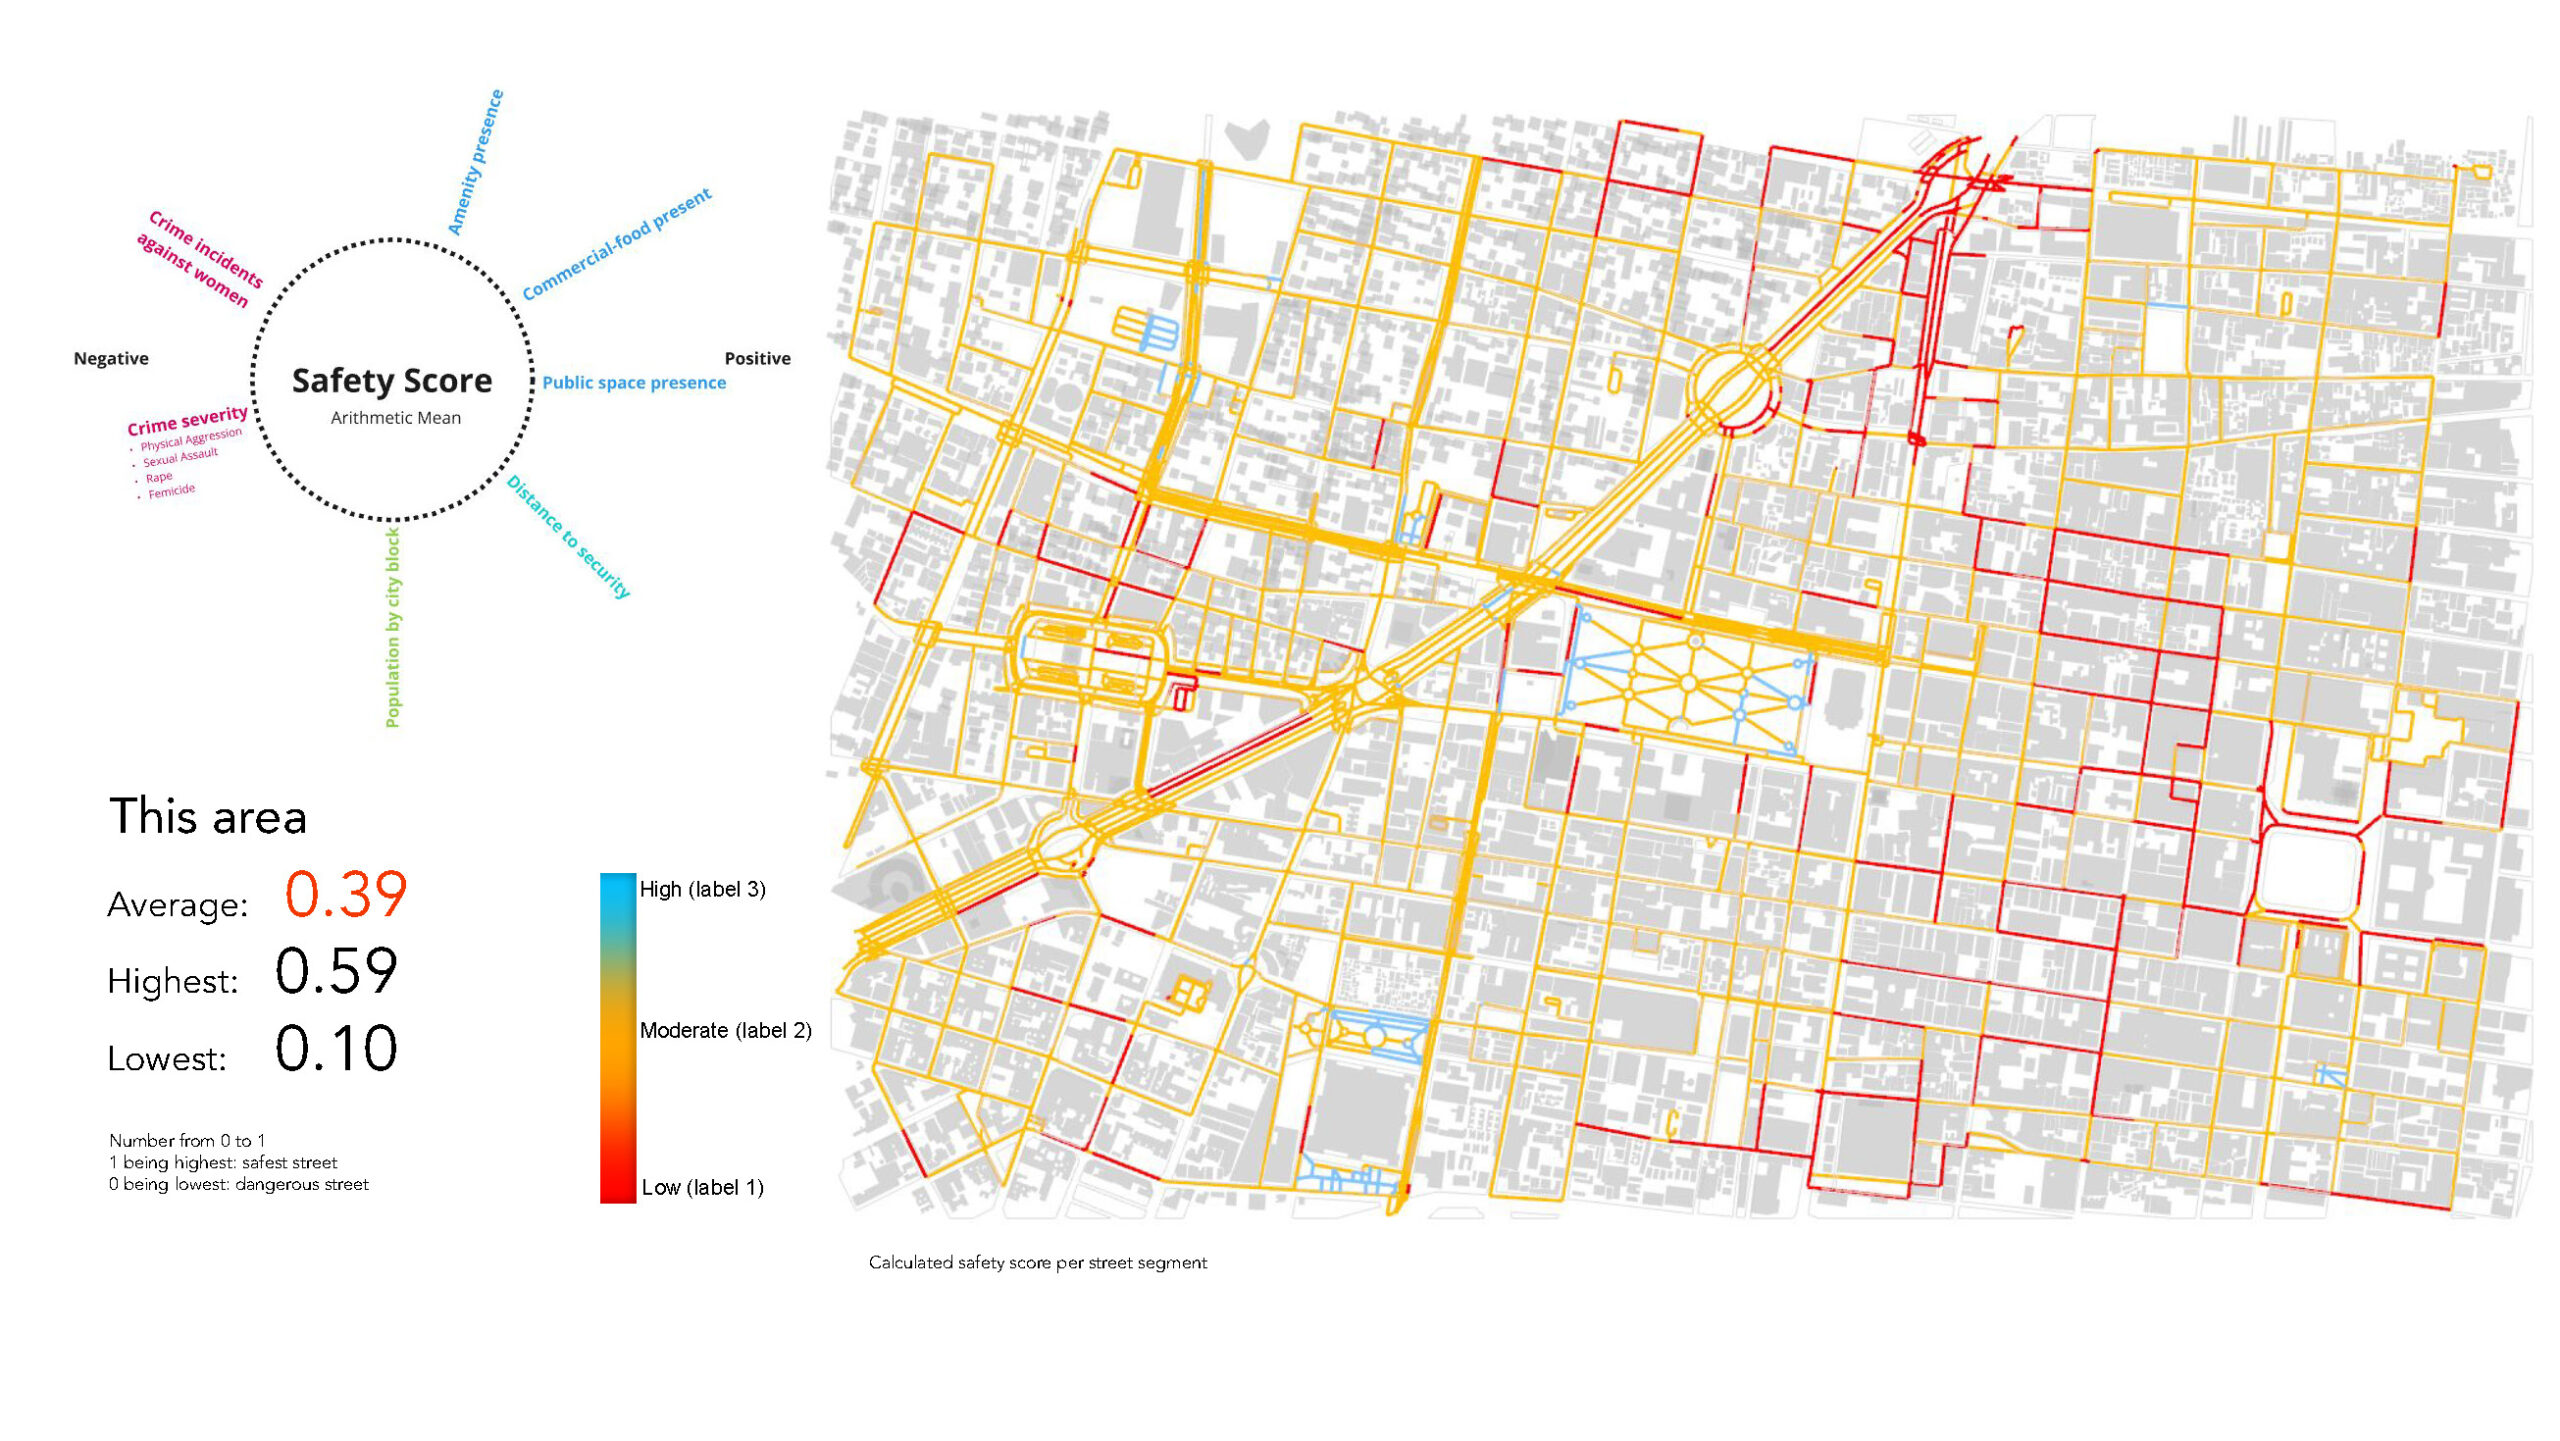
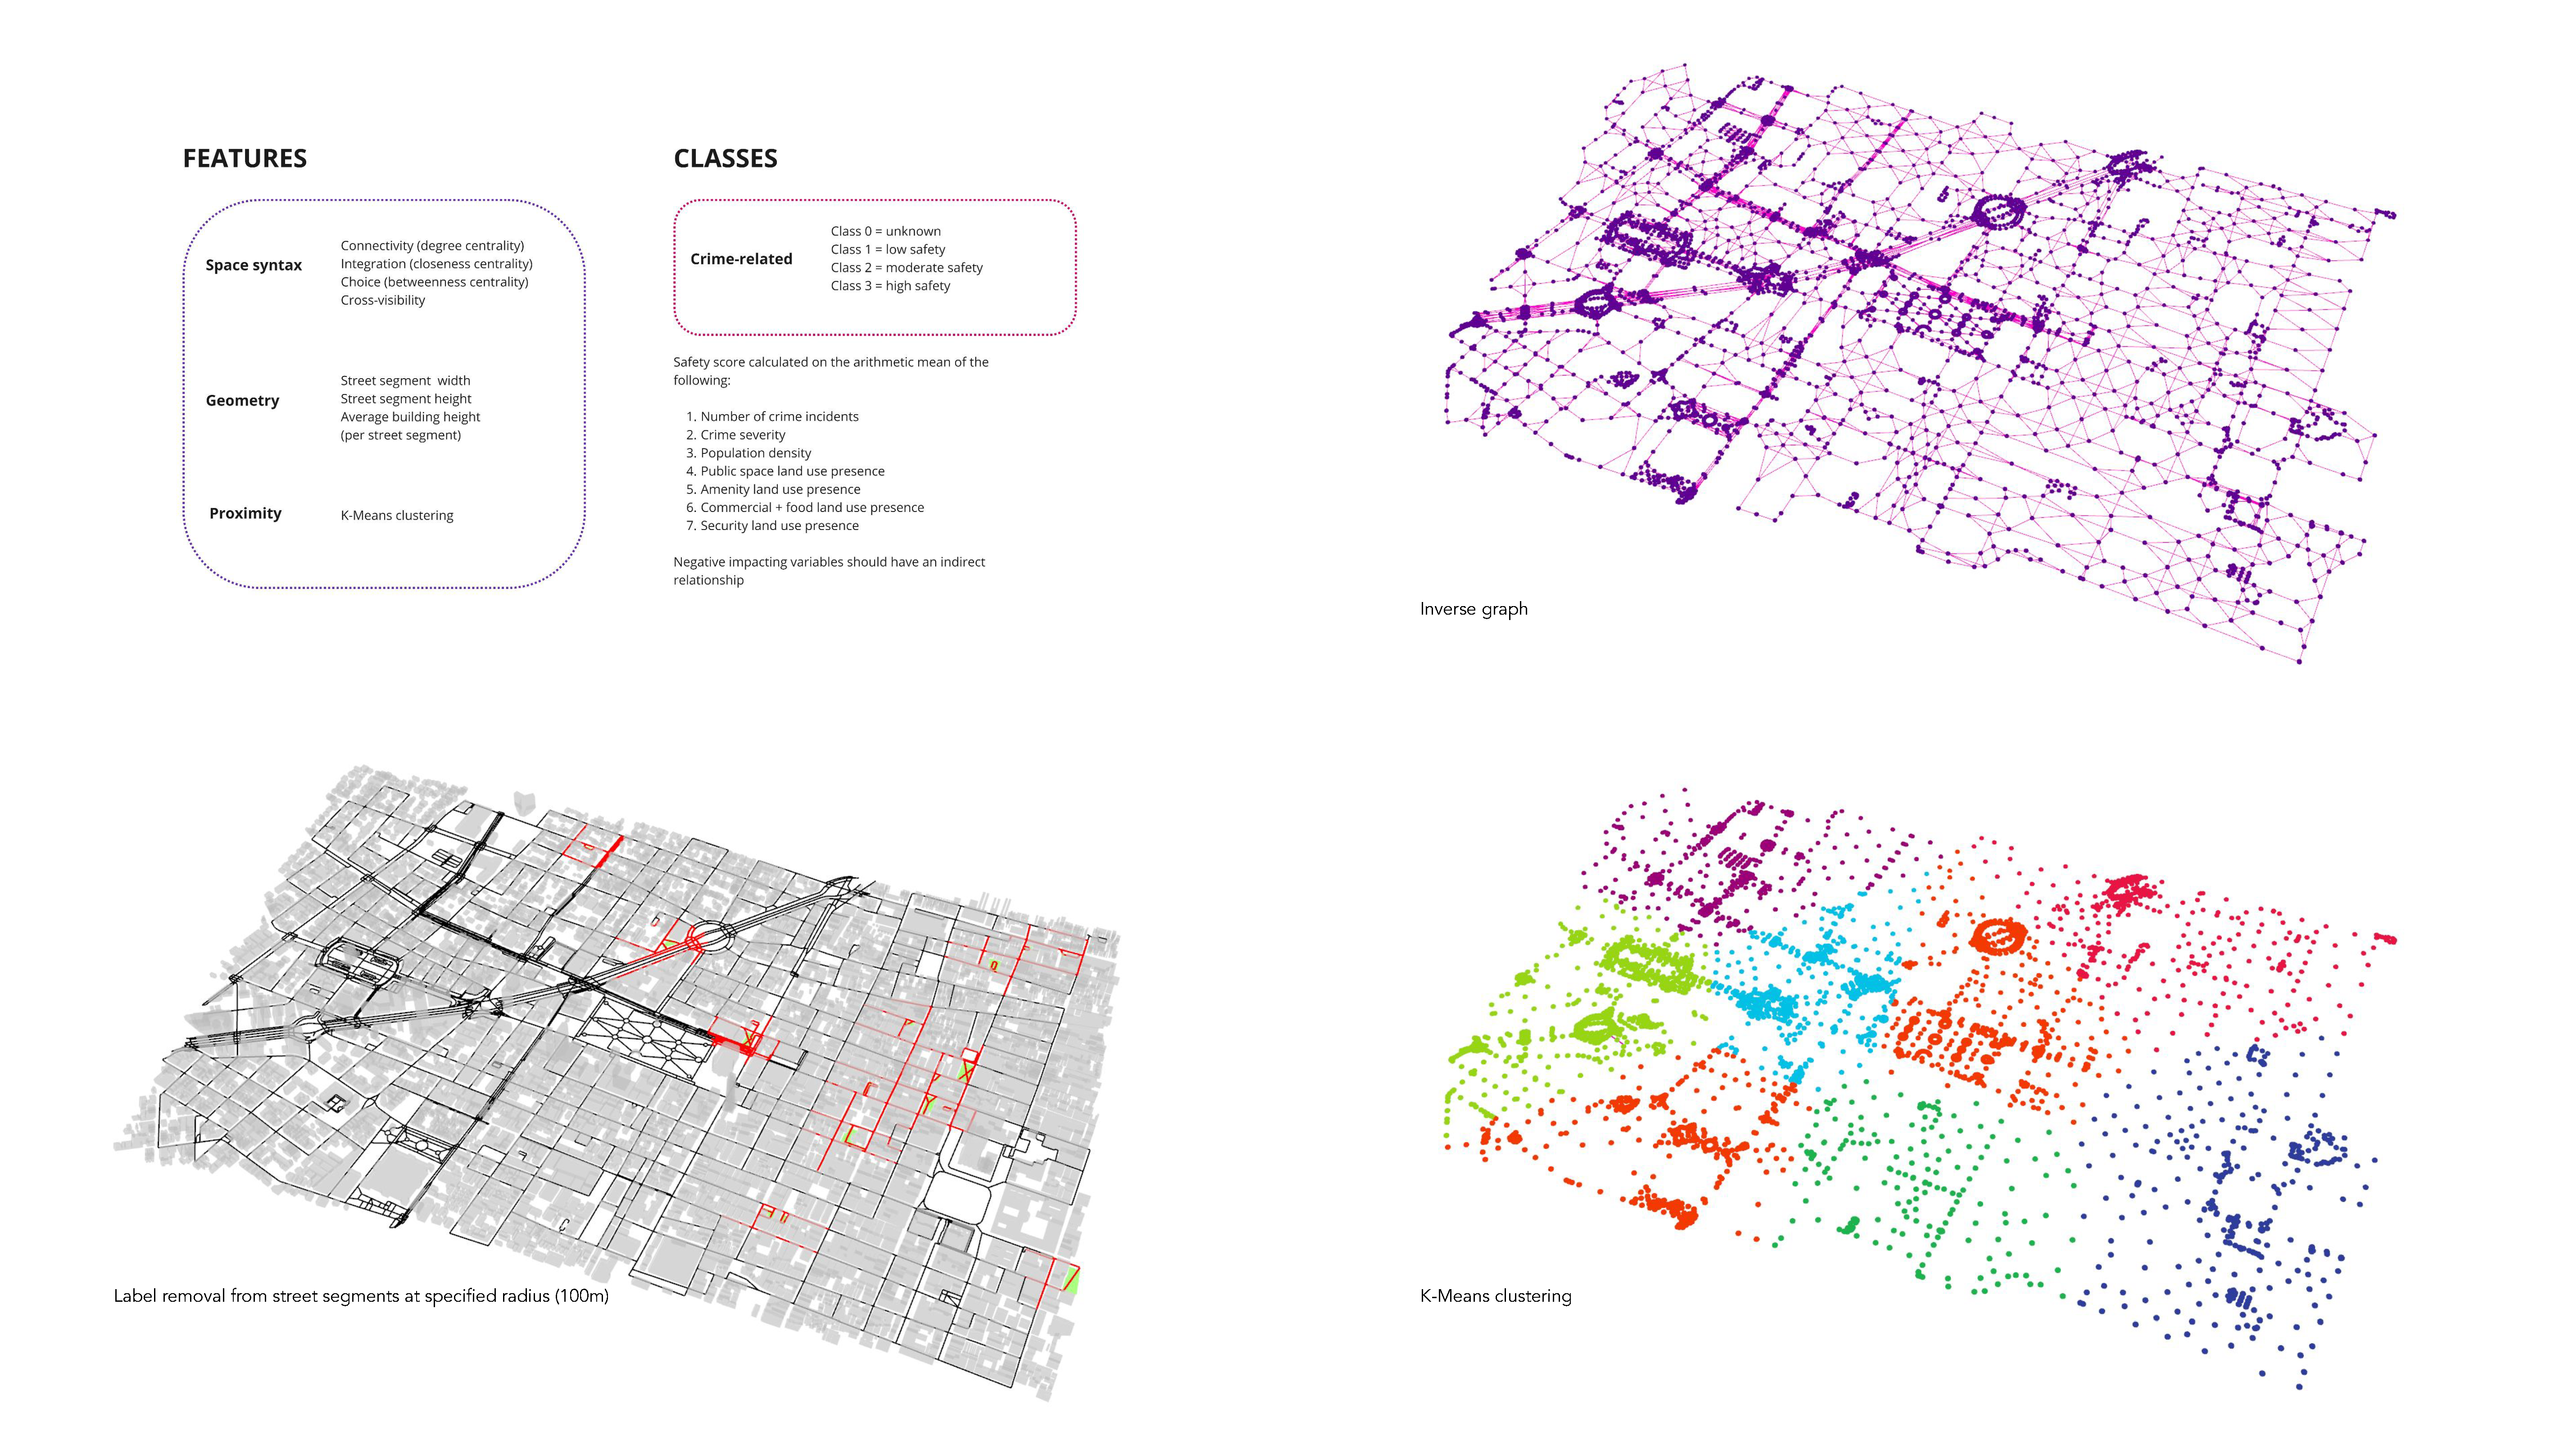
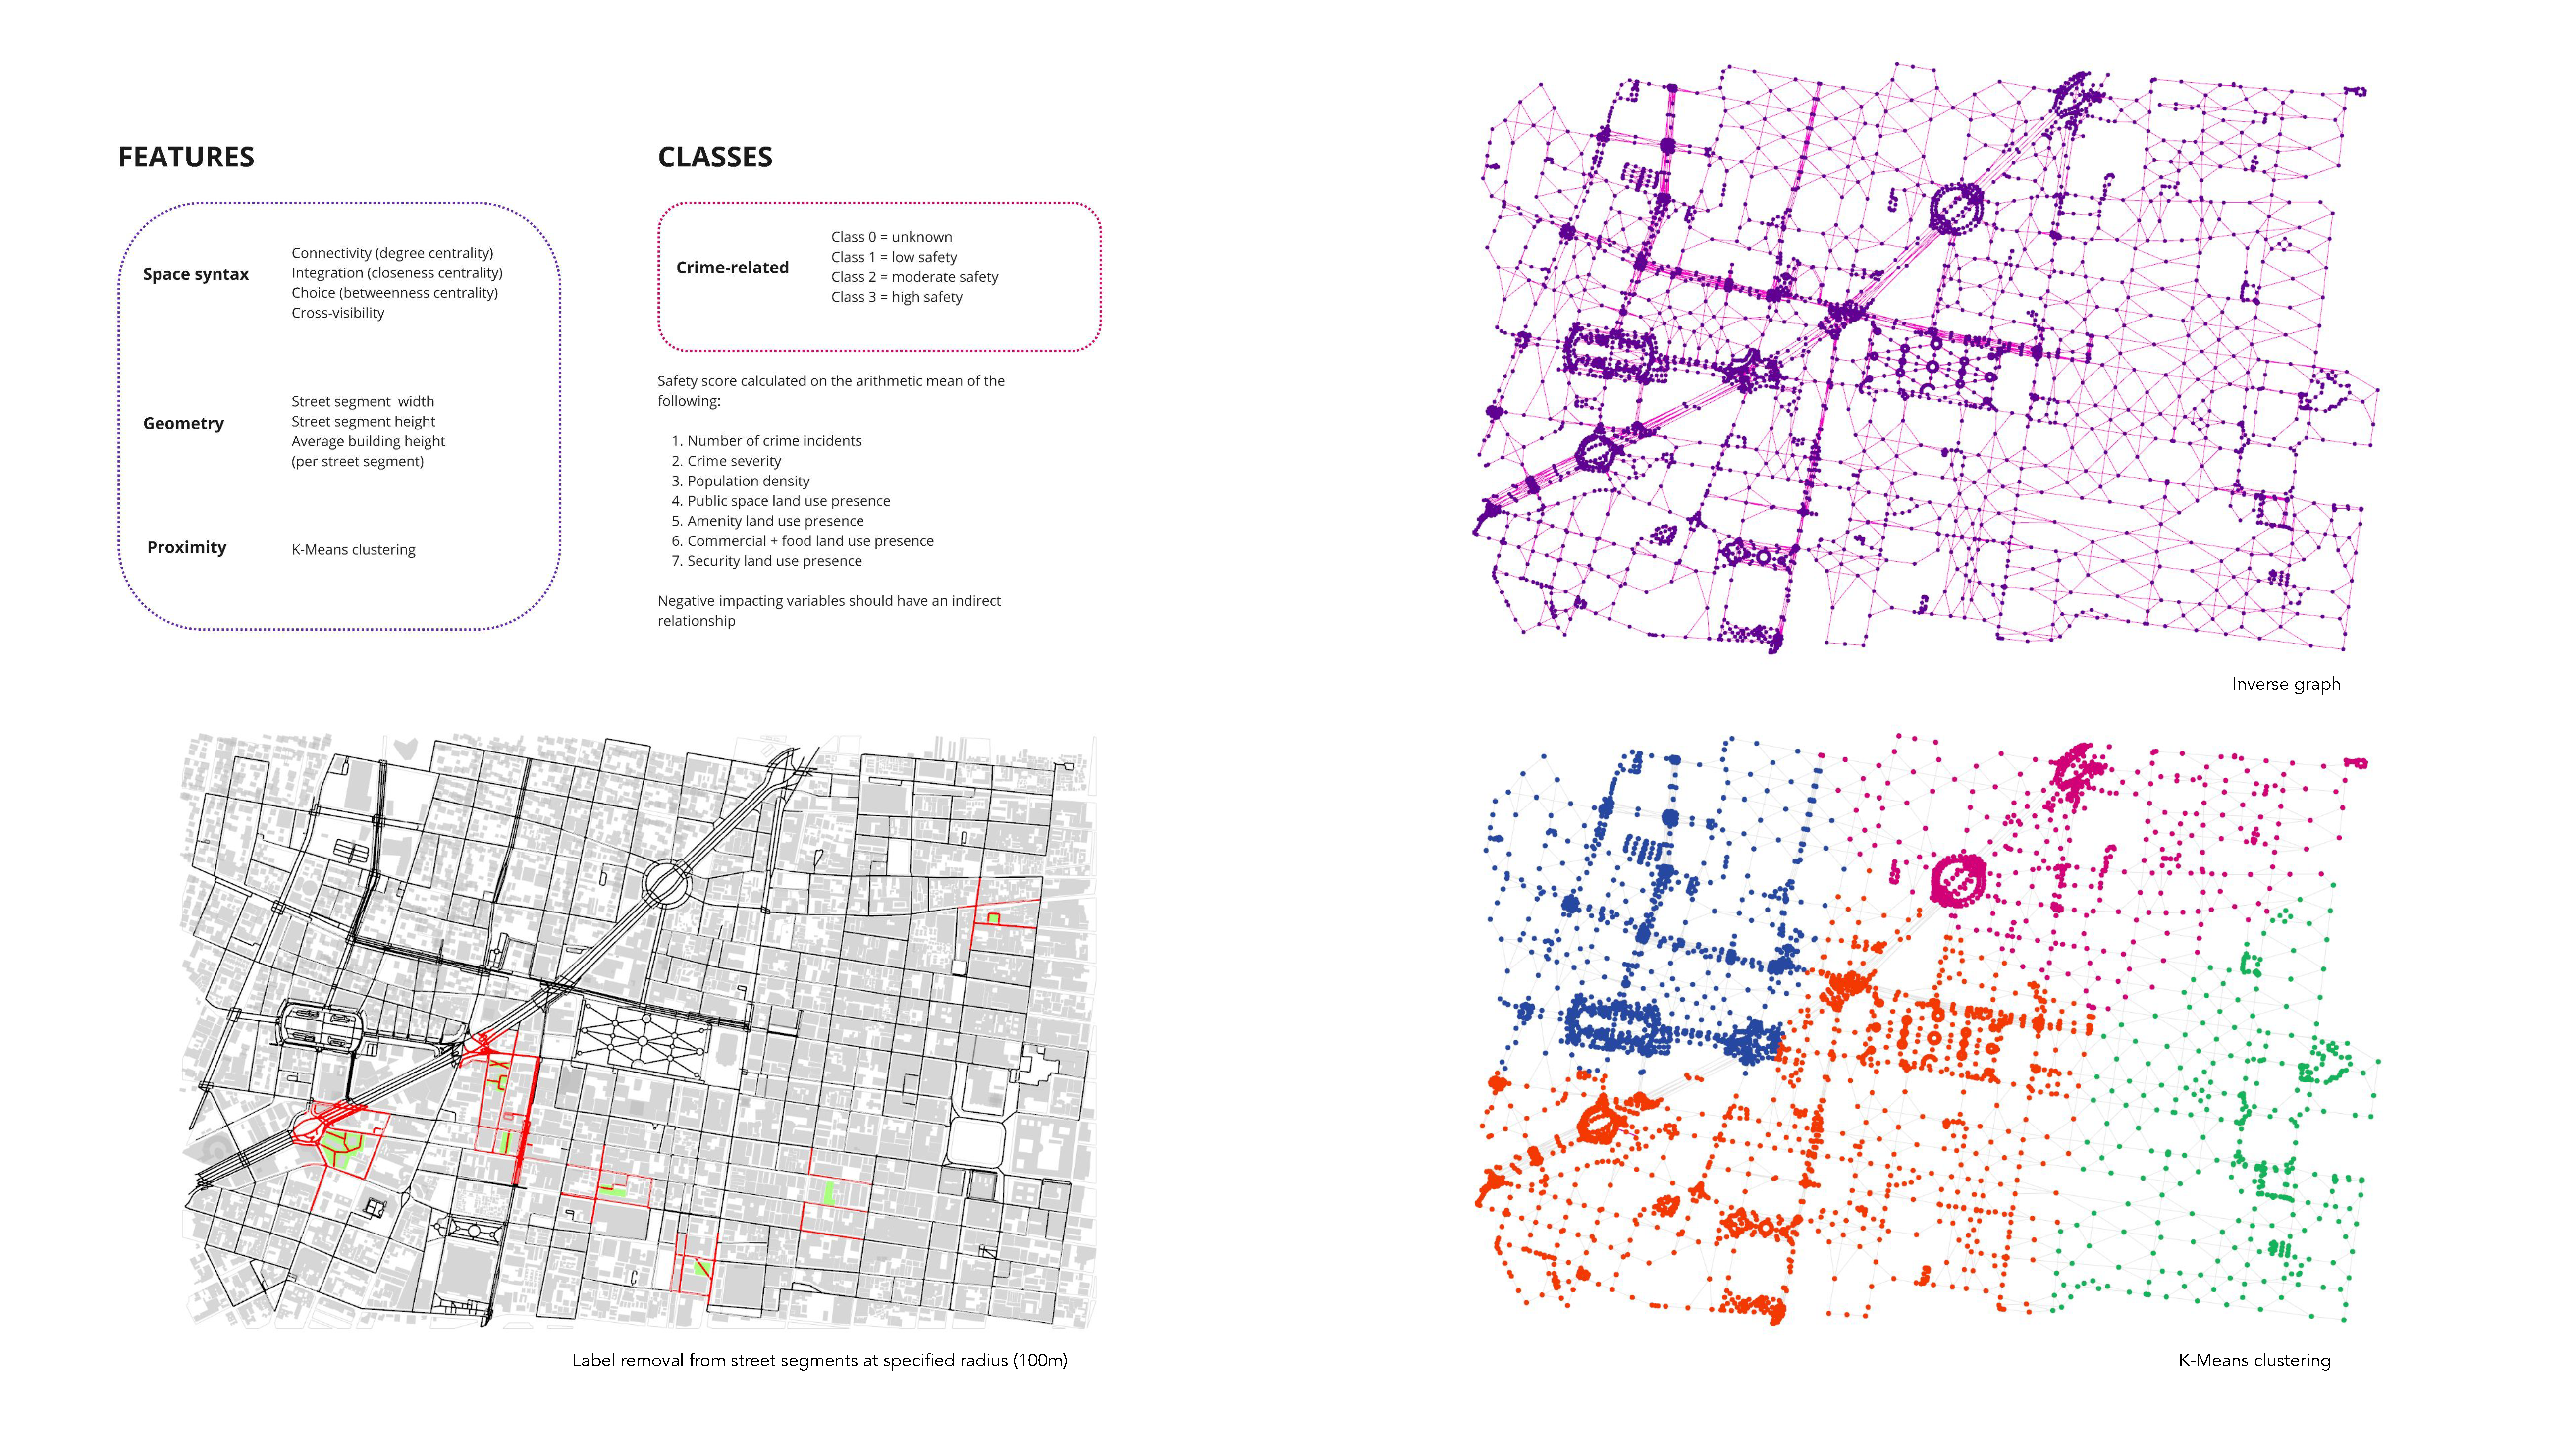
One of SafeNet’s key steps is the Safety Score. This metric assigns each street segment a score from 0 (most dangerous) to 1 (safest) based on crime data, land use, and population density. The Safety Score helps urban planners identify which areas are most at risk and which interventions could be most effective in improving safety.
- High Score (label 3): Indicates safer street segments.
- Moderate Score (label 2): Represents moderately safe areas.
- Low Score (label 1): Denotes high-risk areas.
In Mexico City’s Historic Downtown, the average Safety Score was 0.39, highlighting the significant safety challenges the city faces.
Linking Urban Design to Gender-Based Violence
SafeNet’s core hypothesis is that spatial configuration influences gender-based violence. By analyzing the city’s layout (its morphologic and topologic features) and integrating crime data, the project aims to pinpoint high-risk areas and suggest interventions that improve safety. To achieve this, SafeNet employs a four-phase methodology:
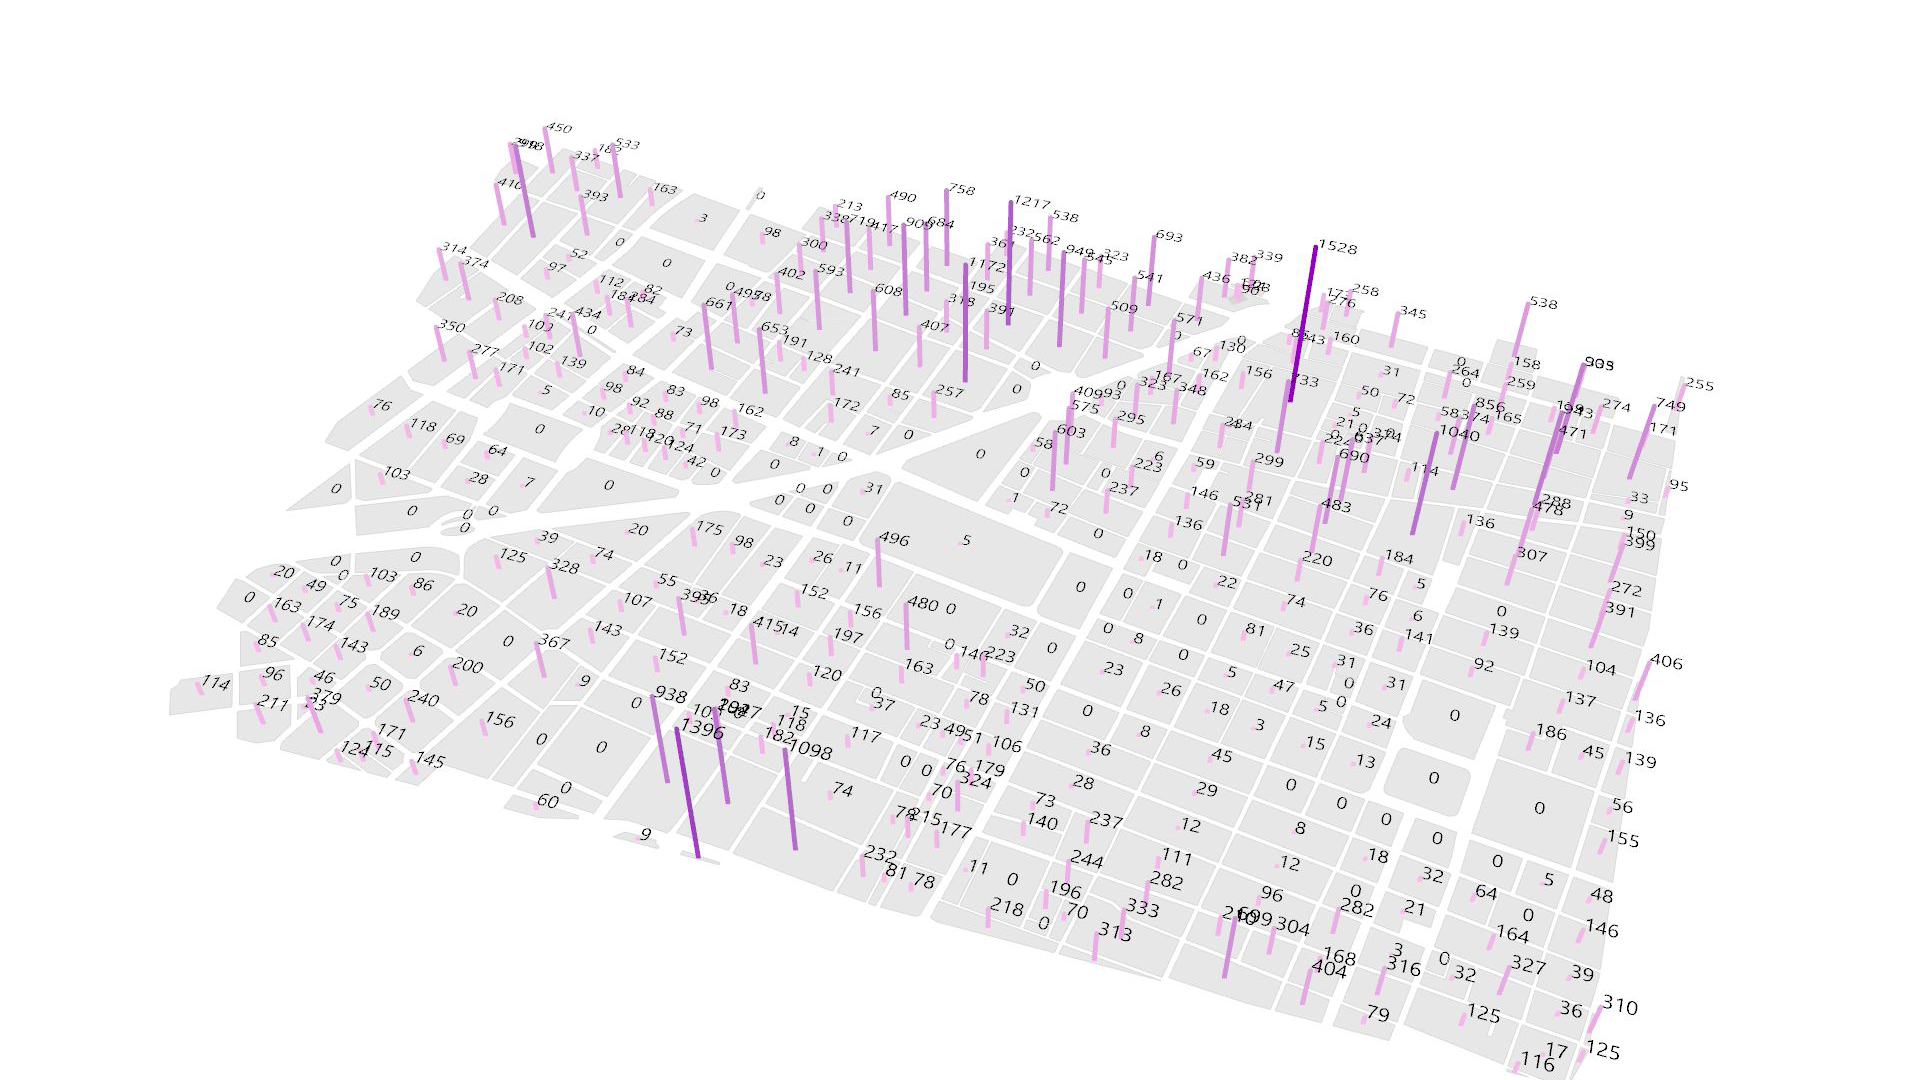
- Data Gathering: Crime data, population density, land use, and other urban data were collected to create a detailed database.
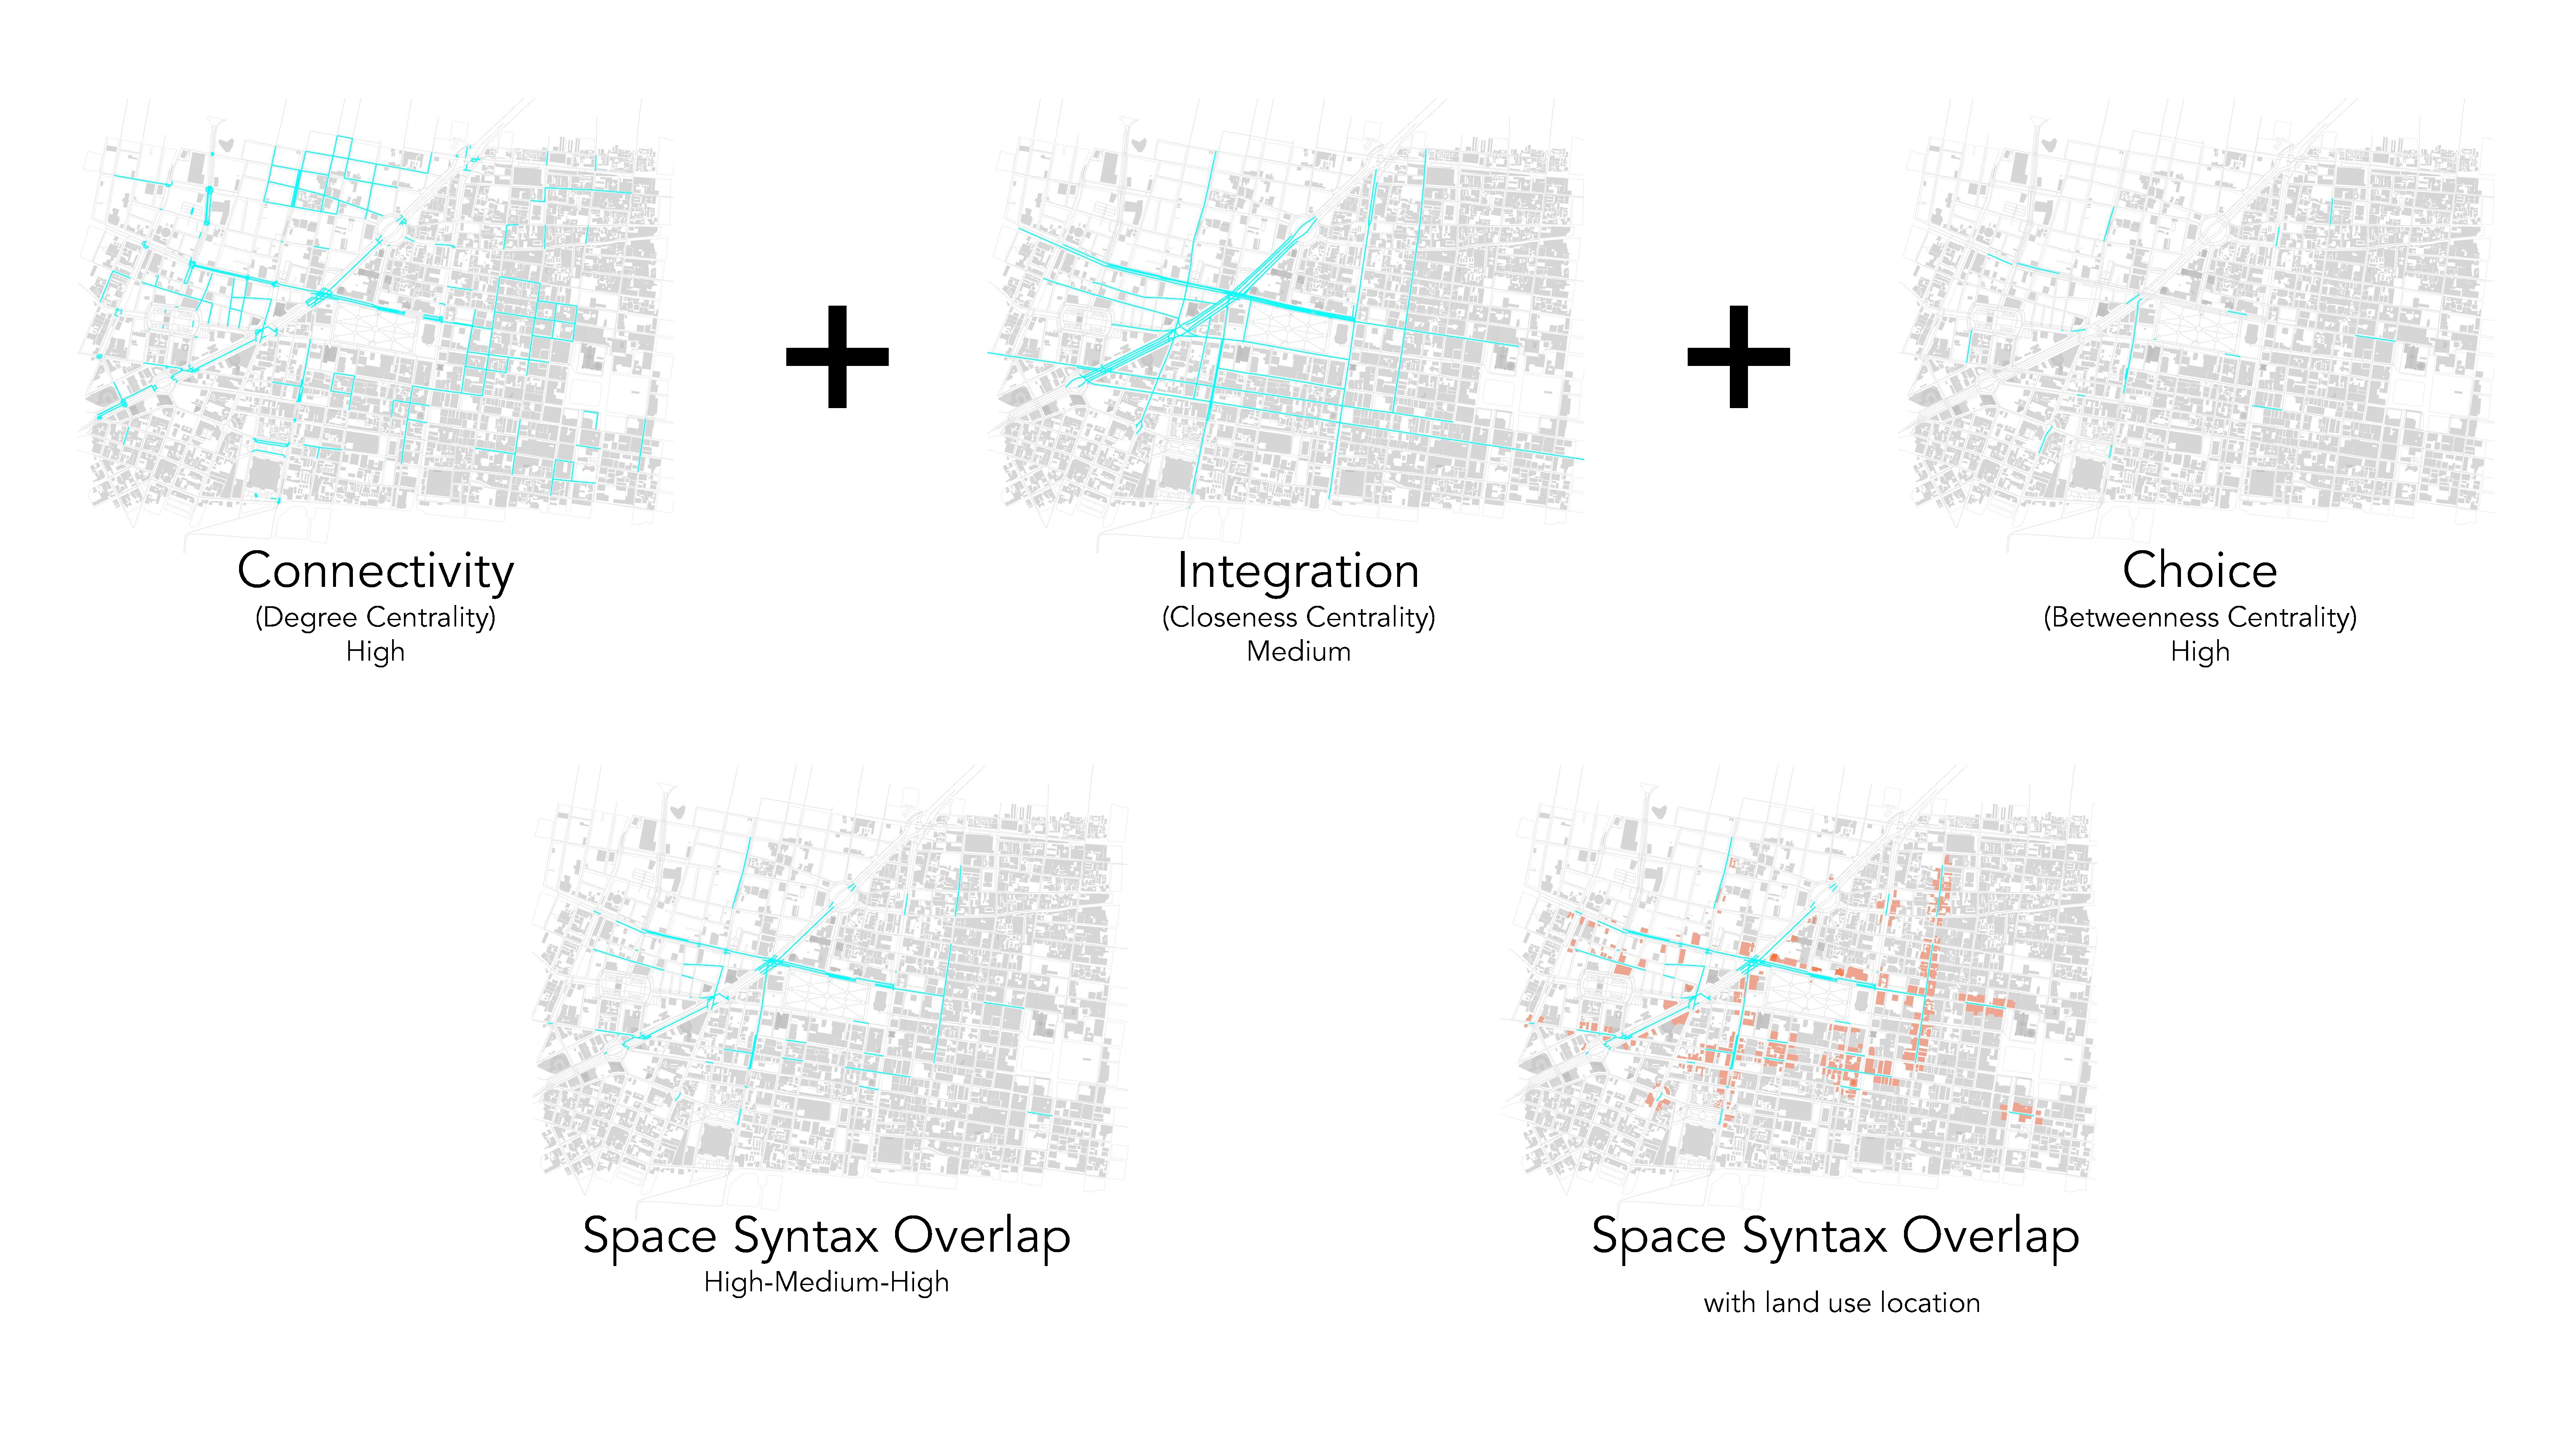
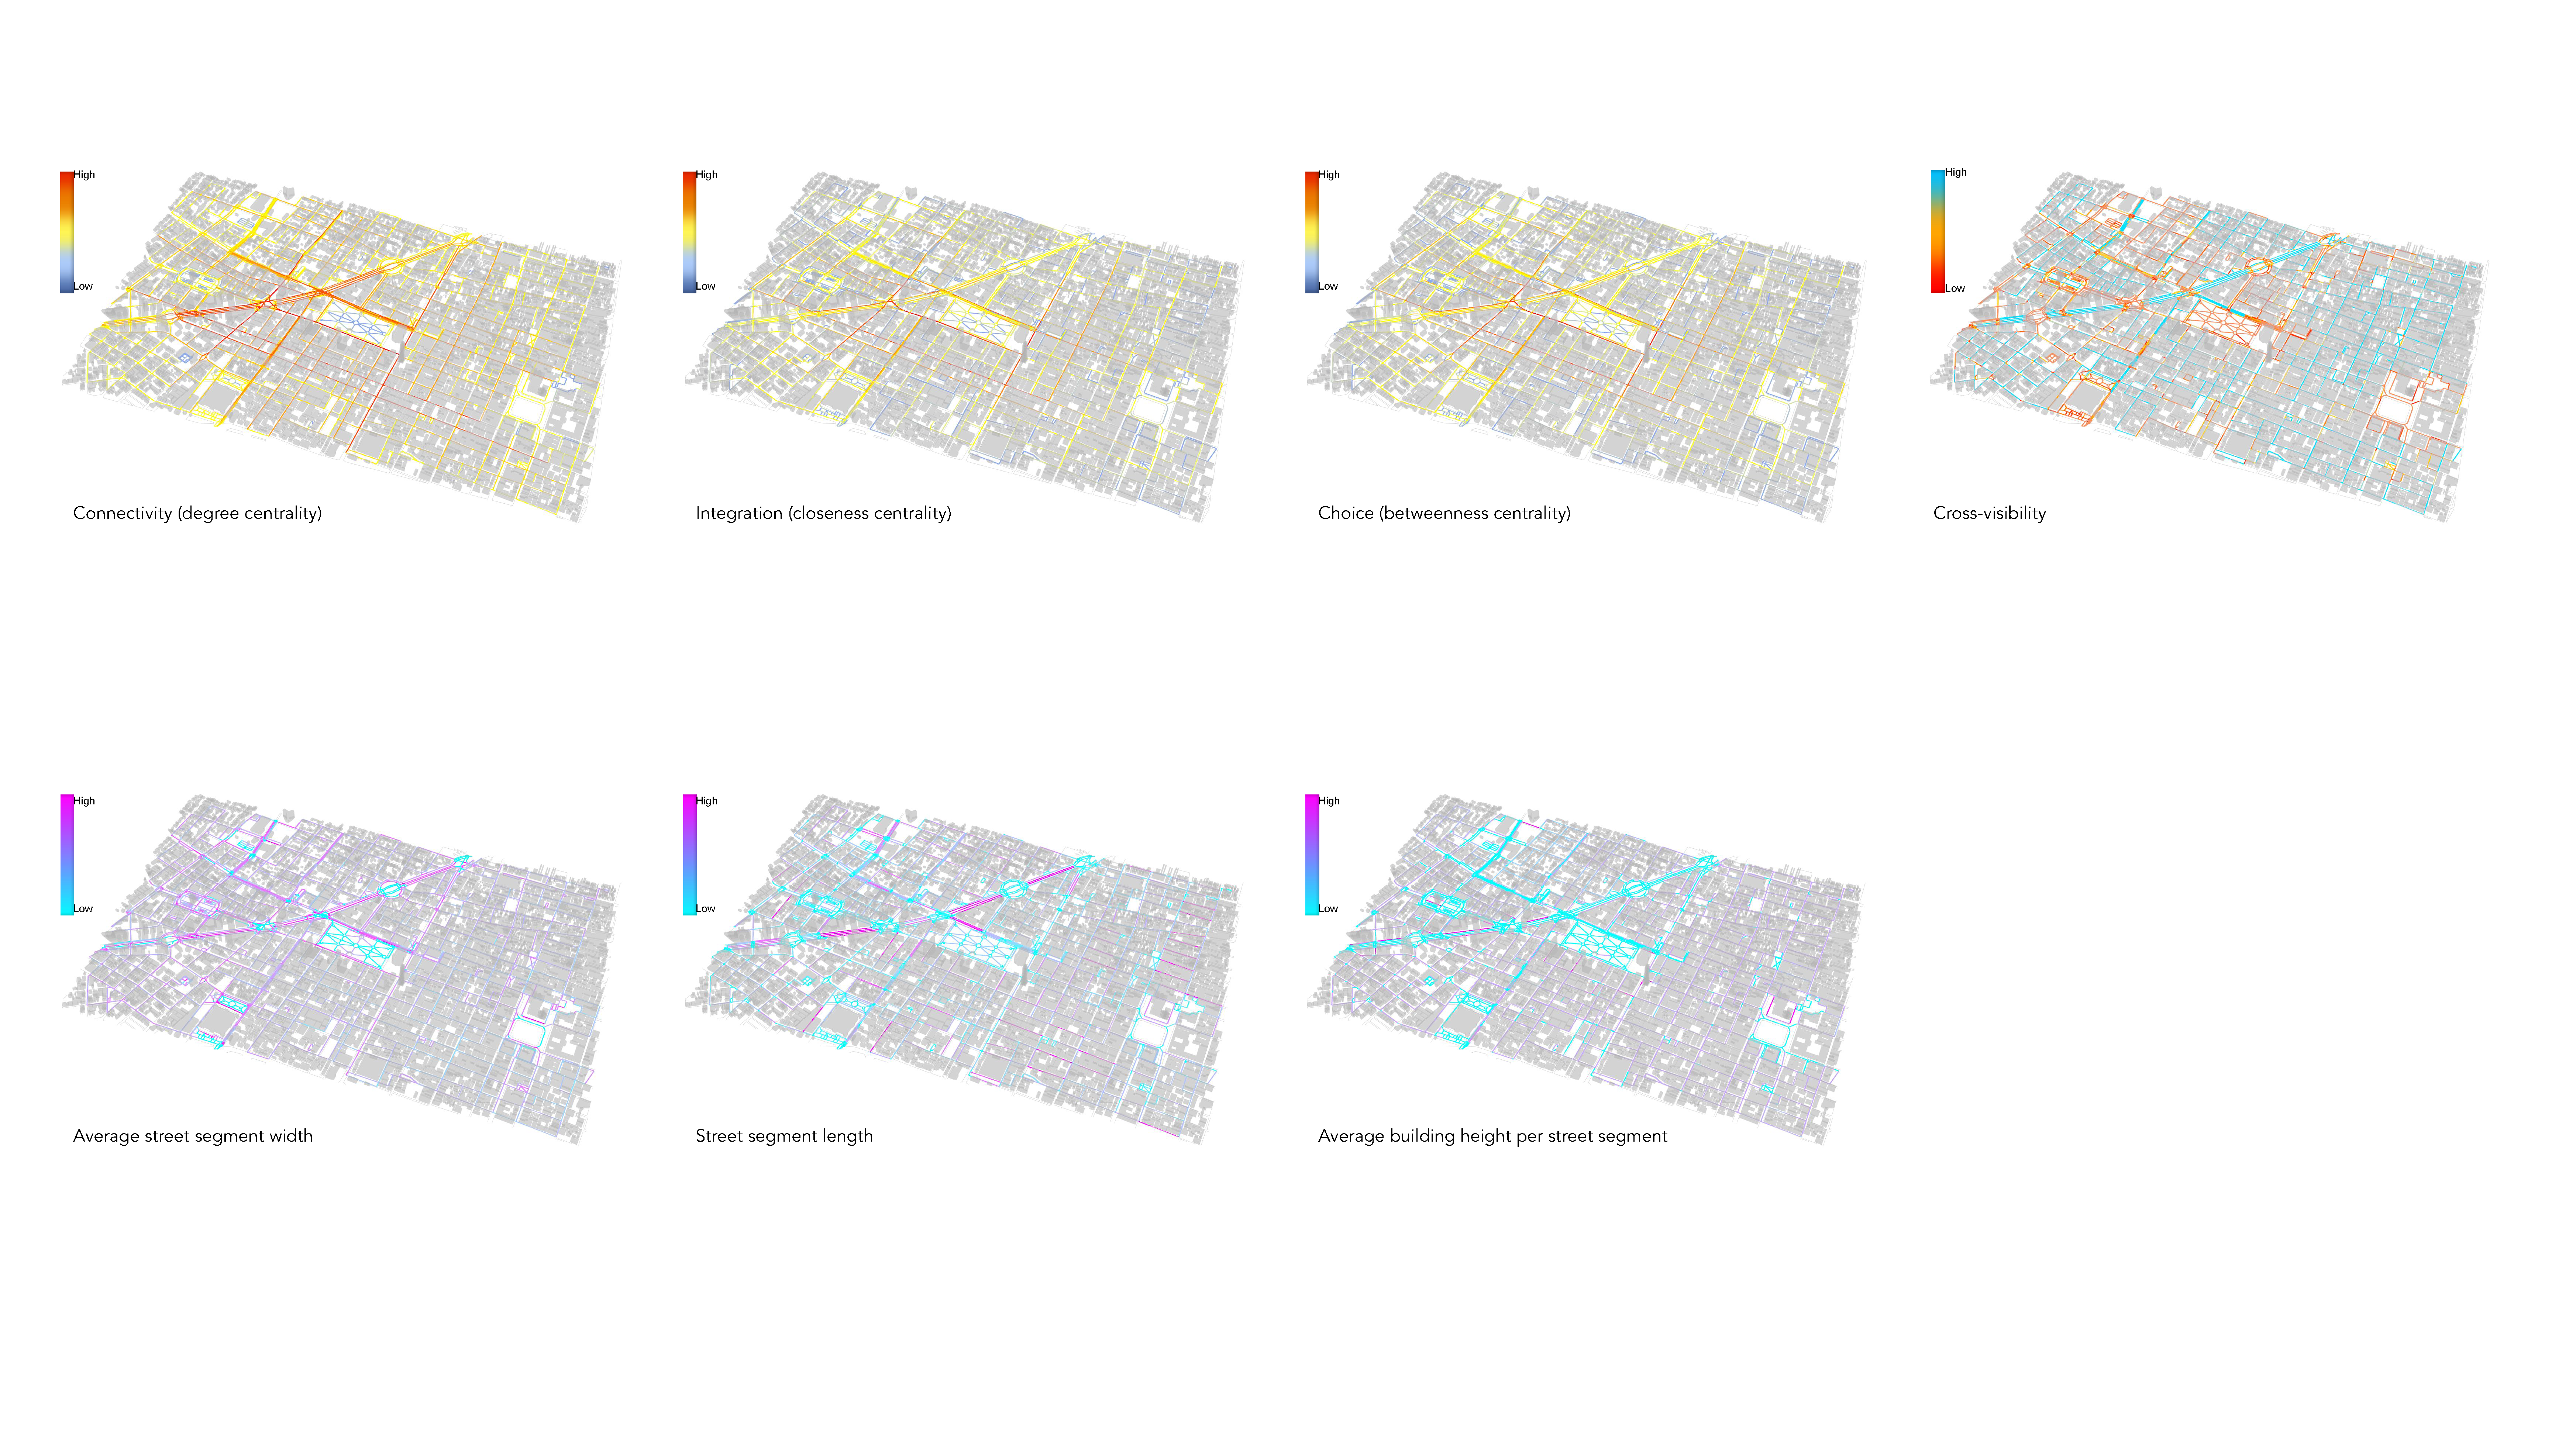
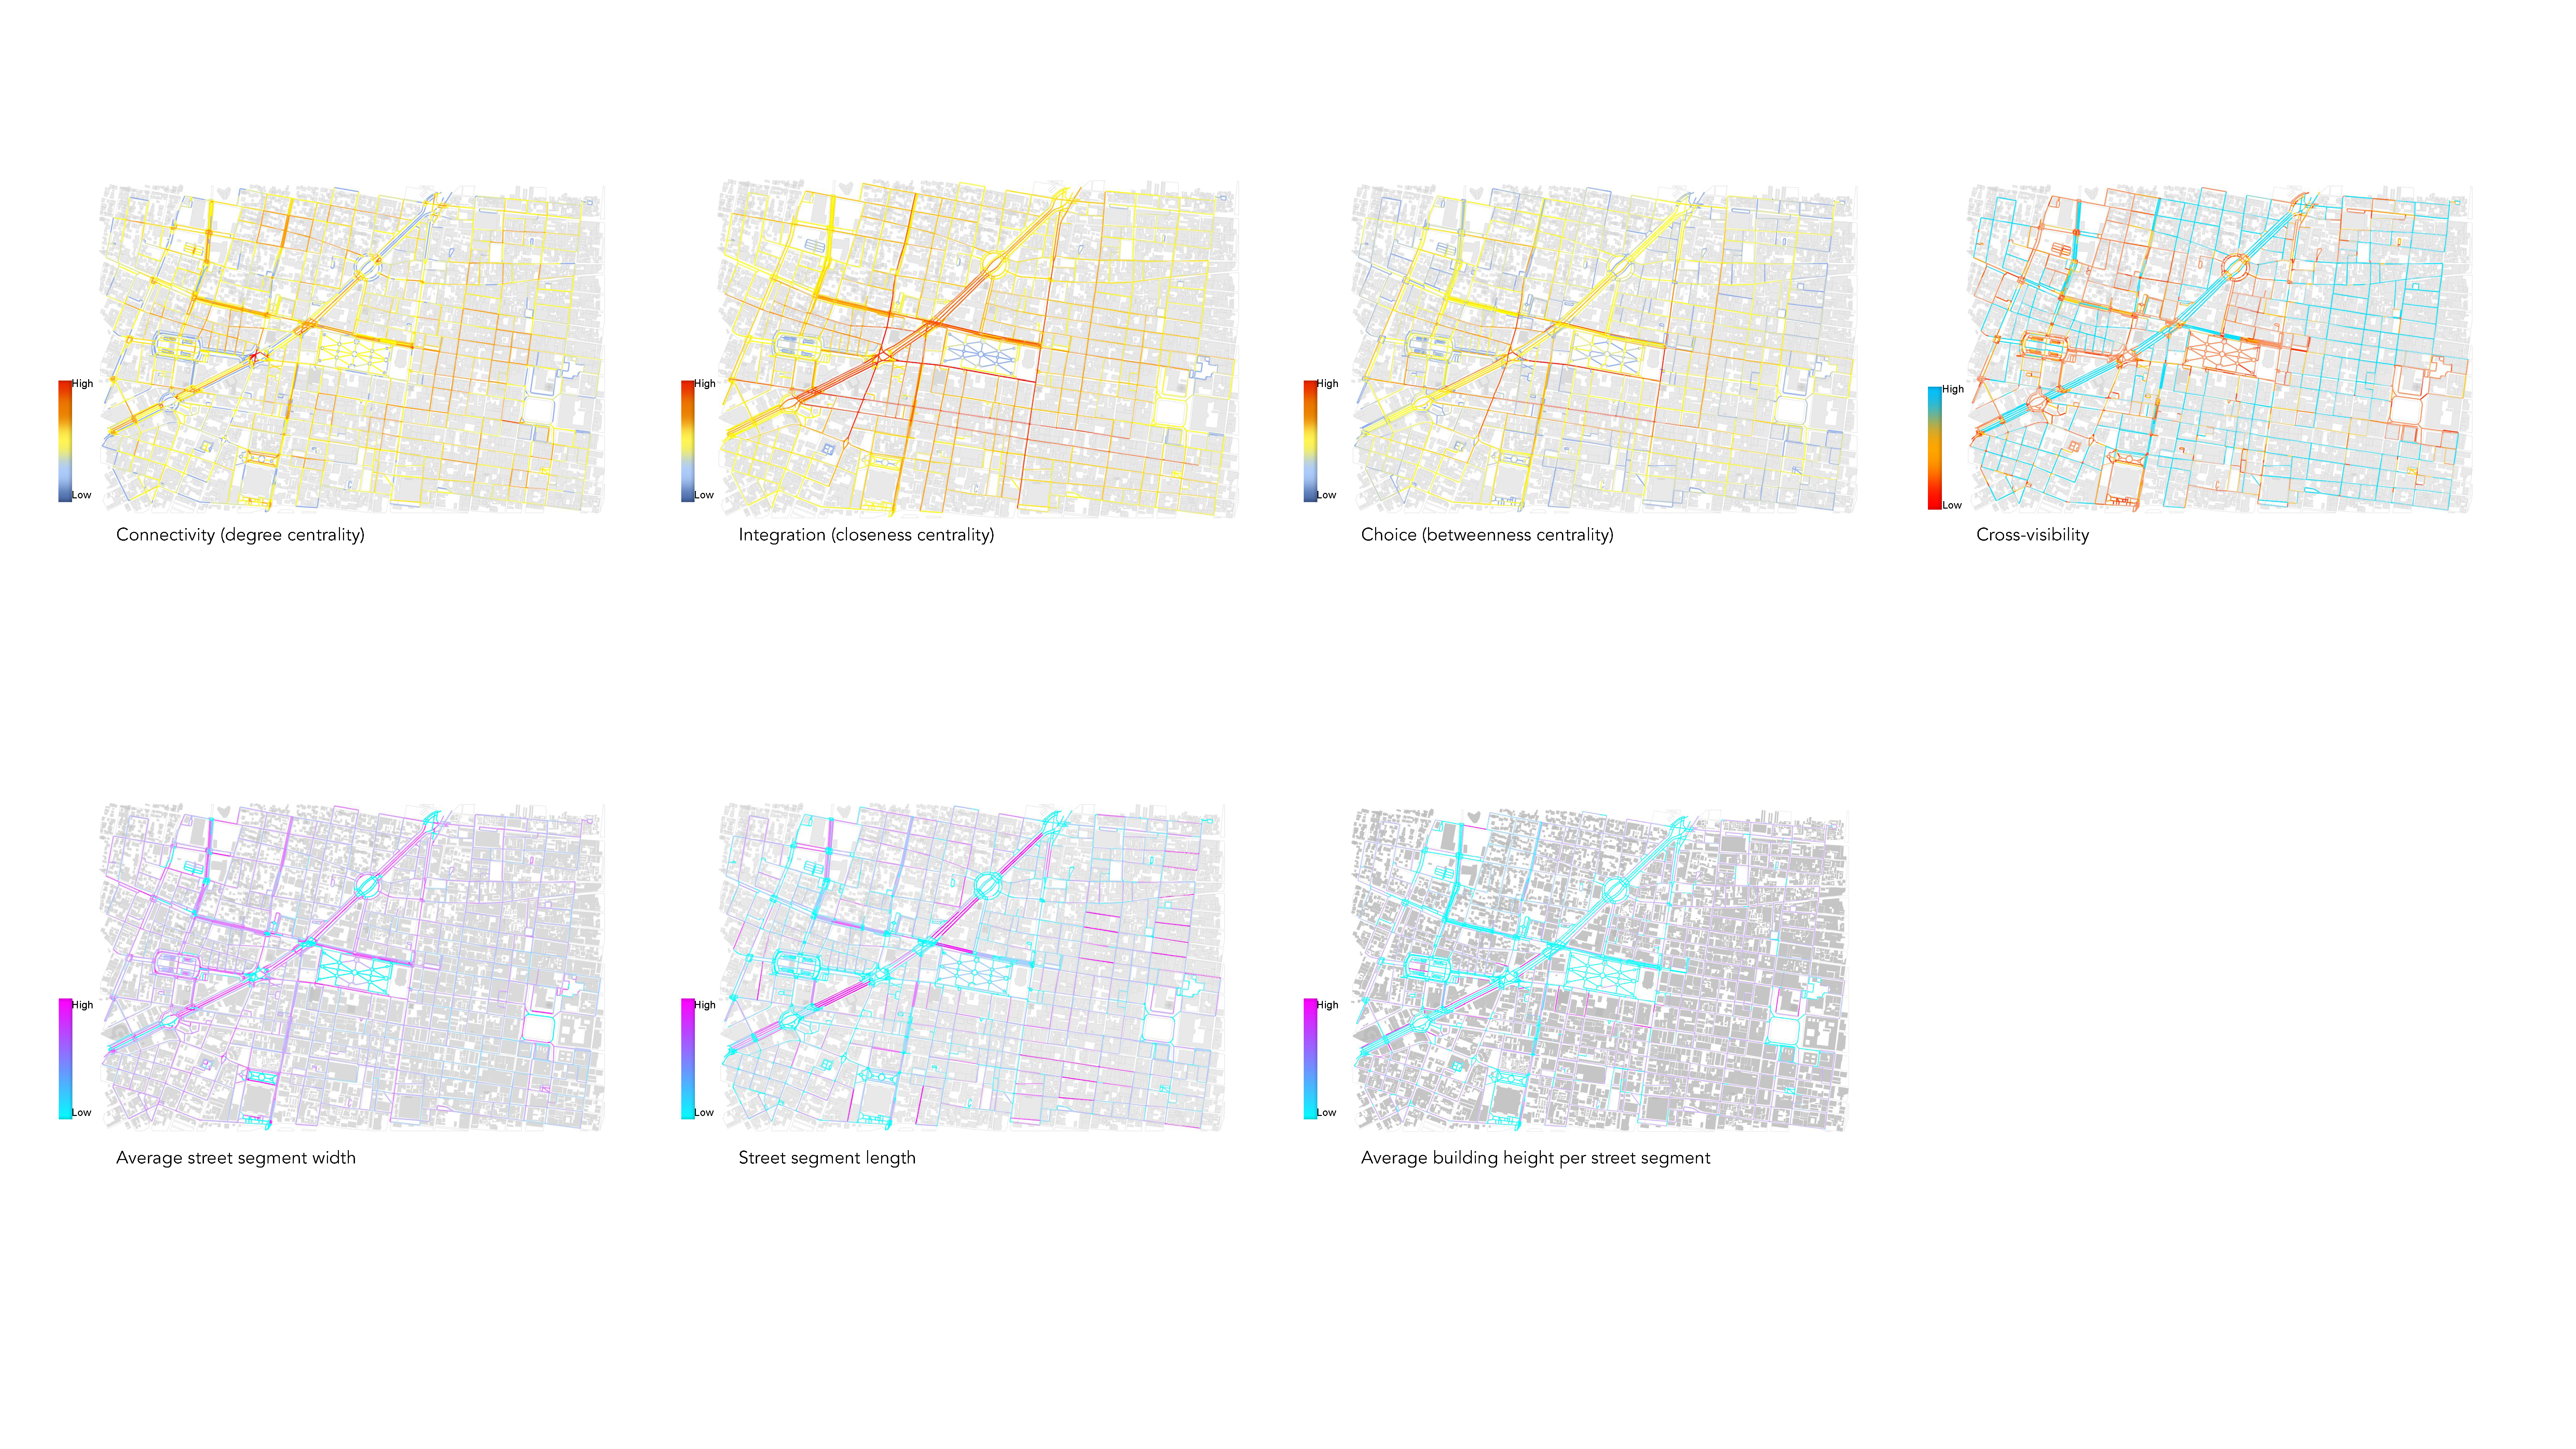
- Space Syntax Analysis: Space Syntax metrics such as connectivity, integration, and choice were applied to understand the relationship between urban layout and violence.
- Graph Machine Learning (GML): GML was used to predict safety outcomes based on different urban interventions.
- Testing Interventions: A range of interventions—such as changes to street layouts, lighting, and public spaces—were tested using machine learning models.
The Challenge: Analyzing Urban Safety in Complex Environments
Mexico City’s Historic Downtown presents a unique set of challenges. It’s a dense, high-crime area that blends historical landmarks, government offices, and unsafe neighborhoods. Collecting accurate crime, land use, and population data was the first hurdle, and much of this information had to be manually gathered due to incomplete or outdated records.
At the heart of the problem is the question: Can urban design reduce violence against women? SafeNet seeks to answer this through machine learning, spatial analysis, and urban interventions.
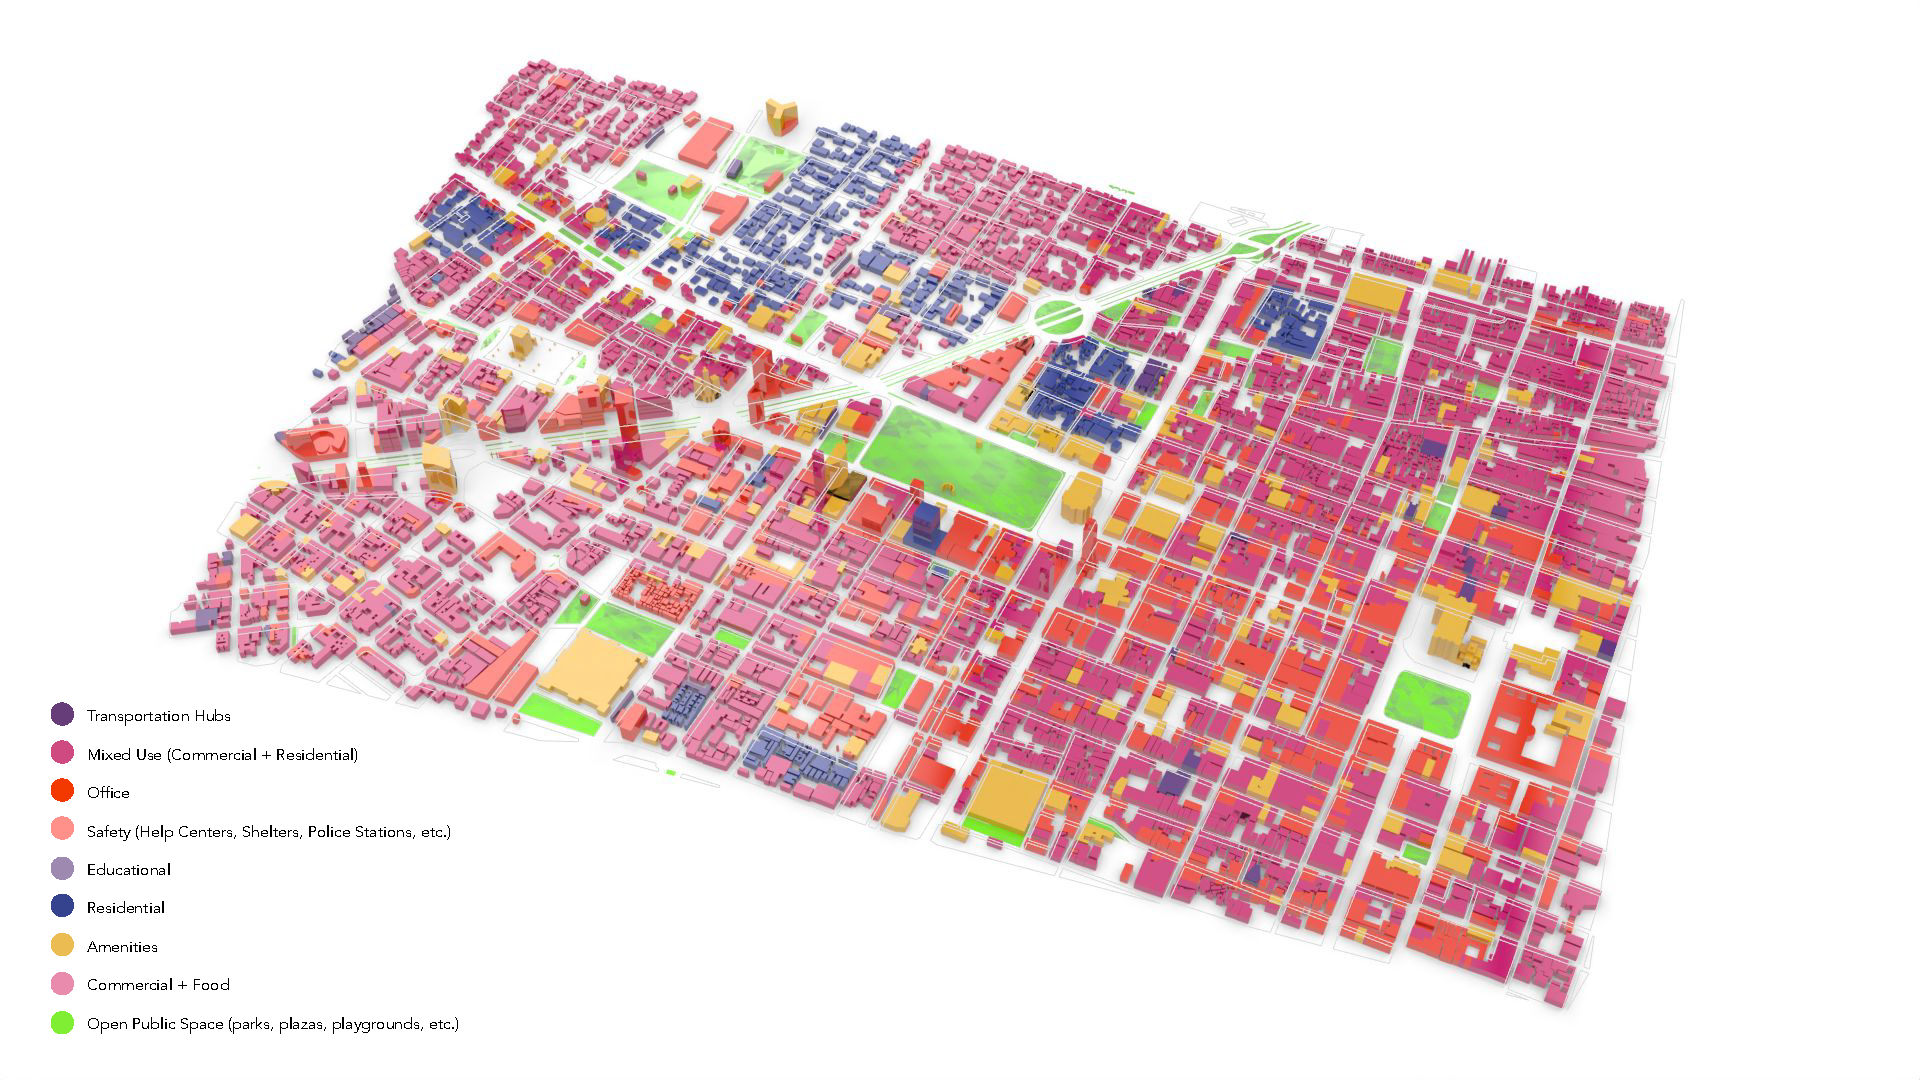
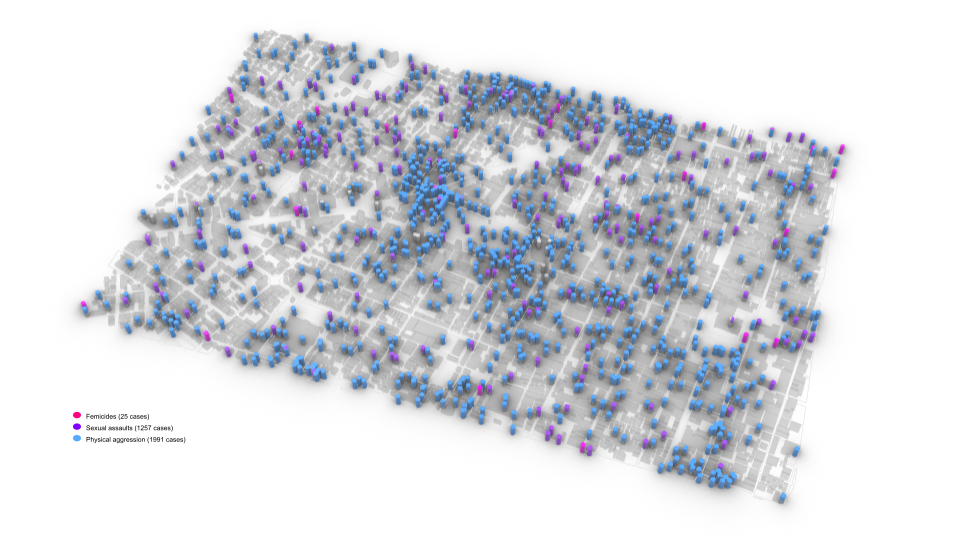
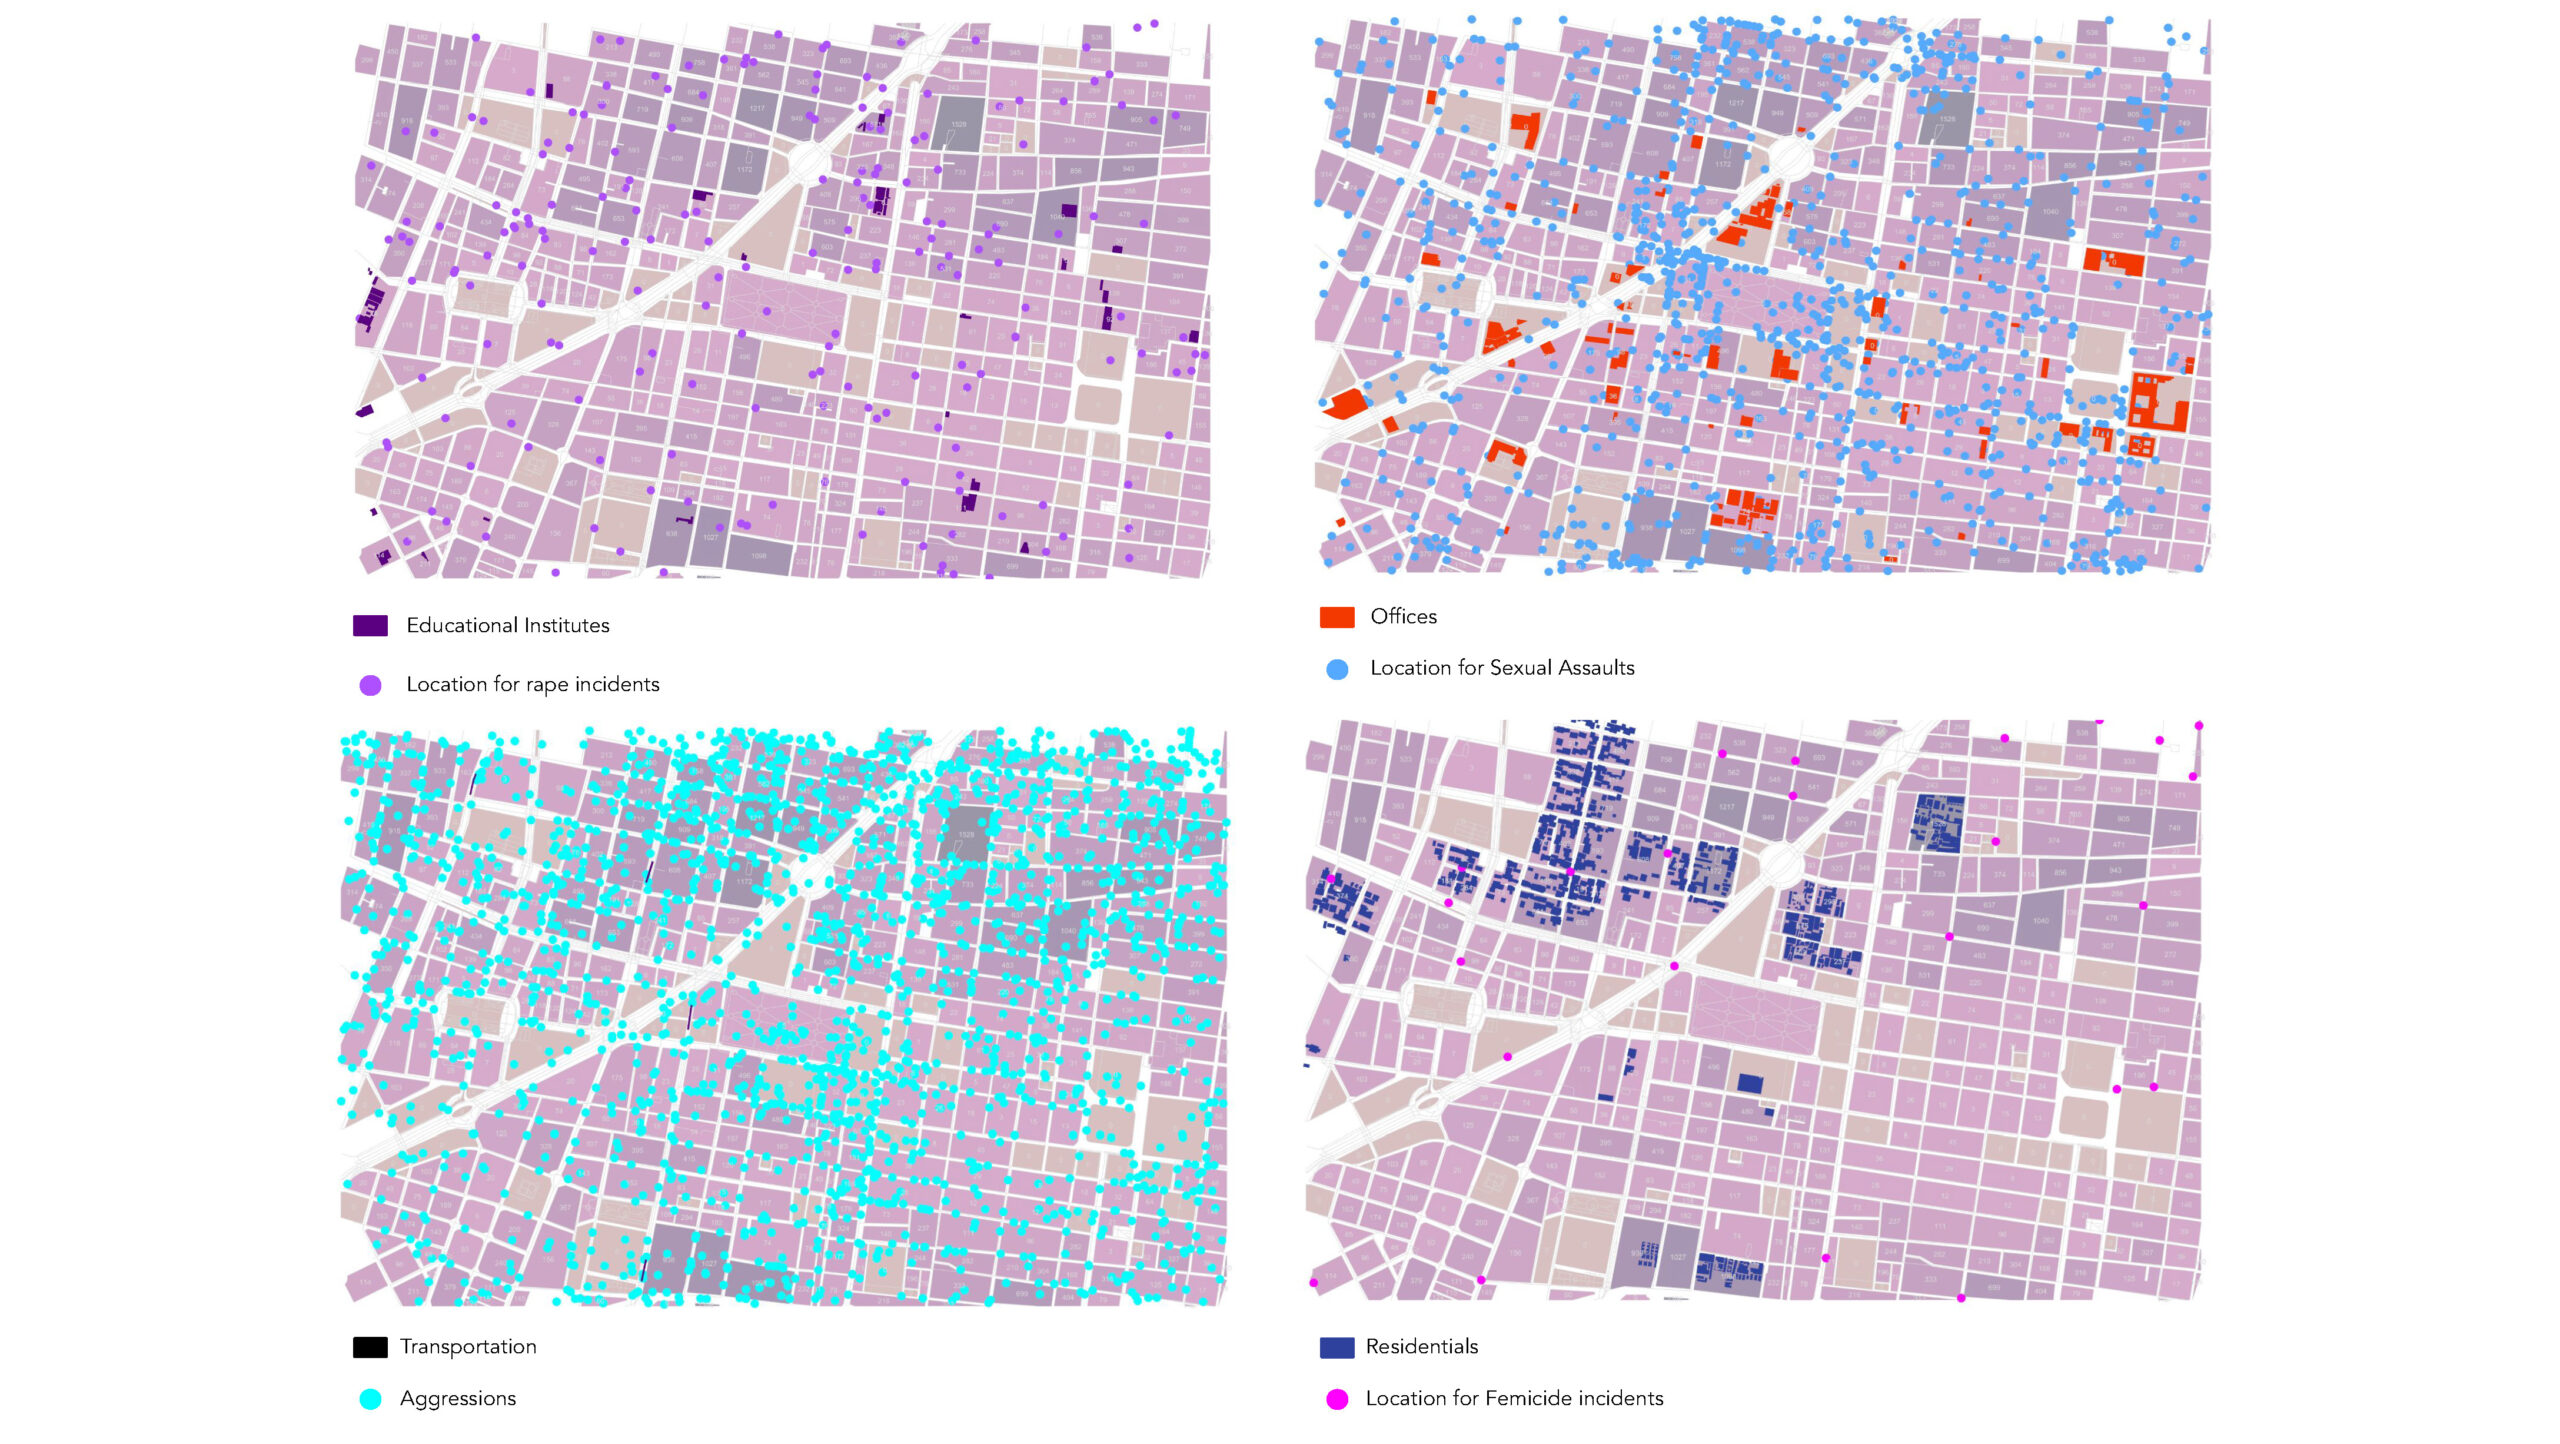
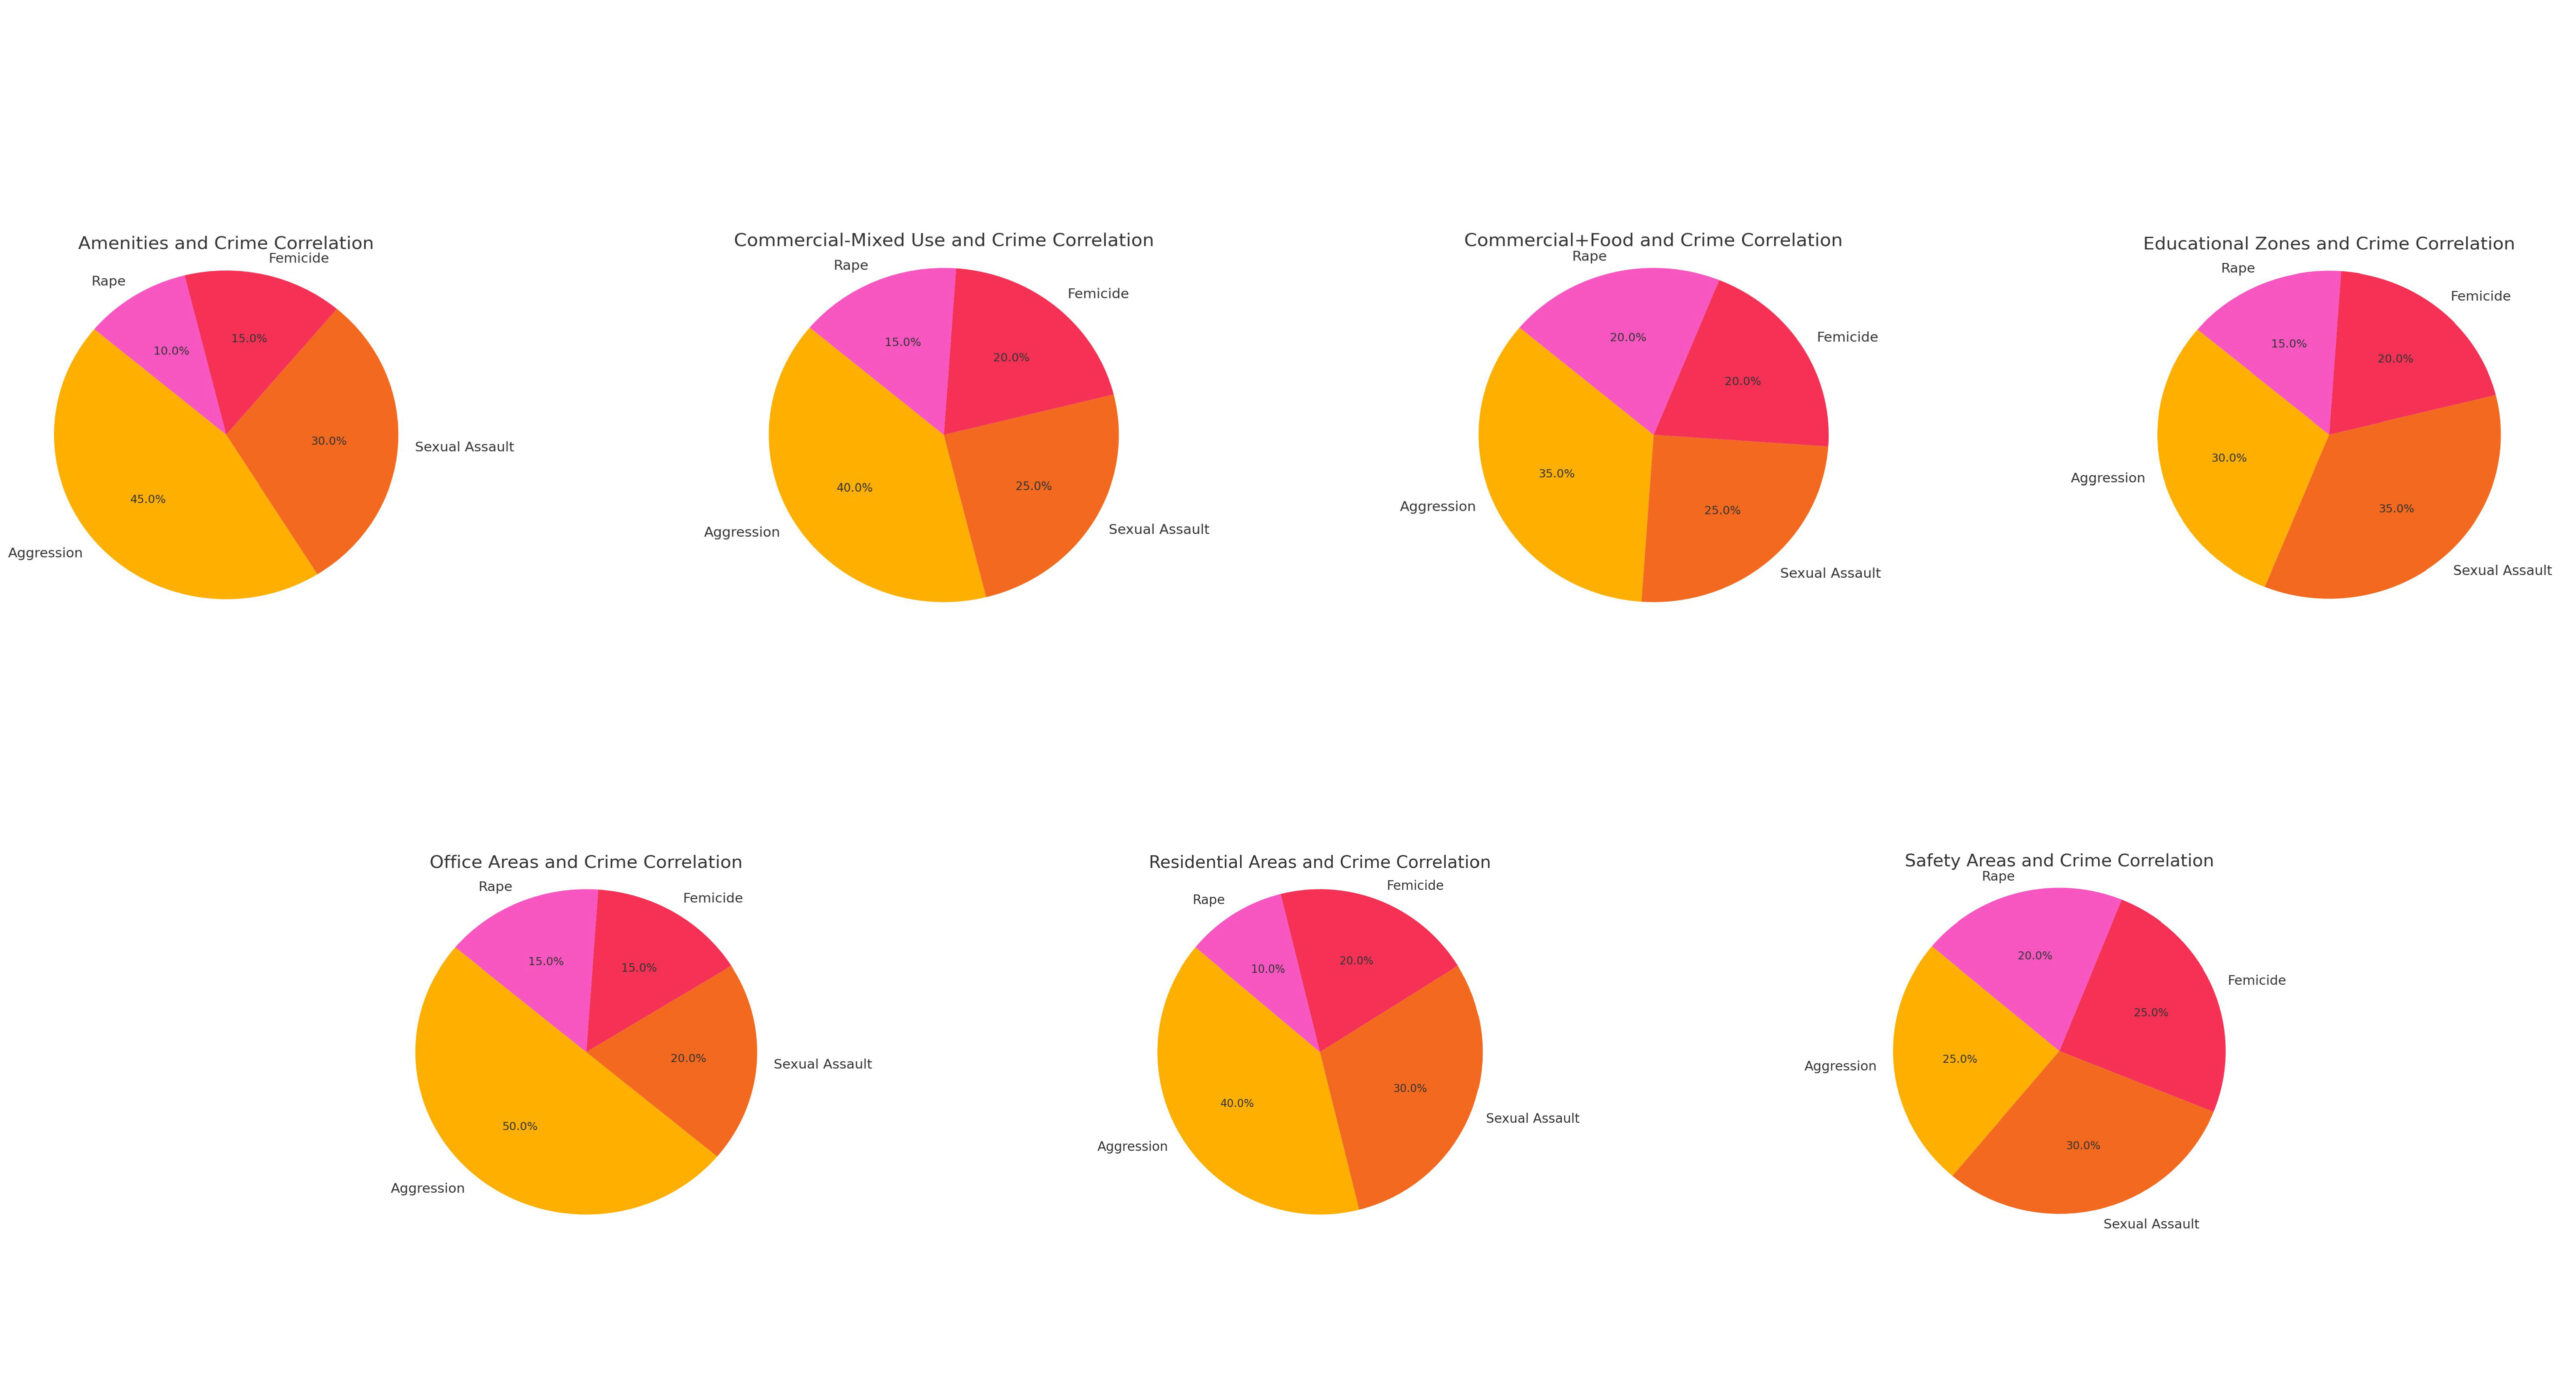
Impact of Land Use on Crime
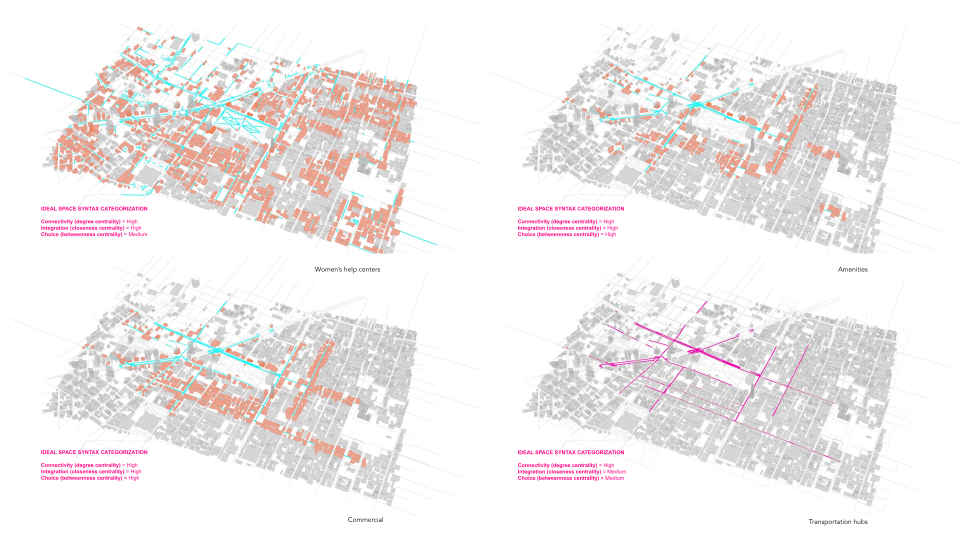
Data overlaps revealed clear patterns linking specific land uses to types of violence:
- Residential Zones: Femicide incidents were predominantly clustered in low-income residential areas. The study suggests that improving the integration and connectivity of these areas—through better street layouts and distribution of activities—could help mitigate violence .
- Educational and Institutional Zones: Areas surrounding educational institutes had high occurrences of rape incidents. Poor visibility and isolated streets around these institutions contributed to their vulnerability .
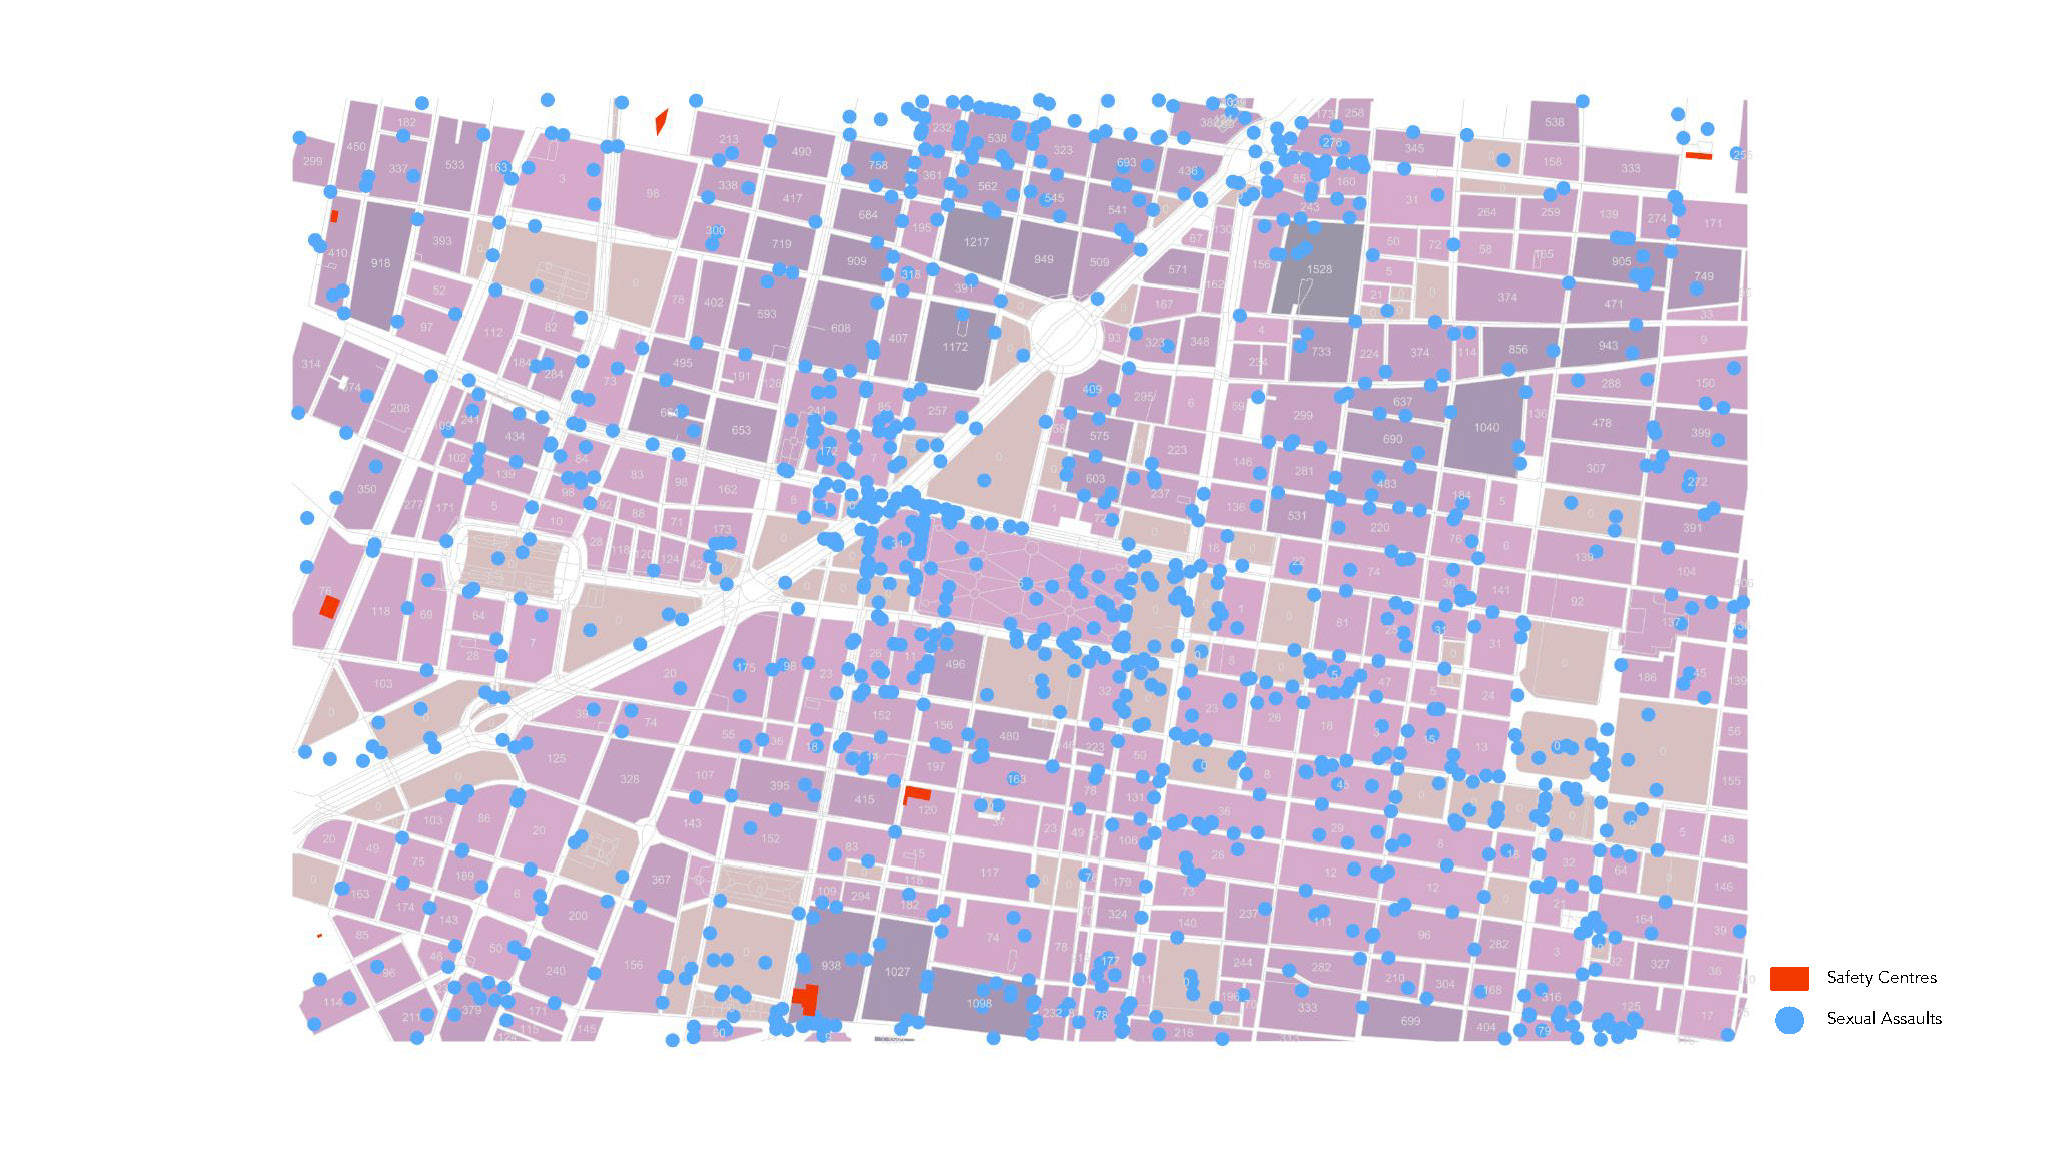
- Commercial Zones: Commercial areas, particularly mixed-use zones with food outlets, had higher incidences of aggression and sexual assault. The unregulated social interactions in these zones, especially in informal market areas like Tepito, required spatial interventions such as formalized markets and increased surveillance to improve safety .
- Transportation Networks: Transportation hubs, while essential for mobility, were also hotspots for aggressions and sexual assaults. Space syntax analysis indicated that these areas could benefit from better lighting, increased visibility, and clear pedestrian routes .
Space Syntax Insights: How Spatial Configuration Impacts Safety
By overlaying crime data with urban characteristics such as connectivity and land use, SafeNet identified clear correlations between violence and spatial configuration. Key findings include:
- Connectivity: Streets with high connectivity generally experienced better safety outcomes.
- Integration: Areas that were more integrated into the broader city network were less prone to violence.
- Choice: The number of alternative routes available on a street affected crime distribution, with some high-choice streets concentrating crime and others dispersing it.
In the Historic Downtown, however, there is contradiction at Alameda, where a significant number of crime incidents against women occur despite being in a highly monitored, “eyes on the street” area. This situation challenges traditional space planning concepts. As researchers, we aim to explore other factors, such as urban morphology and topology, to determine if there is a direct relationship between crimes against women and the layout of the city.
Based on established research, we developed the following table, which synthesizes key findings and highlights the specific space syntax metrics that could influence the safety of different land uses. For instance, public open spaces are identified as requiring high connectivity, moderate integration, and medium choice levels to enhance their safety. This table serves as a concise representation of these relationships, offering a practical guide to understanding how space syntax can inform safer land use planning.
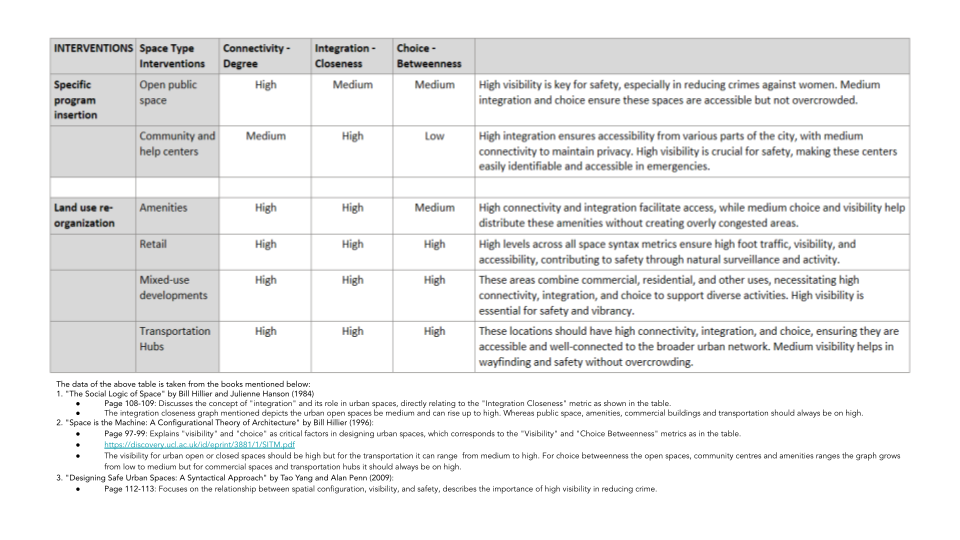
We compared these results to the ideal space syntax values for various land uses. For amenities, our analysis revealed a medium level of connectivity, whereas the ideal value suggests that it should be high. Similarly, the choice metric displayed a low average, in contrast to the ideal value, which indicates it should be medium. The only metric where the average and the ideal values aligned was integration, which consistently showed a high level. This comparative analysis was conducted across other land uses as well, allowing us to identify discrepancies and patterns in space syntax values for different urban functions.
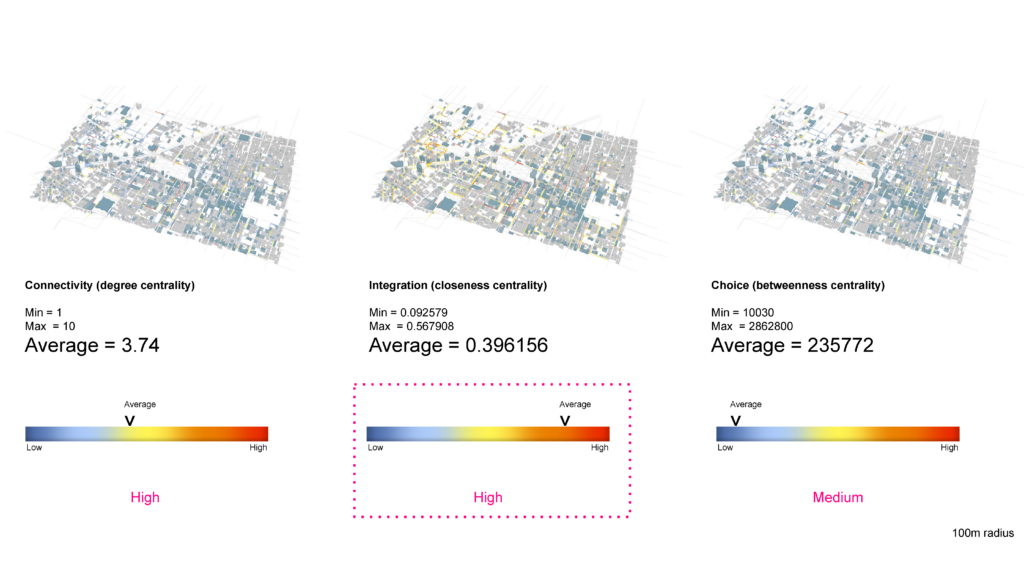
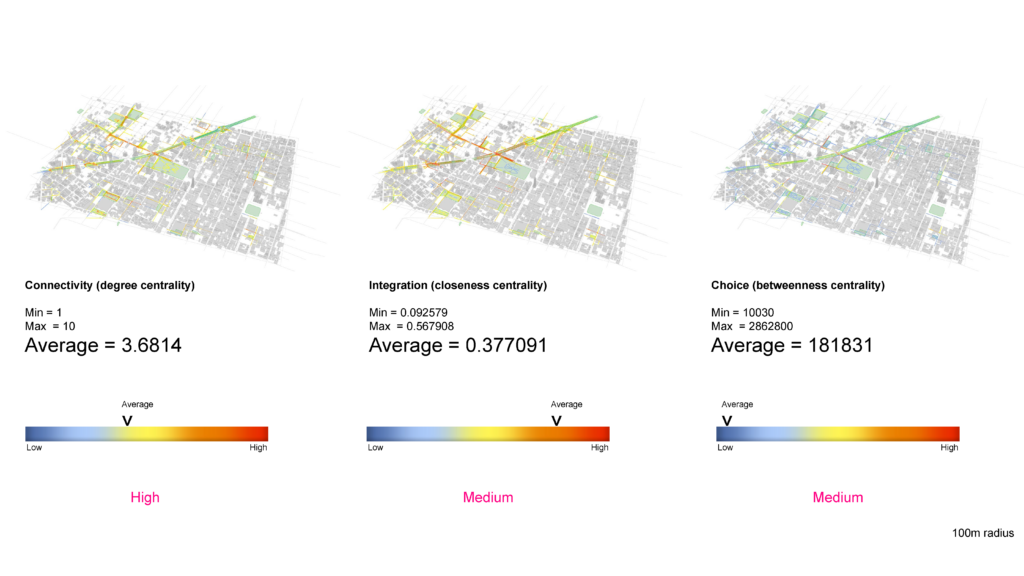
The study of space syntax around current public open space reveals critical numerical insights into how spatial configuration—particularly connectivity, integration, and choice metrics—affects crime levels and safety outcomes. Here’s a breakdown of the findings for the Historic Downtown area in Mexico City, including the impact of key space syntax metrics:
- Connectivity (Degree Centrality):
- Min: 1
- Max: 10
- Average: 3.6814
Streets with higher connectivity were generally associated with safer areas. Well-connected streets, such as those in Alameda Central, allow for greater pedestrian flow and natural surveillance, which help reduce the likelihood of crimes. Conversely, areas like Tepito, with their labyrinthine, disconnected street networks, tend to have higher crime rates due to the limited visibility and escape routes available to criminals .
- Integration (Closeness Centrality):
- Min: 0.092579
- Max: 0.567908
- Average: 0.377091
Integration measures how easily one can move from a street to other areas in the city. Highly integrated areas such as Bellas Artes were safer due to their ease of access and visibility. Meanwhile, less integrated zones, such as certain parts of Lagunilla, were more prone to criminal activities due to their isolation from major urban flows .
- Choice (Betweenness Centrality):
- Min: 10030
- Max: 2,862,800
- Average: 181,831
Streets with high “choice” values, which lie on the shortest paths between key urban points, experience higher pedestrian activity and are thus safer due to the greater potential for witnesses. However, poorly lit streets with high choice metrics can also concentrate crime if urban interventions such as lighting and surveillance are not implemented.
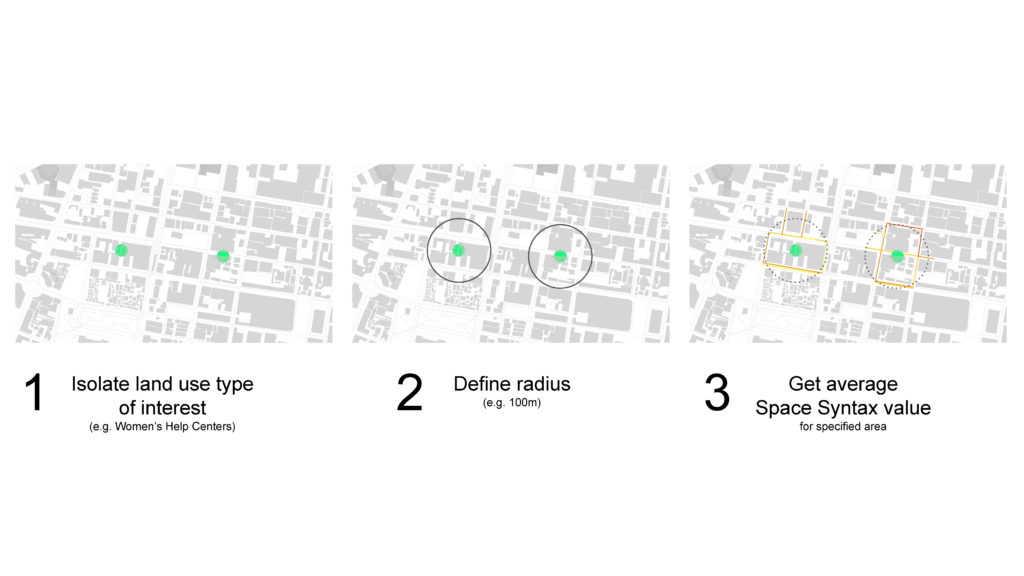
Finally, we propose a method for identifying ideal land use locations based on overlapping space syntax metrics. By combining the ideal conditions for connectivity, integration, and choice, we can identify potential sites for interventions that minimize crime and promote social integration. However, as seen in some real-world tests, these ideal locations do not always coincide with the current urban fabric, pointing to the need for further refinement in applying these methods to city planning.
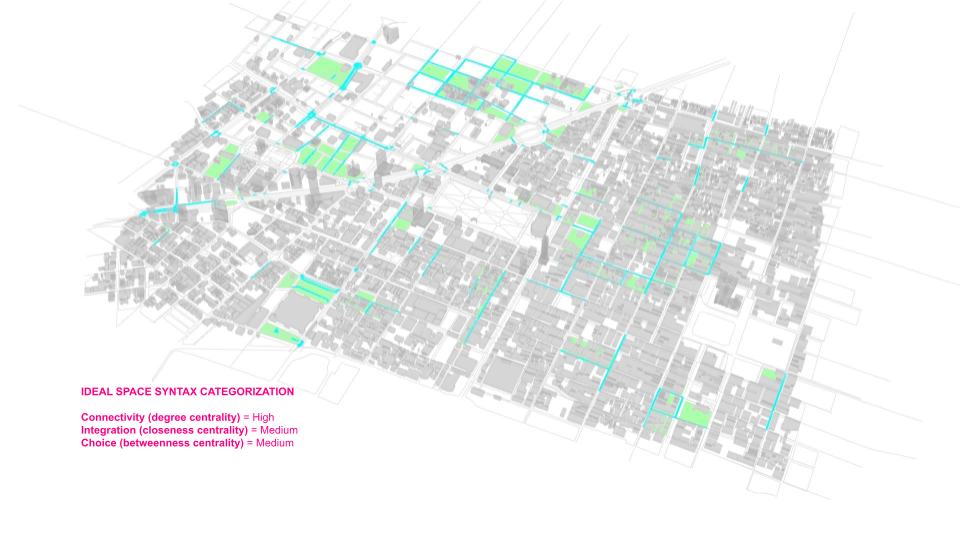
While Space Syntax offers a computationally simple yet powerful method for analyzing urban crime and land use, its real-world applications may not always align perfectly with theoretical ideals. The examples presented show that while certain urban areas meet the ideal Space Syntax conditions, others, like Alameda Park, do not, despite their centrality. This points to the complex, multifaceted nature of urban crime, where spatial conditions are just one part of a broader socio-political and economic context. Nevertheless, Space Syntax can serve as a valuable guide for future urban planning and crime prevention initiatives, providing a structured way to think about the spatial dynamics of cities and their impact on safety.
Graph Machine Learning
Machine learning, and more specifically graph-based approaches, can provide unique insights into how city morphology and topology affects crime patterns. Space syntax metrics, which quantify the accessibility, connectivity, and other spatial characteristics of urban forms, offer a solid foundation for predicting crime hotspots. Graph neural networks (GNNs) enhance these analyses by capturing both the global and local interactions within urban spaces, allowing for transductive node classification and inference. This dual approach—combining Space Syntax with machine learning—has the potential of empowering urban planners to foresee the consequences of their designs, aiding in the development of safer, more equitable cities.
A series of experiments where conducted to test the relationship between the crime, land use, demographics and geometric and topologic layout of the city:
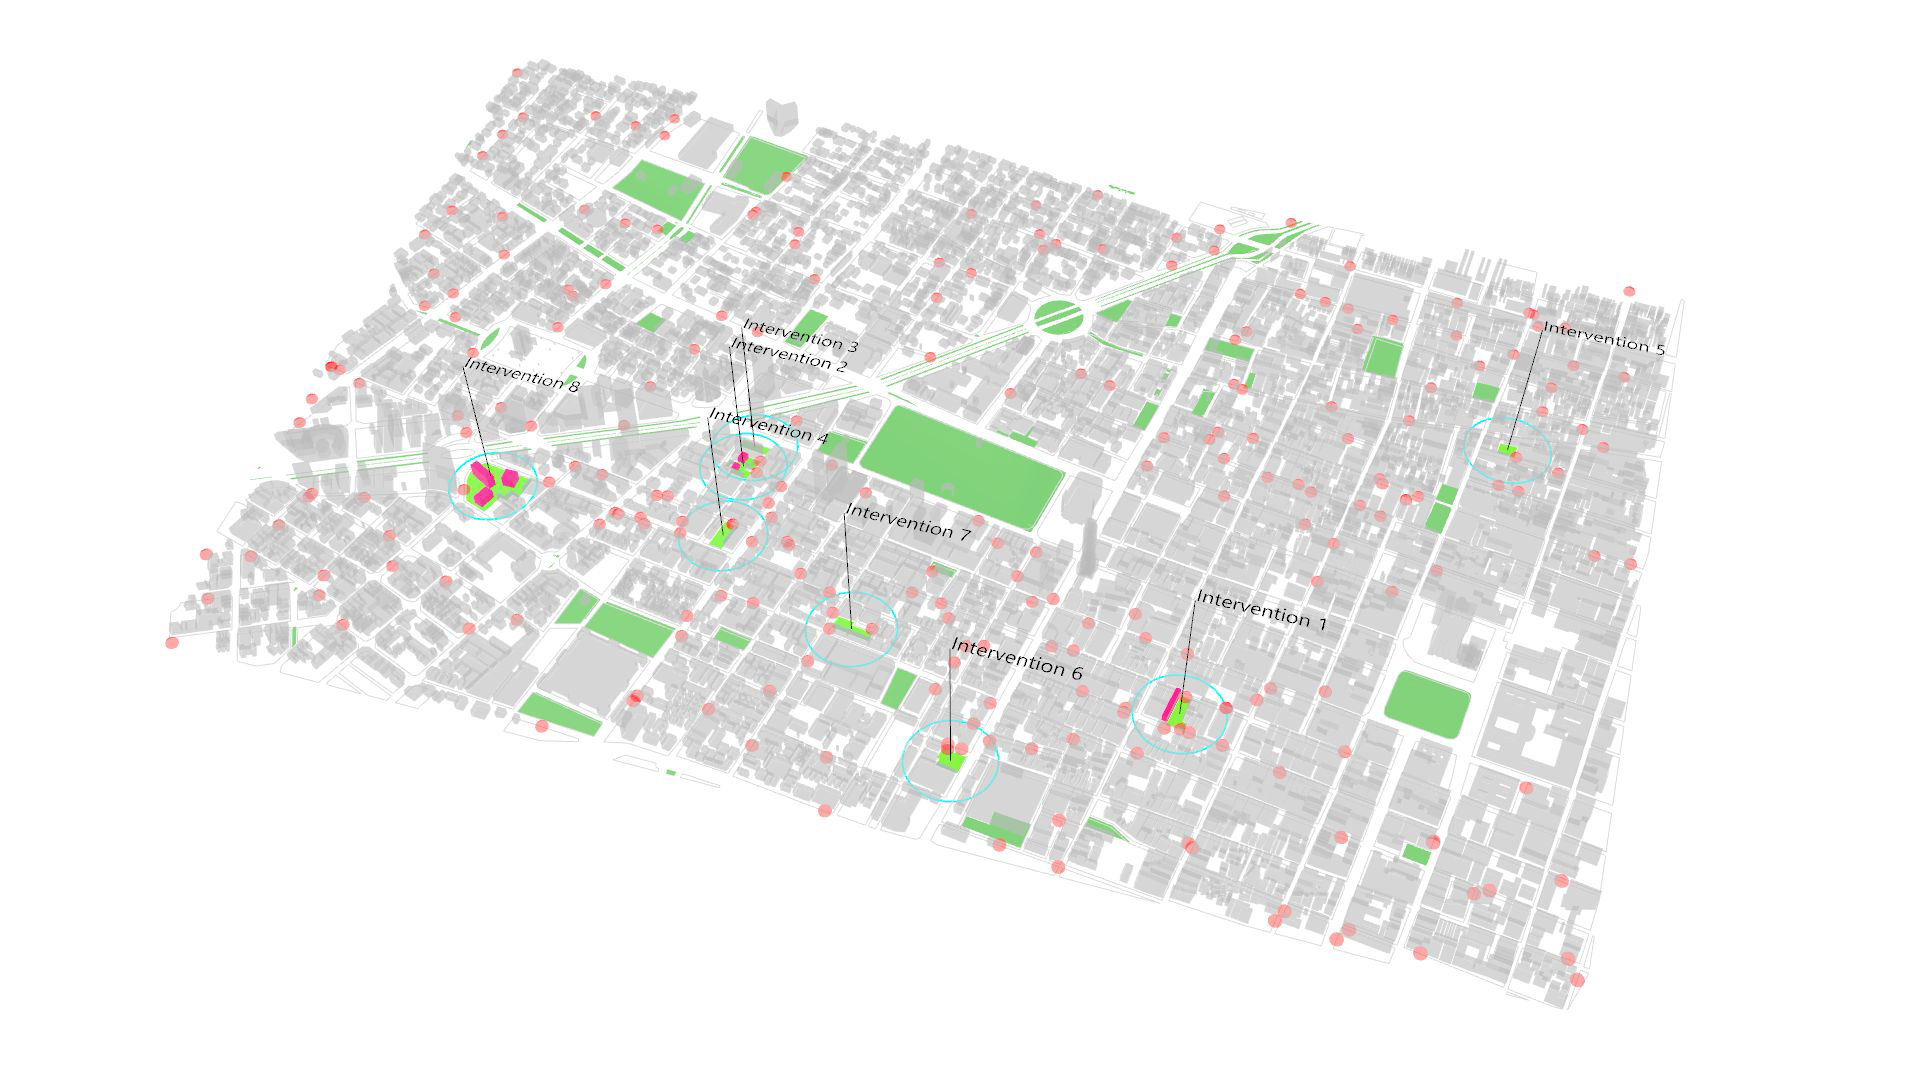
Experiment 1: Testing Interventions with GML
In the first experiment, SafeNet tested 17 urban interventions using a 100m radius of influence to measure their impact on safety based on suggestions made by Space Syntax metrics. The primary objective of Experiment 1 was to evaluate how the introduction or enhancement of public spaces within a city affects the safety score, a composite indicator designed to reflect urban safety. This experiment sought to use graph machine learning techniques, in conjunction with space syntax analysis, to identify and implement ideal land uses, specifically public spaces, and predict their impact on crime prevention.
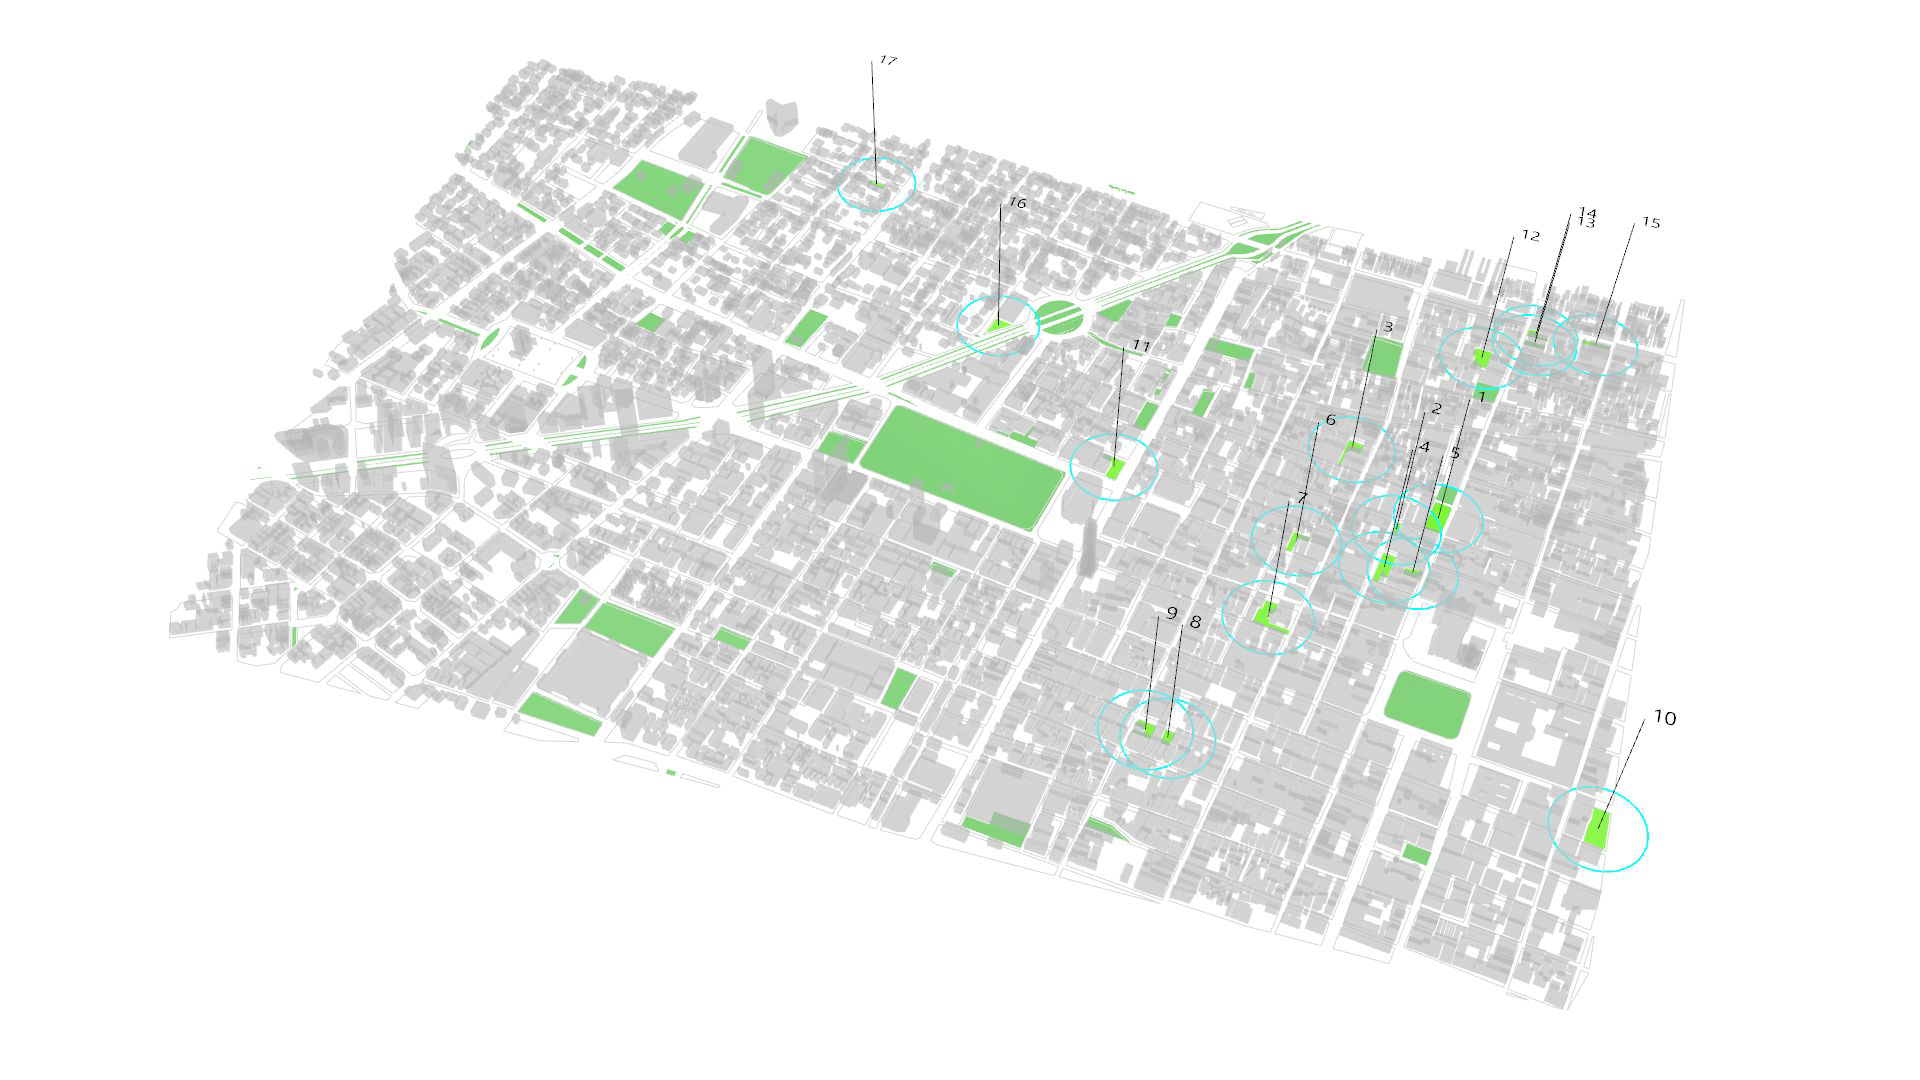
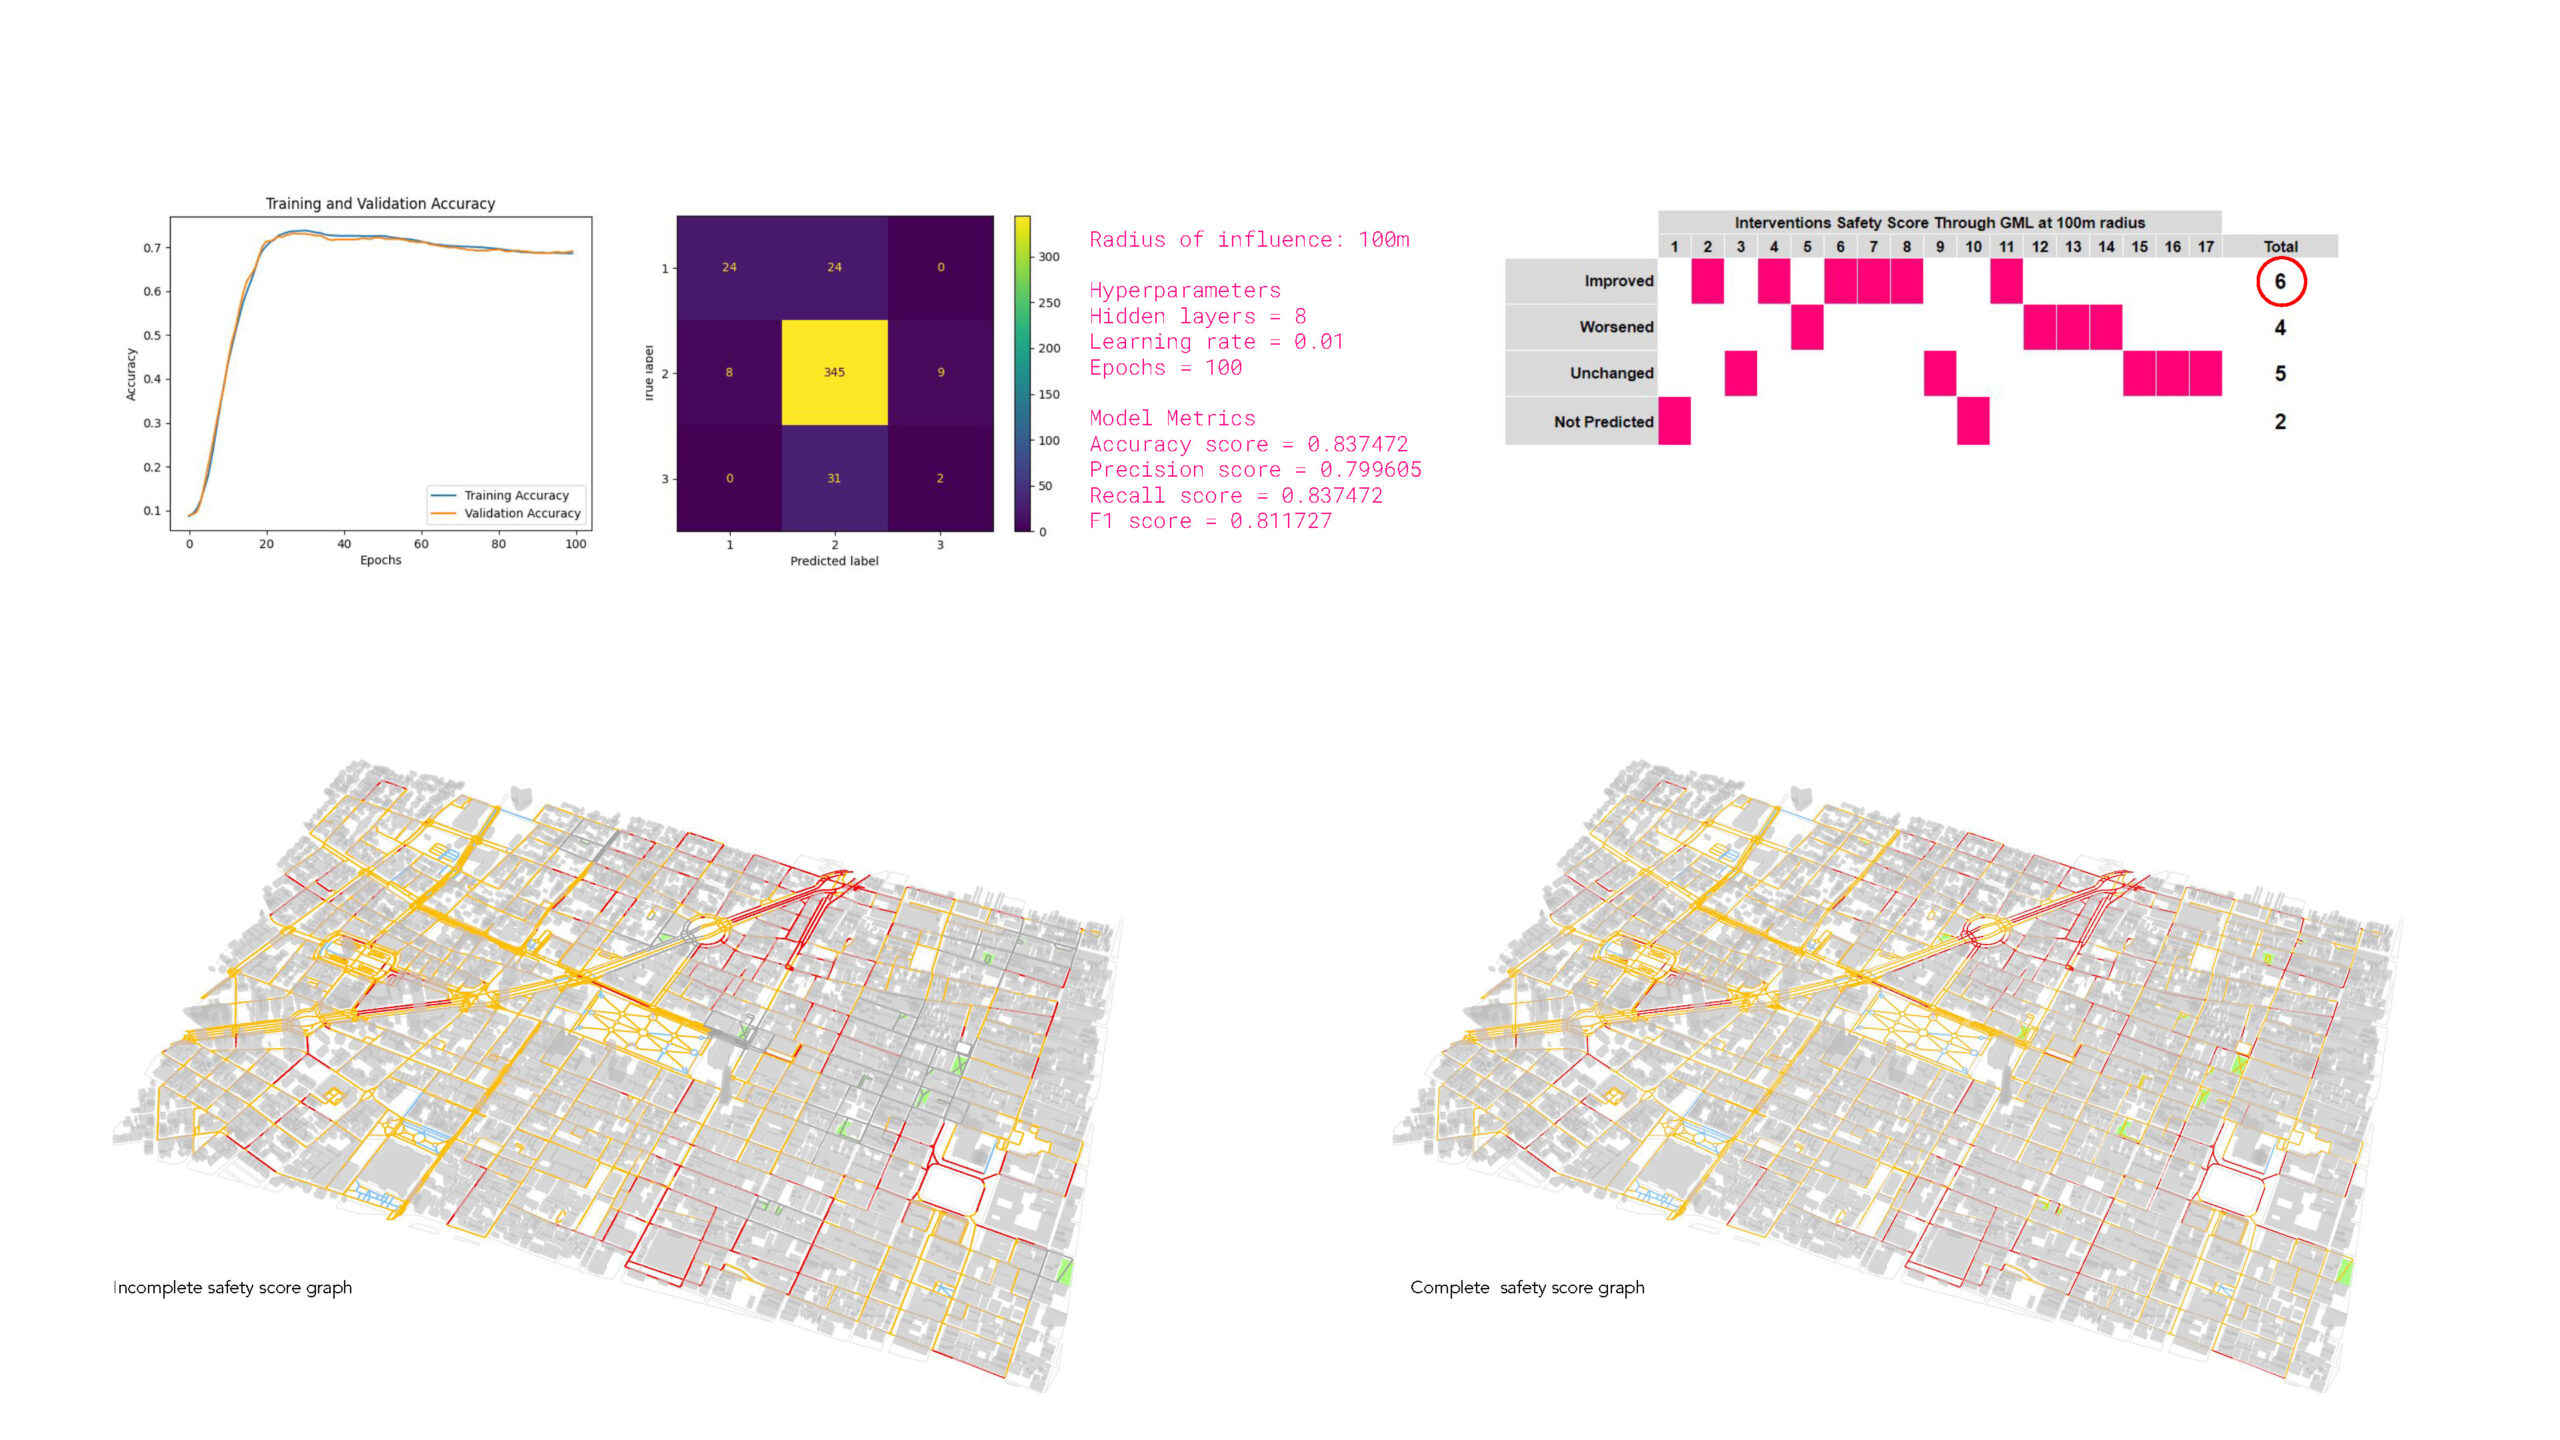
The results provided valuable insights:
- 6 interventions improved safety scores, particularly those enhancing street connectivity and visibility.
- 4 interventions worsened safety scores, showing that not all changes are beneficial.
- 5 interventions had neutral effects.
- 2 interventions could not be predicted due to insufficient data.
This experiment demonstrated that changes to urban infrastructure must be carefully considered, as poorly executed interventions can have unintended consequences.
The insights from Experiment 1 emphasize the potential of graph machine learning and space syntax analysis as tools for urban planning. By integrating these methods, urban planners can more effectively target public space interventions, optimizing them for maximum safety impact. Furthermore, the findings suggest that combining quantitative spatial analysis with qualitative urban design principles (such as those proposed by Jane Jacobs) can yield more comprehensive strategies for crime prevention. This experiment provides a foundational approach for future studies to explore the interplay between urban morphology, topology and safety, particularly in rapidly growing urban environments where data-driven planning can play a crucial role in shaping more livable, inclusive, and secure cities.
Experiment 2a: Building Placements and Urban Density
The next phase focused on how building placements and urban density affect safety. This second experiment aimed to expand the scope of interventions beyond the creation of public spaces by investigating the effects of massing changes and other urban form modifications on the safety score. This experiment sought to evaluate how alterations in building volumes, density, and the allocation of urban functions—such as repurposing parking spaces—could influence safety outcomes within the city. The experiment also tested the robustness of the safety score as a tool for guiding urban interventions, while refining the graph machine learning methodology to improve predictive accuracy.
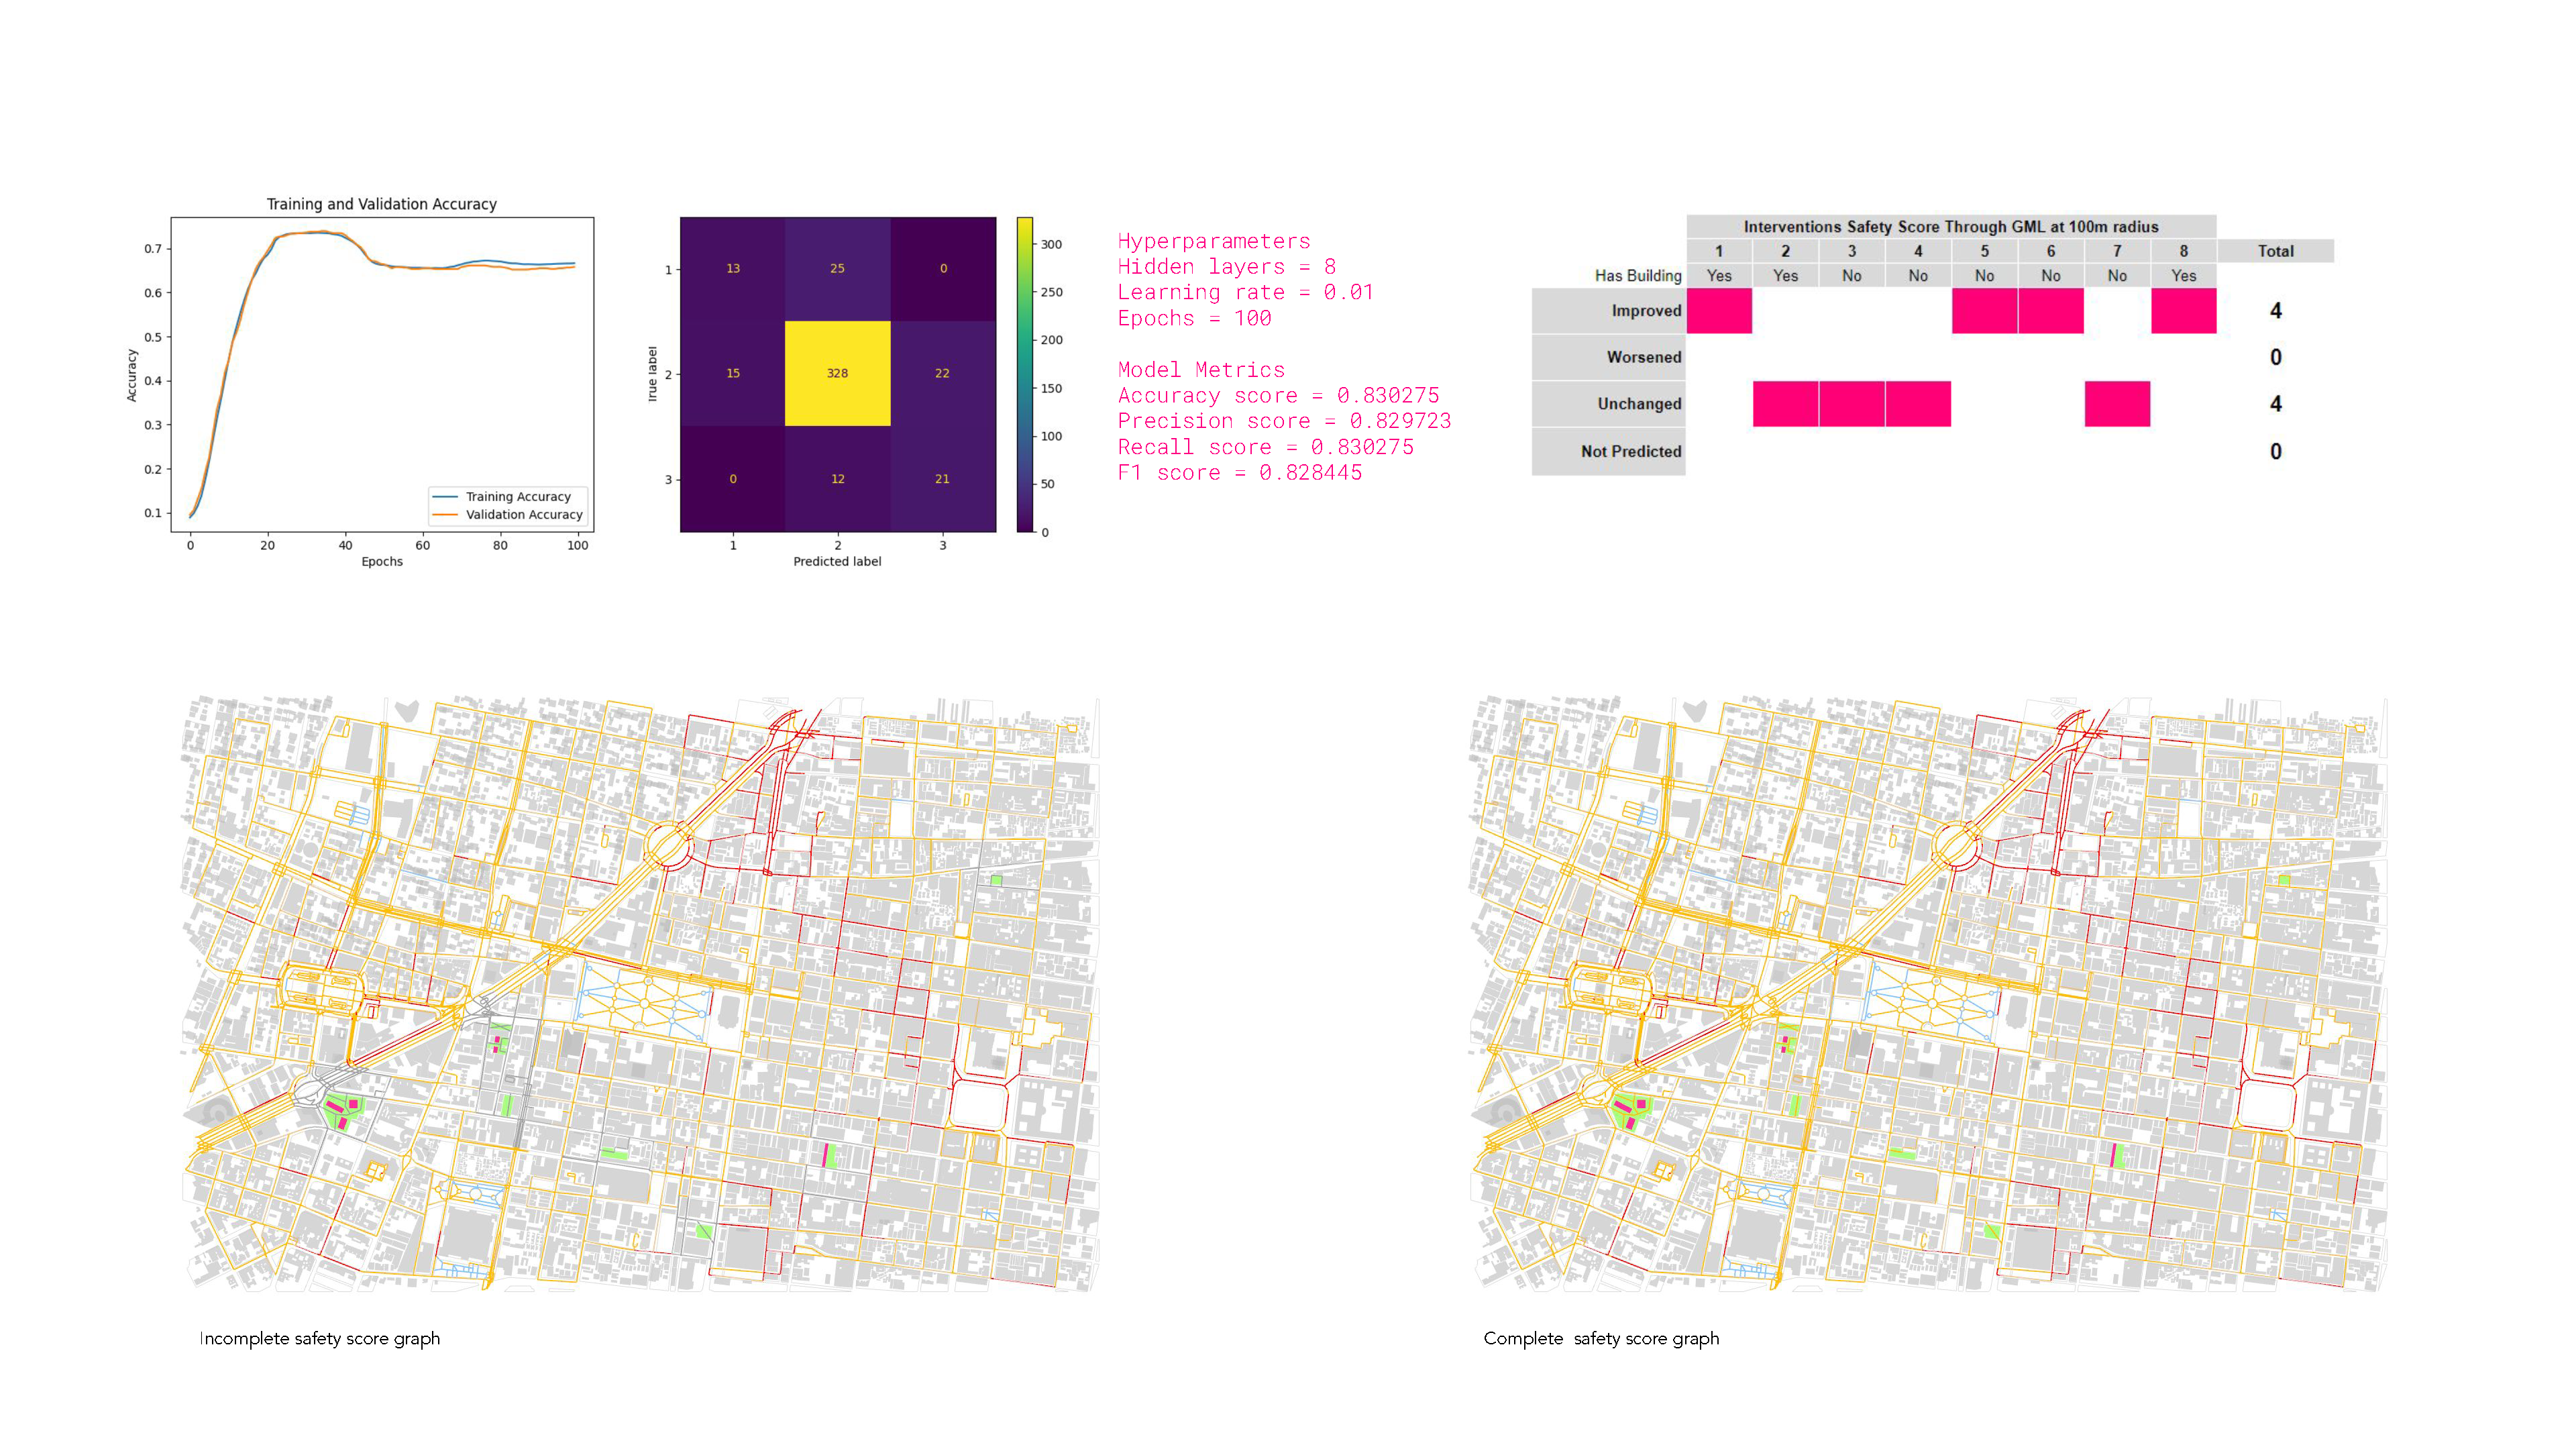
The GML model achieved an accuracy score of 0.830 and an F1 score of 0.828, with the following results from the 8 tested interventions:
- 4 interventions improved safety, indicating that strategic changes to building layouts can enhance public safety.
- 0 interventions worsened safety scores, highlighting the benefits of careful planning.
- 4 interventions showed neutral effects, with minimal impact on crime.
- 0 interventions could not be predicted.
Experiment 2b: Radius of Influence
Using the same setup as experiment 2a, the third experiment analyzed the radius of influence (from 50m to 500m) to determine how far safety improvements spread from a given intervention or at what moment the system stopped yielding reliable results.
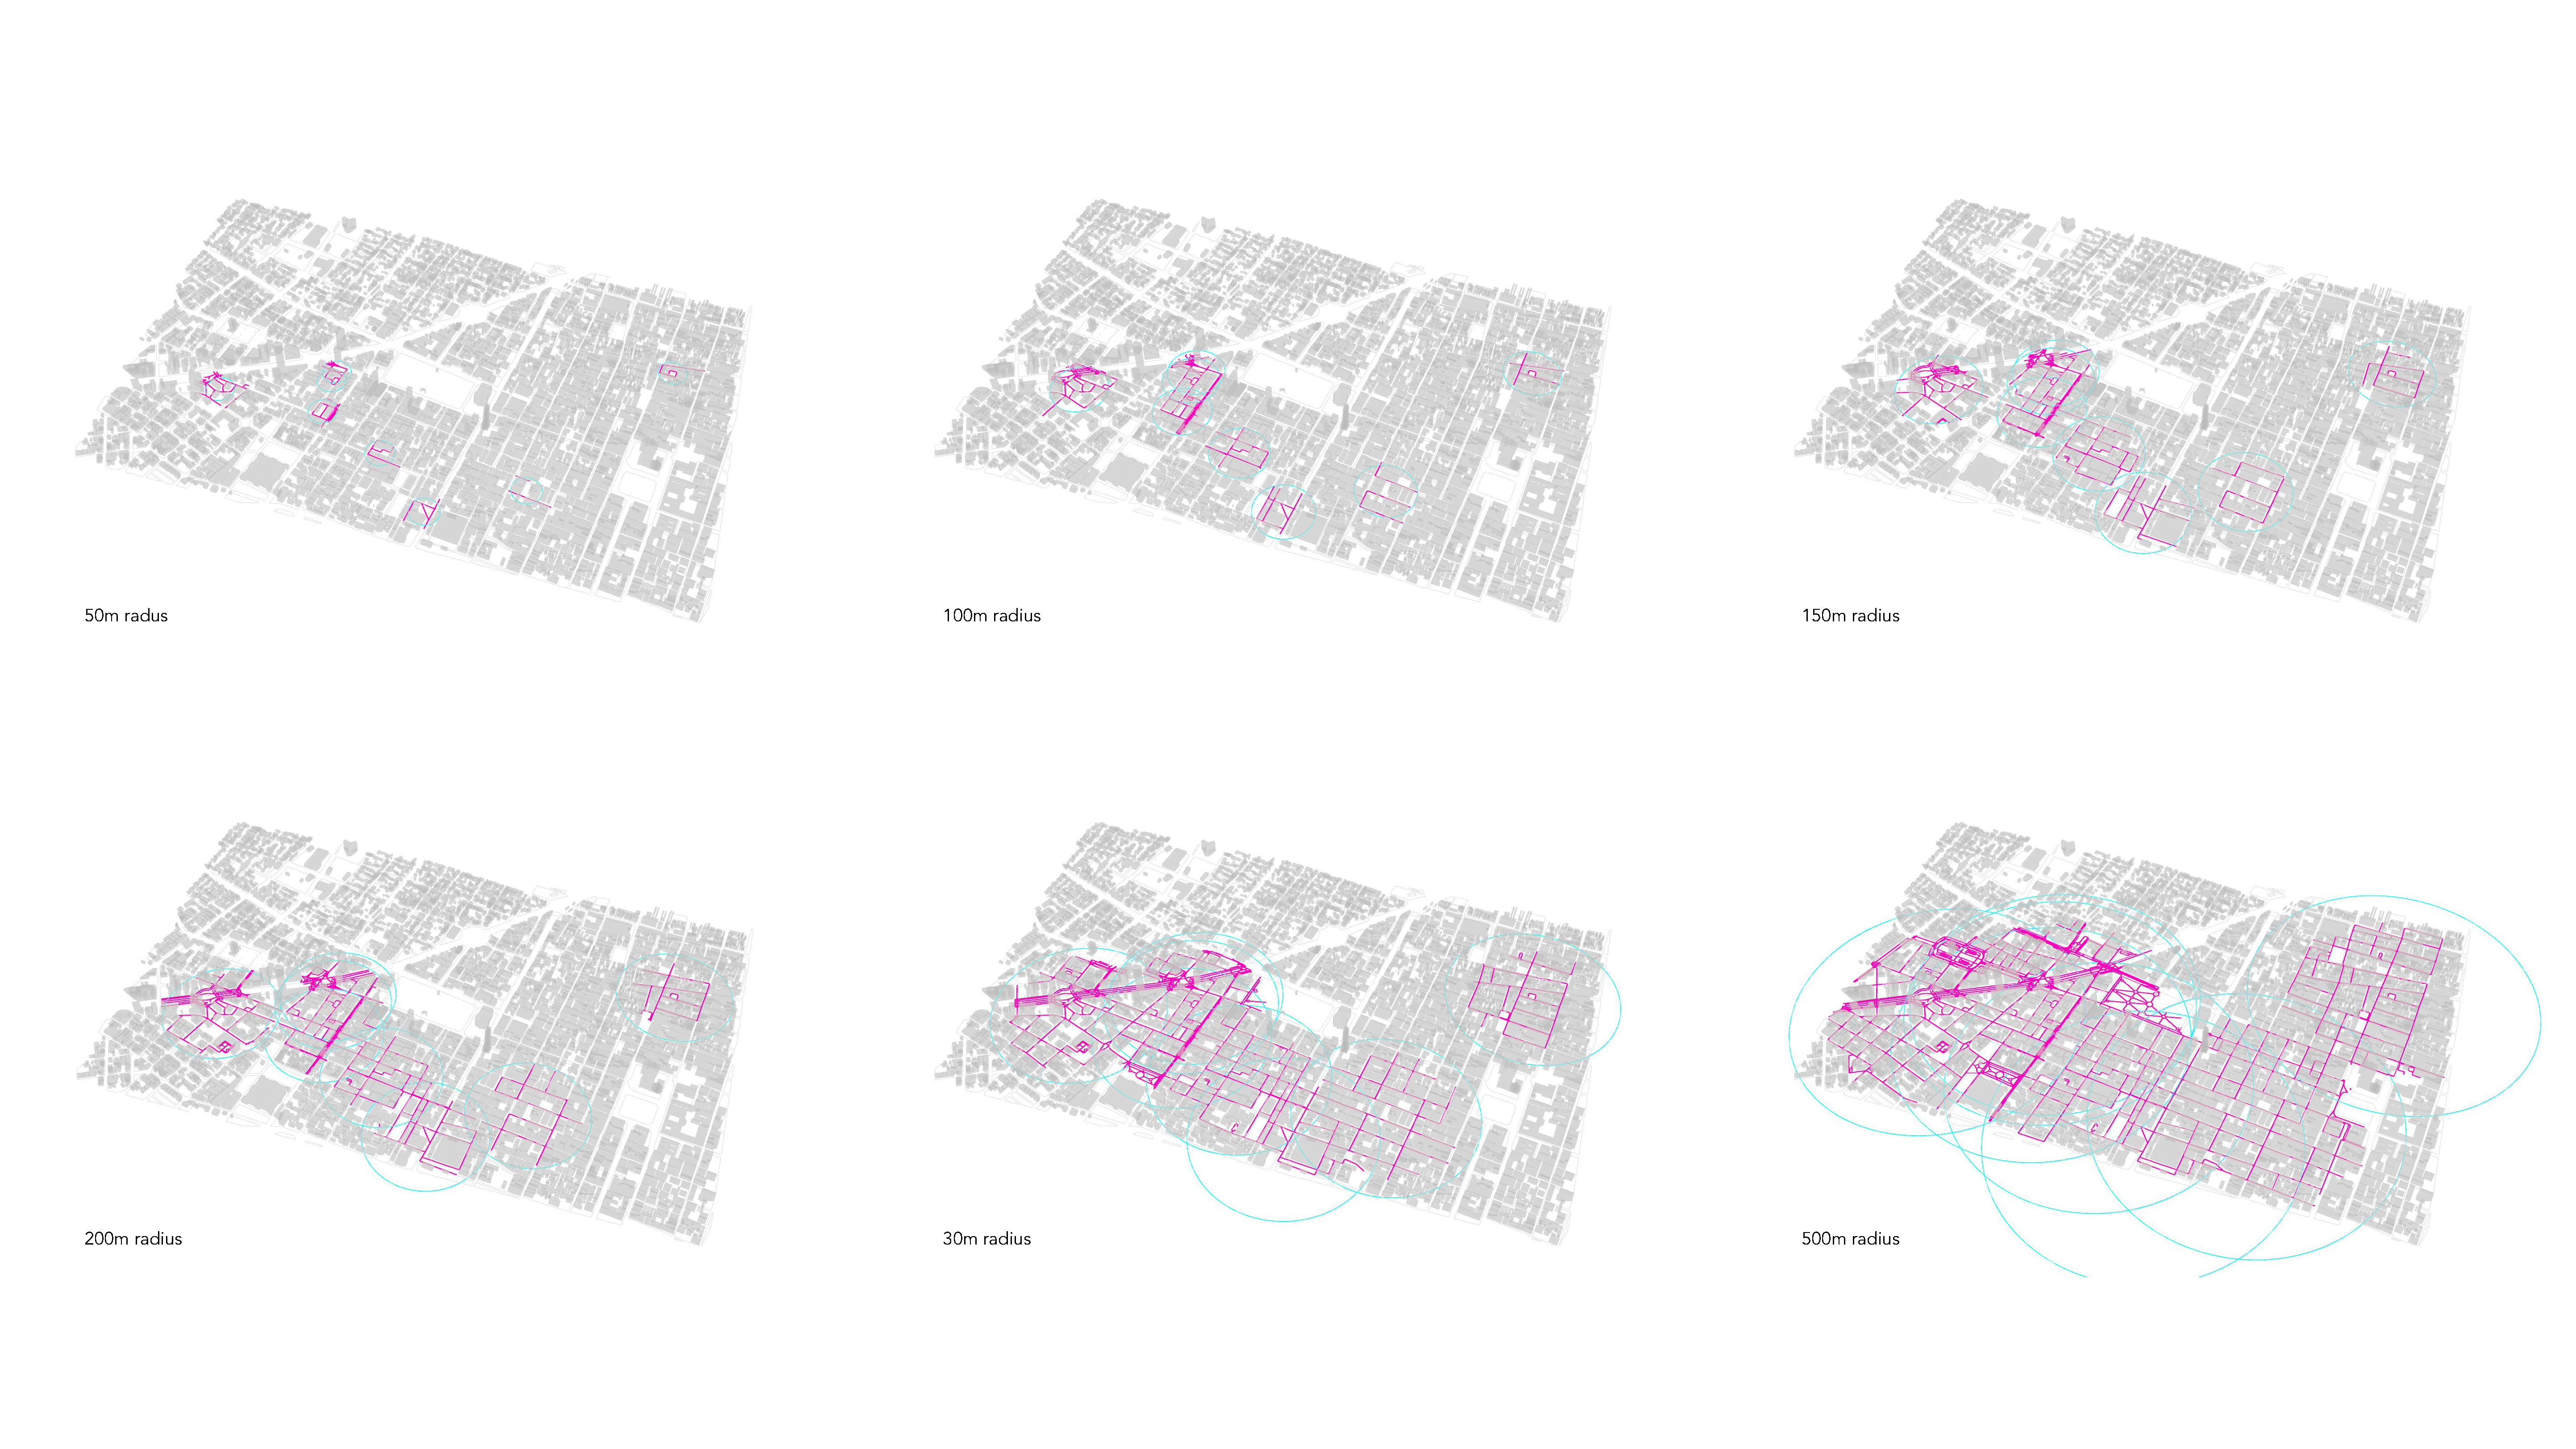
The results were crucial for understanding the reach of urban design solutions:
- 50m to 100m: Interventions showed the strongest safety improvements within close proximity.
- 150m to 200m: The effect of interventions began to decrease, though positive outcomes remained.
- 300m to 500m: Safety improvements were less pronounced, with multiple interventions needed to create a noticeable effect.
The analysis revealed that smaller radii (50m to 100m) yielded the greatest safety benefits, while larger radii required more coordinated interventions to have an impact.
Experiment 2 expands the toolkit available to urban planners by demonstrating that interventions beyond public spaces only—such as massing changes and parking reallocation—can have an impact on urban safety. The findings highlight the importance of integrating morphological and topological considerations into safety planning, ensuring that interventions depend on the specific spatial and social context of each urban area. The use of graph machine learning, combined with detailed urban morphology analysis, offers a powerful approach to predicting and optimizing the safety impact of diverse interventions.
These insights pave the way for future research to explore more complex combinations of interventions, testing how multiple changes interact to influence urban safety. The development of optimization algorithms may further enhance the ability of urban planners to identify the most effective intervention strategies, contributing to the creation of safer, more resilient cities.
Proposed Interventions and Beyond: Making Public Spaces Safer
Based on the insights from space syntax analysis, land use-crime correlation, and GML experiments, SafeNet proposes the following targeted interventions to improve urban safety:
- Street and Connectivity Improvements: Enhancing the connectivity of streets, particularly in poorly integrated areas such as commercial districts, can significantly improve safety. Increasing pedestrian pathways and removing barriers to visibility are key strategies.
- Formalizing Informal Market Zones: In areas like Tepito and Lagunilla, where informal economies dominate, SafeNet recommends formalizing these spaces to improve safety. Better organization of street vendors, infrastructure upgrades, and increased surveillance can help reduce the risks associated with these dense urban areas.
- Transportation Hub Design: Public transportation hubs, which are often hotspots for violence, need to be redesigned with safety in mind. This includes improving visibility, and providing clear, accessible pedestrian routes to reduce opportunities for crime.
- Targeted Safety Enhancements for High-Crime Areas: In zones like Tepito, SafeNet suggests targeted urban design interventions such as creating open spaces that promote natural surveillance, and installing public safety hubs to provide resources for women at risk of violence.
Conclusion: A Replicable Methodology for Urban Safety Analysis
SafeNet has demonstrated the potential of combining space syntax analysis, Graph Machine Learning (GML), and urban morphology to address pressing urban safety concerns, specifically gender-based violence in Mexico City. However, beyond the specific outcomes and insights generated by the project, the methodology itself is what makes SafeNet highly replicable and adaptable to other urban contexts.
By structuring this process, we provide a clear framework that can be utilized by urban planners, data scientists, and policymakers aiming to tackle similar issues in different cities.
Key Methodological Steps:
- Initial Macro Analysis: Start by collecting macro-level data on the city or region under investigation. This includes a general understanding of crime statistics (such as femicides) and urban features. In SafeNet, the focus was on Mexico City’s Historic Downtown, but this process could be adapted to other high-risk zones in any urban environment.
- Selection of Specific Study Area: Identify a targeted area of study that presents the most pressing urban challenges. SafeNet selected Historic Downtown due to its dense population and high crime density, but this methodology can be applied to neighborhoods or zones that face safety concerns globally.
- Data Collection: Collect both open-source and manual data, focusing on multiple aspects:
- Crime data (e.g., assaults, femicides)
- Urban morphology and topology (e.g., street connectivity, visibility, integration)
- Land use data (residential areas, educational institutes, transportation hubs)
- City Data and Crime Analysis: Perform a deep dive into city data analysis, identifying correlations between crime and different land uses, demographic data, and public spaces. This phase is where specific crime patterns (e.g., sexual assaults near transportation hubs or femicides in residential areas) are highlighted.
- Causal Analysis and Overlapping Data: Utilize causal analysis techniques to understand the cause-effect relationships between urban layout, land use, and crime rates. By overlaying different datasets (e.g., crime data, land use, population), you can visualize how the spatial configuration of the city influences safety outcomes.
- Space Syntax and Land Use Suggestions: The application of space syntax metrics (e.g., connectivity, integration, choice) is a core component of this methodology. By analyzing these metrics, SafeNet was able to suggest interventions to improve urban safety. For example, poorly connected streets that had high crime rates were highlighted for urban upgrades, while highly integrated areas were confirmed as safer zones.
- Graph Machine Learning (GML) and Safety Score: GML is used to generate a Safety Score for each street segment, predicting which areas are safest and which require interventions. The score aggregates multiple factors like:
- Crime incidents
- Connectivity and visibility
- Presence of public spaces
- Population density
- Testing Interventions and Application of Results: The methodology then tests various urban interventions (e.g., changes in street layouts, building placement) to predict their impact on safety. These interventions are simulated in the model to determine whether they improve or worsen the Safety Score. The feedback loop allows urban planners to refine interventions before implementation.
- Intervention Analysis and Results: Finally, the interventions are assessed, compared, and validated using the Safety Score predictions. SafeNet used these predictions to recommend specific, targeted interventions (e.g., formalizing informal markets, improving connectivity in residential zones).
A Scalable and Adaptable Approach
What makes this methodology valuable is its scalability. By following this structured process, other cities can replicate SafeNet’s approach to addressing urban safety issues. Key takeaways include:
- Adaptability: While SafeNet was focused on Mexico City, the methodology can be adapted to any urban setting.
- Data Integration: The strength of this process lies in the integration of multiple data sources—crime data, land use, urban morphology, and space syntax.
- Predictive Models: The use of GML to predict safety outcomes offers an advanced approach to urban planning, moving beyond reactive measures to proactive, data-driven interventions.
- Community and Policy Impact: By providing a clear methodology, SafeNet encourages collaboration between policymakers, urban designers, and communities to implement safer urban environments.
SafeNet shows that by leveraging technology and urban data, we can create safer cities. This replicable methodology is the first step toward building urban environments where public spaces are designed with safety, inclusivity, and sustainability in mind.
The complexity of gender-based violence, particularly in a city as vast and diverse as Mexico City, defies simple explanations or solutions. The phenomenon is shaped by deeply entrenched social, cultural, and urban factors that make it resistant to easy predictions or blanket interventions. This thesis does not attempt to predict exactly where crime or violence will occur—such an endeavor would be both impractical and inadequate in addressing the deep-rooted, systemic nature of the problem. Instead, this work leverages the immense analytical potential of machine learning methodologies to provide a powerful tool for identifying vulnerabilities in the urban fabric and proposing targeted interventions that can help reduce violence and, ultimately, save lives.
Graph Machine Learning Inside Grasshopper: A Methodological Exploration
During the development of SafeNet, a series of tools were created to analyze and test the city through various methodologies. This experiment within SafeNet explores the feasibility of executing complete graph machine learning (GML) workflows directly within Grasshopper, utilizing Rhino 8’s Python 3 integration. Traditionally, these workflows are carried out in standalone Python environments, but the experiment aims to streamline them within Grasshopper’s visual scripting platform. The goal is to make spatial and graph data manipulation more intuitive while enabling real-time data analysis and visualization without leaving the platform.
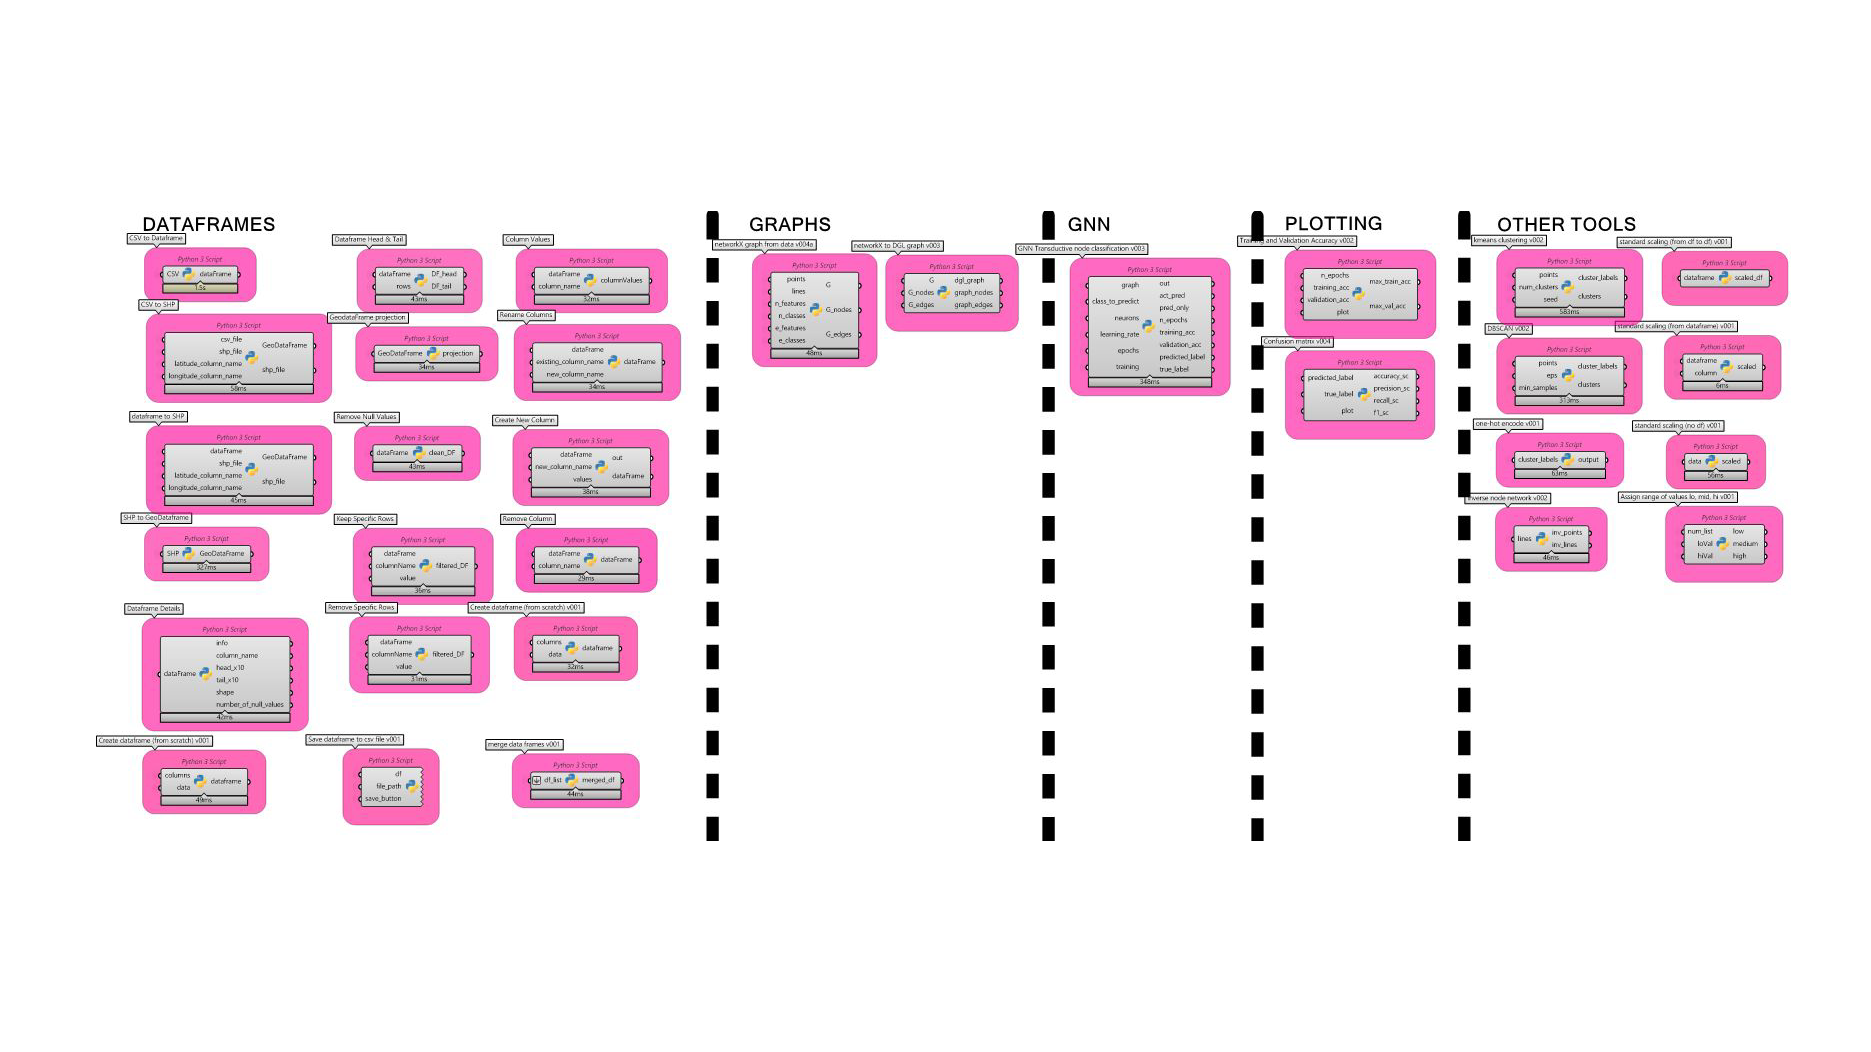
Key Objectives and Methodology:
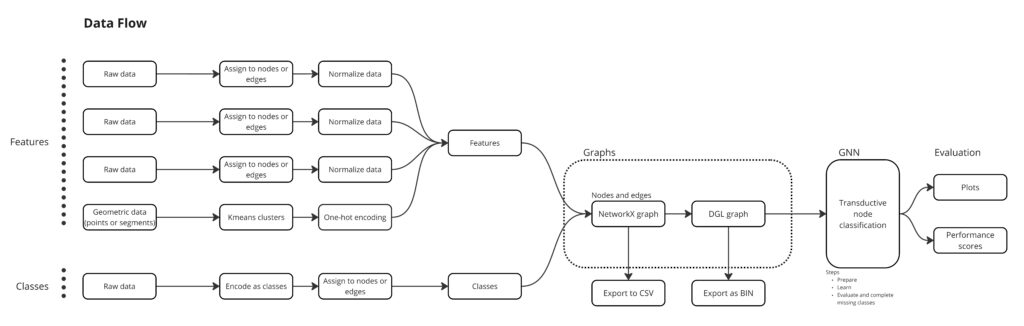
The study broke down GML processes into components compatible with Grasshopper, integrating libraries like pandas, PyTorch, DGL, and NetworkX for graph manipulation. The focus was to simplify the handling of inputs/outputs and ensure tasks like data manipulation and graph analysis could be performed directly in Grasshopper.
Design Process and Advantages:
Adapting Python to Grasshopper’s modular structure required creating components for specific tasks. A notable success was enabling direct manipulation of pandas DataFrames within Grasshopper, allowing real-time data imports, exports, and modifications. Grasshopper’s real-time feedback streamlined iterative processes for graph visualization.
Challenges and Limitations:
Handling large datasets caused performance issues, and there were compatibility challenges with libraries such as PhiK and numpy, which required troubleshooting. Advanced graph plotting still needed external tools.
Outcomes and Future Vision:
The experiment successfully demonstrated that GML workflows could be integrated into Grasshopper. Future developments aim to create a comprehensive, user-friendly tool for running GML in Grasshopper, making it more accessible to architects, urban designers, and data scientists. The ability to combine geometry and graph manipulations offers enormous potential, particularly for spatial analysis, urban morphology, and crime prediction.
In summary, this experiment lays the groundwork for a future tool that integrates Grasshopper’s visual programming strengths with Python-based GML workflows, empowering users with intuitive and powerful graph machine learning tools.
References
González-Méndez, R., & Santana-Hernández, J. D. (2001). Violencia en parejas jóvenes: Análisis y prevención.
Gehl, J. (1971). Livet mellem husene. Arkitektens Forlag.
Hillier, B. (1996). Space is the machine: A configurational theory of architecture. Cambridge University Press.
Hillier, B., & Hanson, J. (1984). The social logic of space. Cambridge University Press.
Instituto Nacional de Estadística y Geografía (INEGI). (2020). Defunciones femeninas presuntamente homicidios.
Jacobs, J. (1961). The death and life of great American cities. Vintage Books.
Knecht, S., & Voss, J. (Eds.). (2020). Urban morphology and the sustainable city. Springer. https://doi.org/10.1007/978-3-030-59140-3
Mohamed, A., Van Nes, A., & Salheen, M. A. (2015). Beyond informality: Traders as space experts in their own informal settlements. In K. Karimi, L. Vaughan, K. Sailer, G.
Palaiologou, & T. Bolton (Eds.), Proceedings of the 10th international space syntax symposium (pp. 135:1–135:19). Space Syntax Laboratory, The Bartlett School of Architecture, UCL, London.
ONU Mujeres. (2024). Las marcas del feminicidio en la Ciudad de México.
ONU Mujeres, INMUJERES, & CONAVIM. (2022). La violencia contra las mujeres en México: Aproximaciones y tendencias.
Proyecto del Plan General de Desarrollo de la Ciudad de México 2020-2040. https://www.ssc.cdmx.gob.mx/storage/app/media/Difusion%20Consulta%20Indigena/Proyecto_Prog_Gral_de_Desarrollo_2020-2040.pdf
Ruiz Carbonell, R., & Ramos Lira, L. (2009). Amar a madrazos [Originally published in Emeequis magazine].
Secretariado Ejecutivo del Sistema Nacional de Seguridad Pública (SESNSP). (2020). Reporte sobre la violencia feminicida en la Ciudad de México.
Stockholm Public Transport Authority. (n.d.). Gender-sensitive public transport initiatives in Stockholm.
UN Women. (2023). Femicides in Mexico City: Statistical reports and trends.
Van Nes, A., & Aghabeick, S. (2015). Crime patterns in Dutch cities: The role of space and context. Proceedings of the 10th international space syntax symposium.
Van Nes, A., & Yamu, C. (2021). Introduction to space syntax in urban studies. In Springer eBooks. https://doi.org/10.1007/978-3-030-59140-3
Yang, T., & Penn, A. (2009). Designing safe urban spaces: A syntactical approach.
