

Bike route classification using Graph Machine Learning
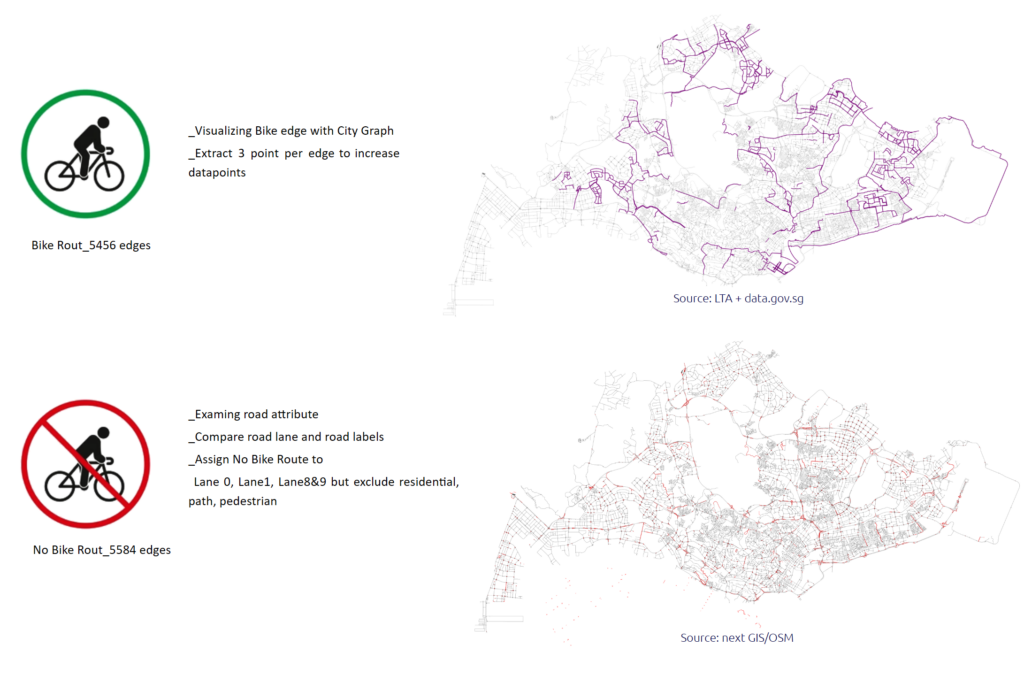
The goal of the project was to develop a graph machine learning model that would predict existence of bike routes in Singapore based on collected geodata. Because the bike routes were represented by graph edges, that was also our classification type.
Data Exploration & Research Topic
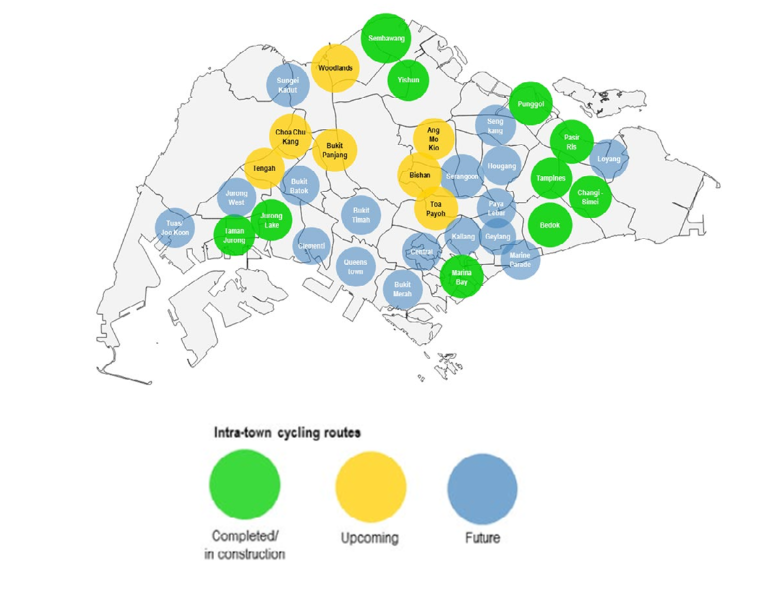
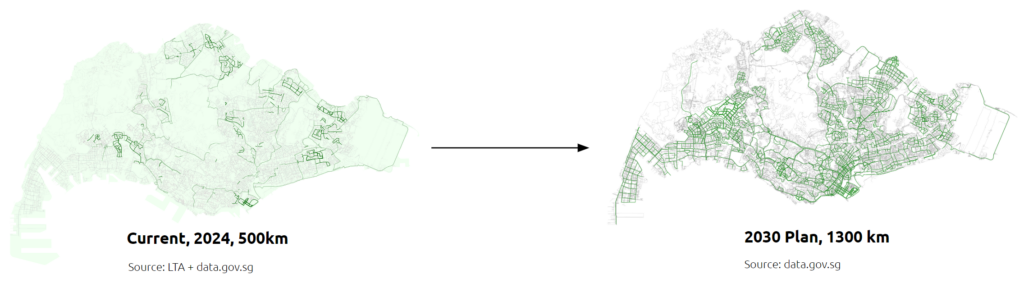
We choose this topic because Singapore is actually in the process of increasing the number of cycling paths, according to their the 2030 plan, so we though this might be interesting to see if our model would come up with a similar solutions as the singapore urban planners.
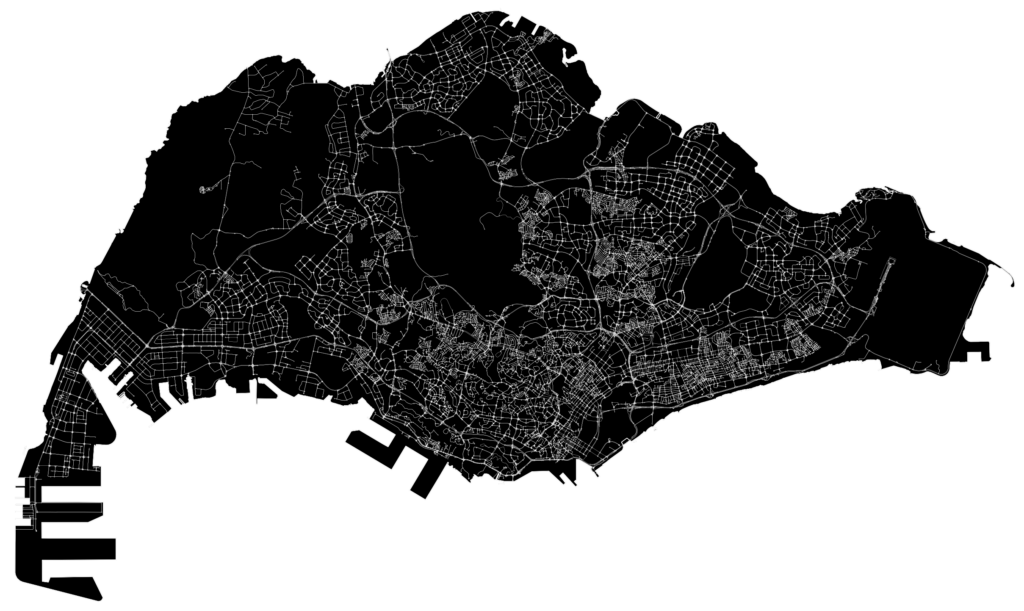
Base map
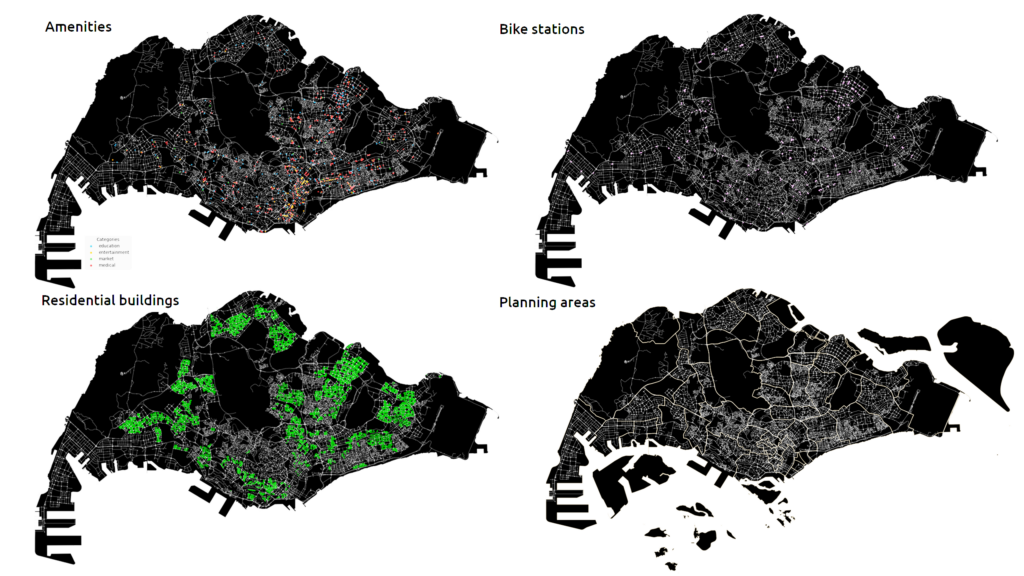
We tried using quite a lot of things like bike stations, amenities, residential buildings, planning areas just to name a few. But we still didn’t get the correlation of the features that we wanted. So we did some research
Finding Correlation
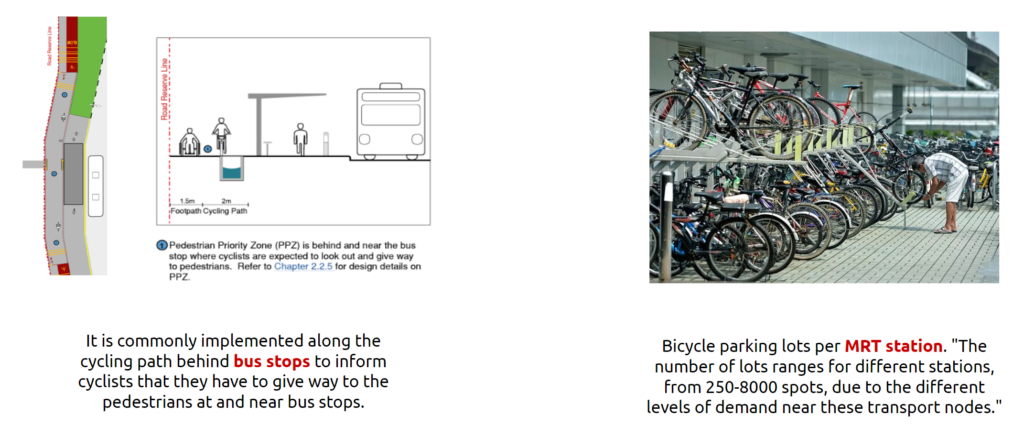
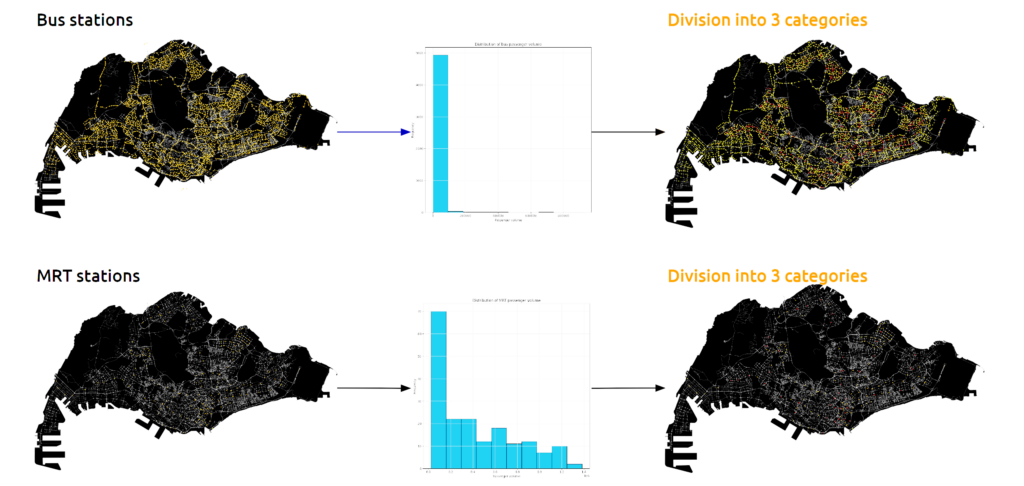
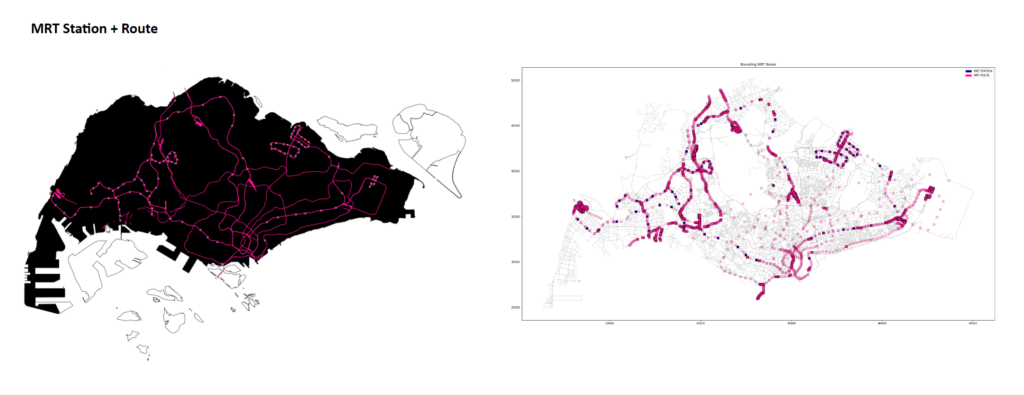
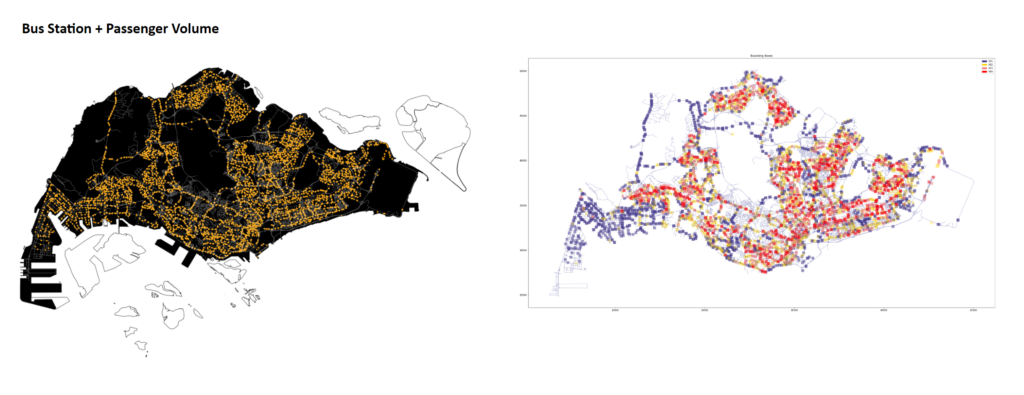
We found out, that bike routes are actually correlated with other transport features – bus stops and MRT stations. So we imported also those features. But to fully leverage their potential, we enriched the datapoints with passenger volume that we divided into 3 categories based on the frequency of certain volumes. Cleaning this data and combining it was not easy and forced us to really think about the data structure and spatial relationships.
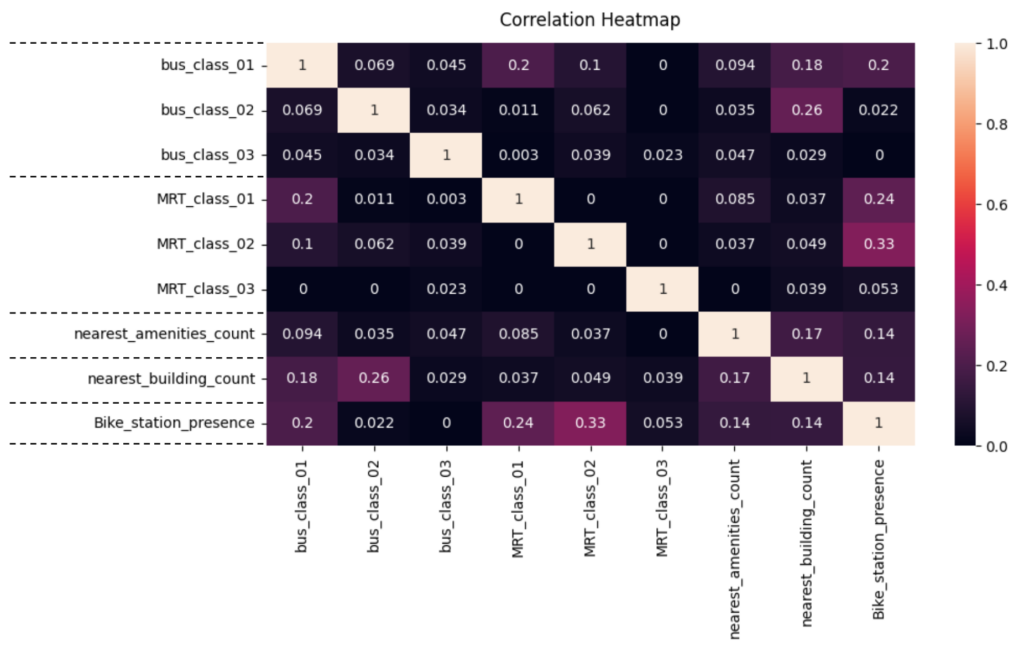
In the end we tested the correlation with features including both bus and MRT features and the score indeed got much better so we proceed with edge classification
Define Class
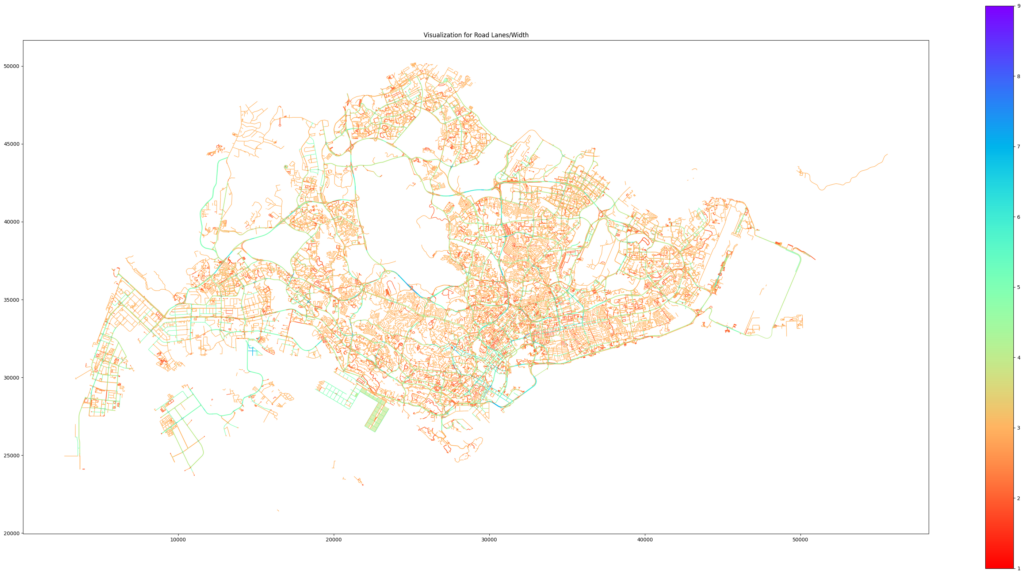
For existing bike route we can easily took existing data. However, for the non bike route we need to define by ourself.We took road jasonfile from next GIS. assume lane 0, 1, 8&9 will not become bike route, but we also exclude the edge which label path, residential and pedestrian
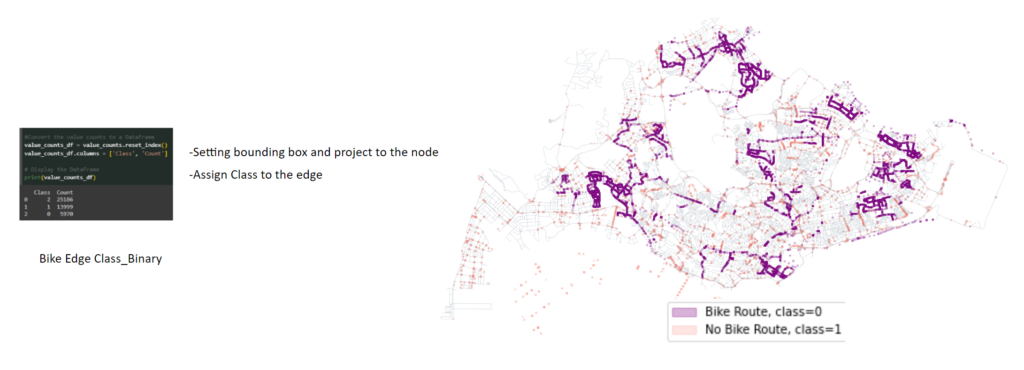
From these two data, we project the points to the node and further assign the class to the edge.
Features
Here we show the 3 finalizing features (using bounding box ).

Feature Visualization
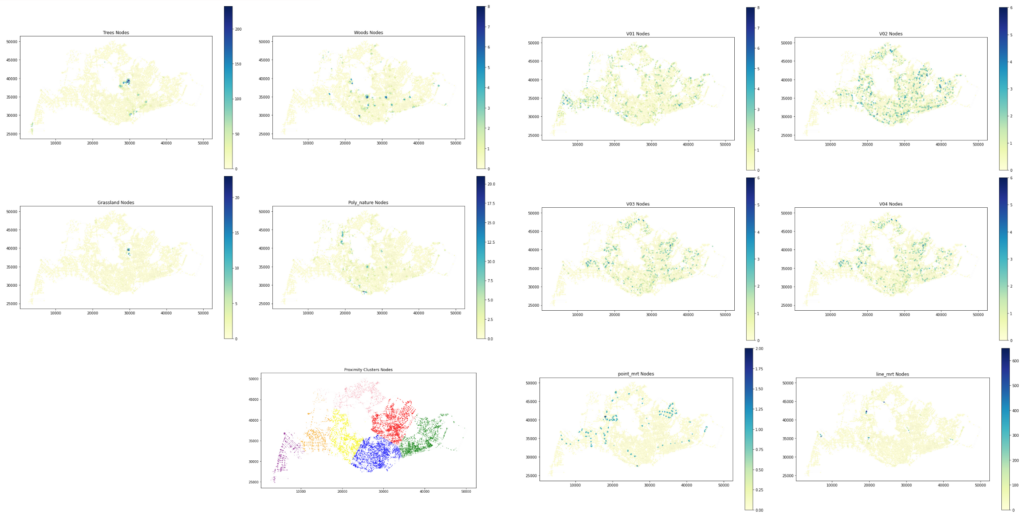
DGL Graph
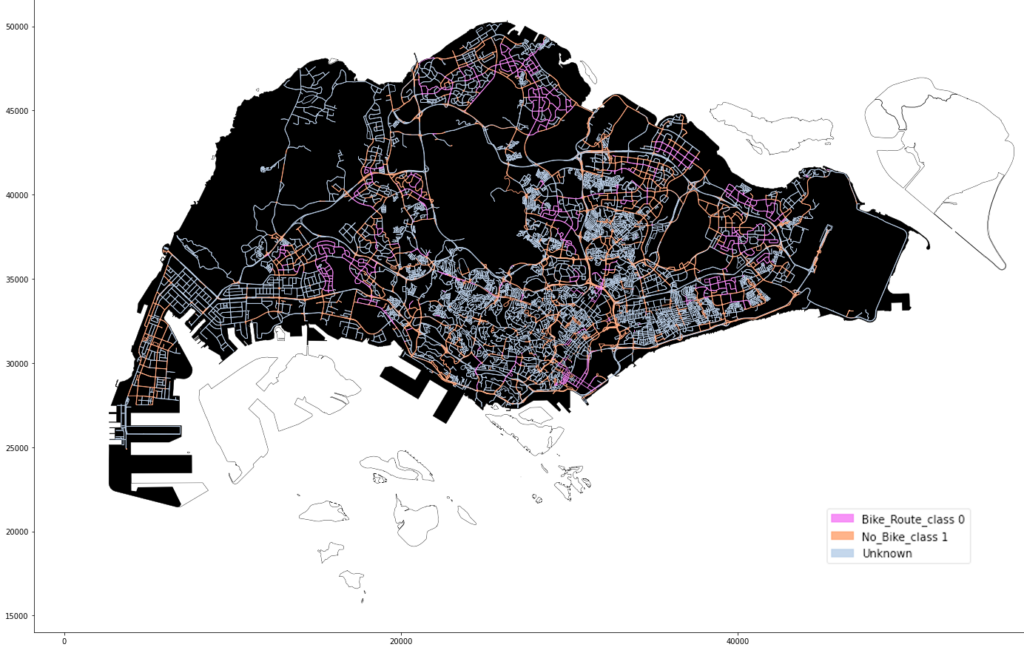
Here we see the drive road edge being divided into bike route, non bike route and unknown
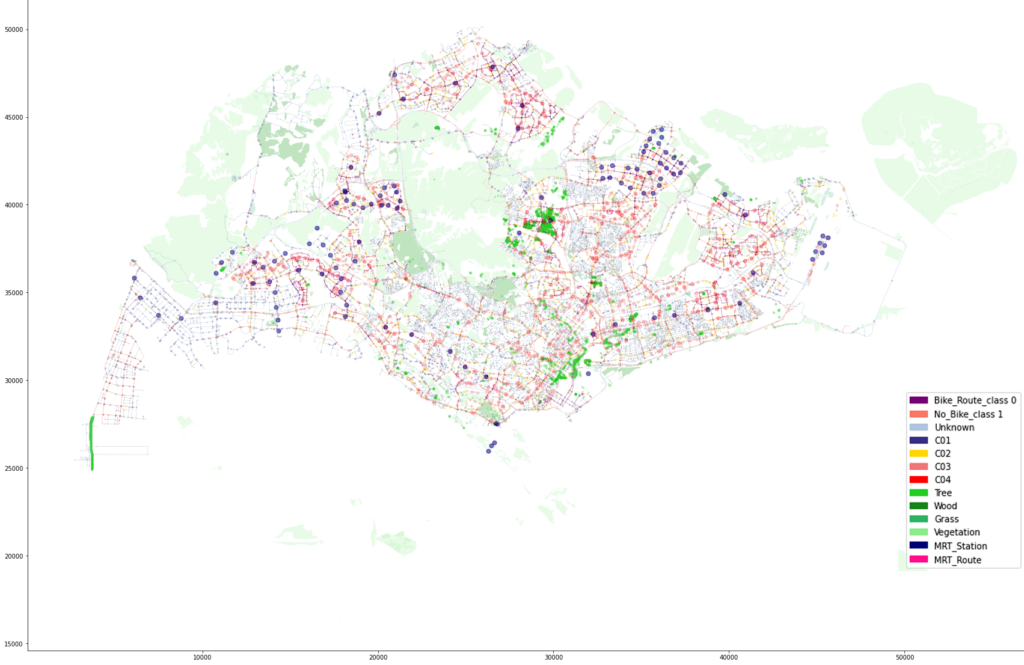
The second plot combines all the feature point together including greenery, bus stations and MRT stations
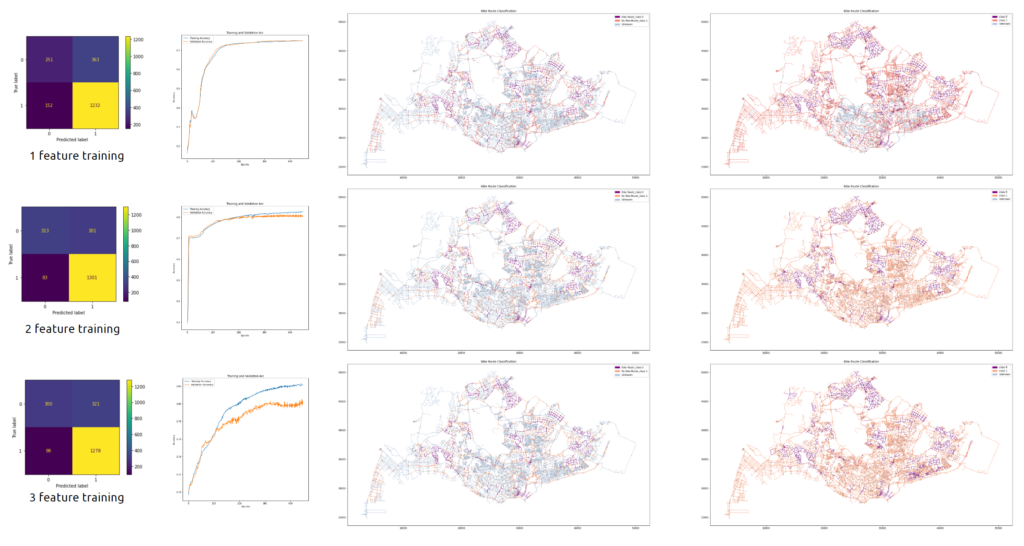
ML Results
We test the ML part by gradually adding features, and test with different hyperparameters however there is no great improvement or big difference between each other.
Summary
The development of a graph machine learning model to predict the existence of bike routes in Singapore faced several challenges and areas for potential improvement. limited data points may hinder the model’s ability to learn meaningful patterns. Feature selection and engineering posed another challenge, with the potential for irrelevant features to introduce noise and complex feature interactions not being captured adequately. Hyperparameter tuning was also essential, as suboptimal choices could lead to underperformance. The way the graph was constructed, including how nodes and edges were defined, significantly impacted the model’s learning capability, and sophisticated edge features were necessary to accurately represent bike routes.
To address these challenges, several improvements can be made. Advanced feature engineering, including better feature selection and creating interaction features, can improve model performance, incorporating detailed edge features like proximity to amenities and traffic data can better capture the relationships within the graph. Some of the ideas we wanted to implement included masking the data based on the planning districts and adding additional supporting datasets with traffic volume. Masking the data by planning districts could help in capturing region-specific patterns and variations, thereby enhancing the model’s ability to make accurate predictions within different contexts. These enhancements aim to improve the model’s performance by providing richer and more contextually relevant information.
