
Introduction
In recent decades, the importance of urban green spaces and their potential impact on various aspects of urban life has gained significant attention from policymakers, urban planners, and researchers worldwide. The creation and maintenance of green spaces within urban environments have been associated with numerous benefits, including environmental sustainability, physical and mental health improvements, social cohesion, and economic development.
Colombia, like many other rapidly urbanizing countries, faces significant challenges related to urbanization, including issues of poverty and inequality. Medellin, the second-largest city in Colombia, exemplifies this urban transition, experiencing both rapid urban growth and persistent socio-economic disparities. As such, understanding the relationship between green spaces and poverty in the context of Medellin is of paramount importance for urban planning and development efforts aimed at fostering more equitable and sustainable cities.
This study aims to investigate the correlation between the availability of green and public spaces and poverty levels in Medellin, Colombia. By examining the spatial distribution of green spaces and socio-economic indicators across different neighborhoods in Medellin, the project seeks to illustrate if access to green spaces is associated with poverty rates and socio-economic conditions. Furthermore, by employing statistical analysis techniques, the project aims to quantify the strength and direction of this relationship, providing evidence to inform urban planning policies and interventions.
Richer and greener: why are wealthy neighborhoods historically greener?
Multiple reasons explain the global correlation between wealthier neighborhoods and the presence of vegetation:
- Historical development patterns often favor wealthier neighborhoods, leading to disparities in green space allocation.
- Public investment and maintenance tend to be higher in wealthier neighborhoods. Wealthier neighborhoods often have more political influence and resources to advocate for public investment in green spaces and their maintenance.
- Property and land values incentivize developers to create green spaces in affluent neighborhoods. Developers may prioritize the creation of green spaces in areas with higher property values, catering to wealthier residents who can afford premium housing in these neighborhoods.
Medellín: The city of Eternal Spring
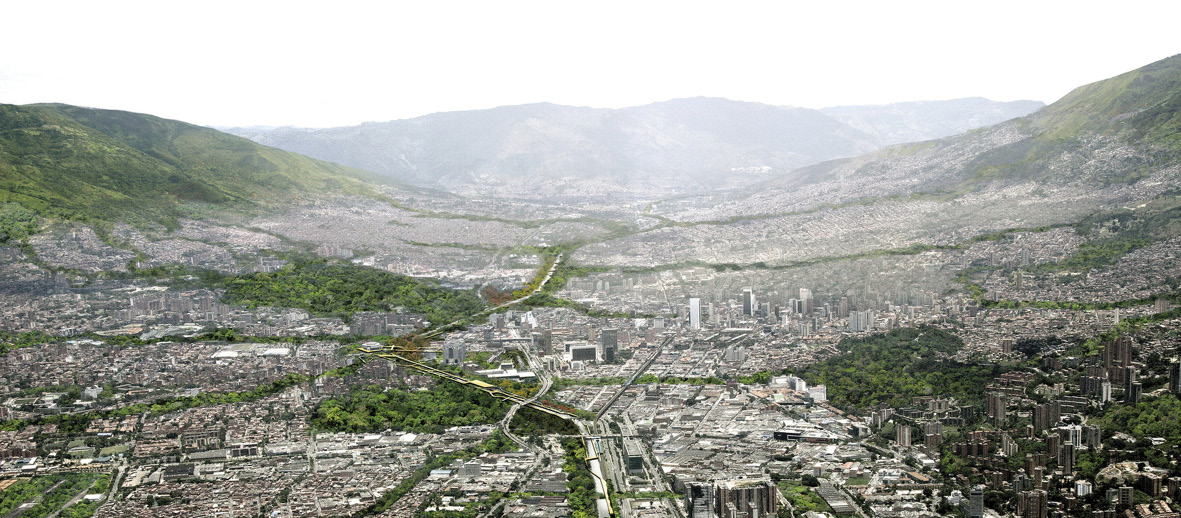
Nicknamed “The City of Eternal Spring,” Medellín enjoys a year-round temperate climate thanks to its unique location. Found in the Aburra Valley, a lush basin surrounded by mountains, the city experiences consistent warmth with average temperatures of 27°C all year.
The initial settlements of the city occurred on the valley floor near the Medellín River, but as the city grew, it climbed the surrounding mountainsides. Additionally, in the past decades, residents seeking job opportunities, affordable housing, and escaping the armed conflict have established informal settlements on the steep slopes of the mountains, increasing the ongoing challenges of equitable development and urban growth.
Methodology & Development
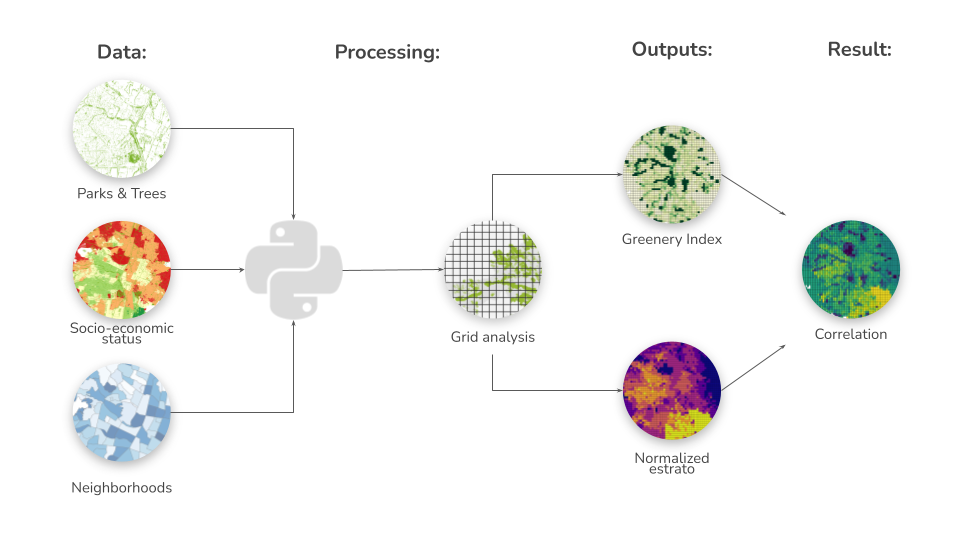
The methodology for this study involves using Python techniques to analyze the spatial distribution of urban green spaces within Medellin, Colombia. Shapefiles containing data on urban trees and public parks were acquired and processed using the Geopandas library. A spatial index indicating the degree of urban greenness was calculated and mapped across different neighborhoods. Socioeconomic data, encompassing variables such as poverty rates and income levels, were obtained and spatially correlated with the greenness index. Finally, an analysis was conducted to assess the relationship between urban greenness and socioeconomic conditions within Medellín.
Vegetation Data:
The analyzed information corresponds to the Urban geolocated trees and public parks within the city. The shapefiles were obtained from AMVA (Area Metropolitana del Valle de Aburra)2 and The Metabolism of Cities Data Hub3.
For this information, the initial process involved several steps:
- Data Acquisition: The relevant shapefiles containing the geospatial information were acquired.
- Coordinate System Alignment: As shapefiles can have different coordinate reference systems (CRS), the data underwent a transformation to a consistent CRS. This ensures accurate spatial analysis by guaranteeing all features use the same frame of reference.
- Clipping and Filtering: Medellín is organized territorially by 16 communes in the urban area and 5 townships in the rural area. For this exercise, only the urban area is going to be taken into account. The information was filtered and processed to isolate the city’s urban area, as this is the zone of interest.
By following these steps, the geospatial data was effectively prepared for further analysis, guaranteeing the focus remained on the urban core of the city.
Socio-Economic Data – Estratos:
Socioeconomic stratification in Colombia refers to the classification of residential properties that must receive public services based on income, access to services, and living conditions, which range from 1 to 6 (6 being the overall better conditions). For the exercise, a shapefile containing information about socio-economic status for plots in the city was acquired from Geomedellin4.
For this information, the initial processing involved the previous described steps, and additionally, the data was normalized and read through the previously created grid:
Data Standardization: Following the clipping process, the data within the urban area underwent a process of normalization, where the values were adjusted to fall within a range from 0 to 1. This step is crucial because it ensures different features within the dataset are comparable during analysis.
Processing:
- Grid Creation: A grid with cell sizes of 200 meters by 200 meters was established across the urban area of interest. This grid serves as a framework for spatial analysis.
- Vegetation Assessment: The vegetation data, specifically tree count, was then analyzed on a cell-by-cell basis within the grid. This allows us to understand the spatial distribution of trees across the city.
- Green Space Scoring: To create a more comprehensive measure of green space quality, a scoring system was developed for each grid cell. This score ranged from 0 to 1, with 1 representing the most favorable conditions and 0 indicating a lack of greenery. The scoring system factored in the presence of public parks within the cell, along with the number of trees counted. This combined metric provides a more detailed understanding of green space accessibility spatially.
- Socioeconomic Integration: Socioeconomic data was incorporated into the analysis. The mean estrato value was calculated for each grid cell. By including this data layer, the analysis could explore potential correlations between green space quality and socioeconomic factors.
By employing this grid-based approach with a focus on both green space and socioeconomic data, the analysis could investigate how these green spaces are distributed across the city’s socioeconomic spectrum. This allows for a more comprehensive understanding of potential inequalities in green space accessibility within Medellin’s urban center.


Analysis
The comparison between the two variables involved the following steps:

- Data Integration: Two sets of scores are assigned to each grid cell:
- Environmental Score (y): This ranges from 0 (poor) to 1 (excellent) and reflects the quality of green space, likely considering factors like public park presence and tree count.
- Socioeconomic Score (x): This also ranges from 0 (poor) to 1 and represents the socioeconomic status of the area, based on the estrato information (with higher estratos indicating higher socioeconomic levels).
- Calculating the Difference: To understand the relationship between these two factors, the difference between the scores is calculated:
f(x, y) = x - y. This difference score can range from -1 to 1.- Positive Difference (0 < x – y < 1): This indicates a grid cell where the socioeconomic score (x) is higher than the environmental score (y). In simpler terms, this suggests a relatively wealthy area (high socioeconomic score) that might lack access to good quality green spaces (lower environmental score).
- Negative Difference (-1 < x – y < 0): This indicates the opposite scenario – a grid cell with a lower socioeconomic score (x) but a higher environmental score (y). This suggests a less wealthy area that might have better access to quality green spaces.
- Zero Difference (x – y = 0): This indicates a grid cell where the socioeconomic and environmental scores are equal. This could represent an area with good balance between socioeconomic status and access to green space.
By analyzing the distribution of these difference scores across the city, valuable insights can be gained. For example, a high concentration of positive difference scores in a particular area might suggest a pattern of environmental inequality, where wealthier areas have less access to quality green spaces compared to lower-income areas. This information can be crucial for informing urban planning decisions that promote a more equitable distribution of green spaces throughout the city.
Results
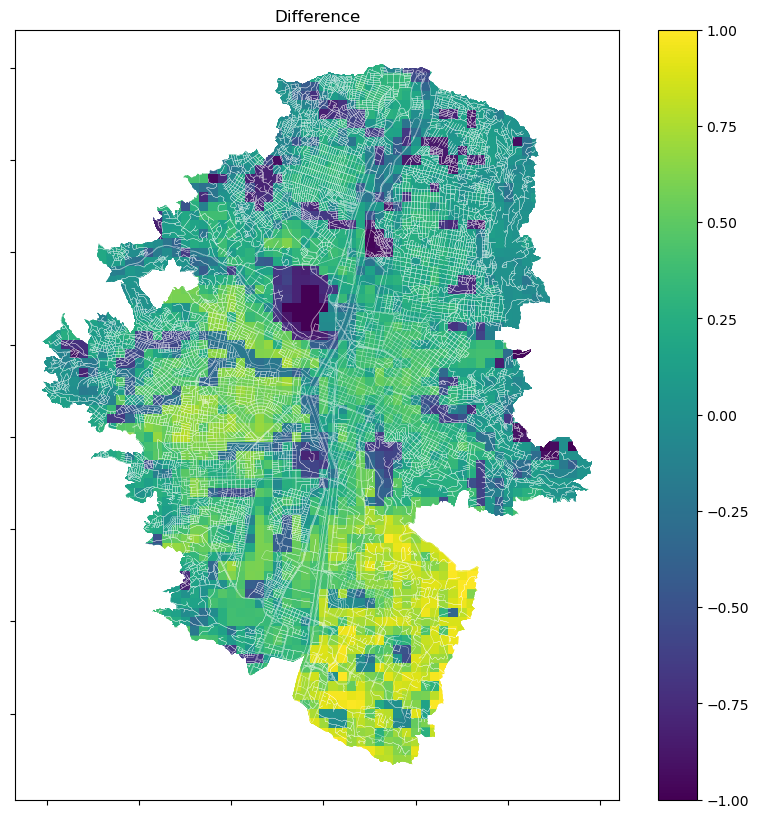
Unequal Distribution: Green Space and Socioeconomic Conditions
The spatial analysis of the difference scores revealed some two clear spatial patterns:
- Peripheries: Most of the peripheries showcase difference scores close to zero (low socioeconomic score, low environmental score), which corresponds to the mountainous regions. These areas often coincide with the locations of illegal settlements. This lack of both green space and good socioeconomic conditions can be attributed to the unplanned nature of these settlements:
- Non-planned Growth: Informal settlements typically arise organically, driven by the need for affordable housing. This growth bypasses formal urban planning processes, leading to a lack of designated green spaces and infrastructure development.
- Limited Space: Residents in these settlements prioritize maximizing their limited space for basic needs like housing. This can leave little room for incorporating green spaces within the settlements themselves.

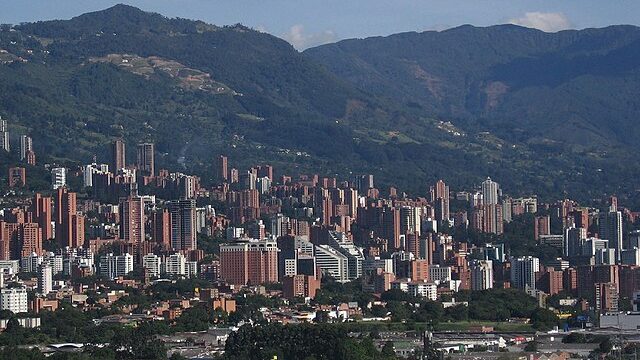
- Southern Medellin: The southern region of the city holds a concentration of high difference scores (high socioeconomic score, low environmental score). This suggests areas with higher socioeconomic status but limited access to green spaces. This pattern likely reflects the rapid urban development in this region and the continuous construction of highrises, which might be outpacing the creation of green spaces.
Conclusion
This analysis of Medellin’s green spaces and their connection to socioeconomic conditions reveals a complex interplay between development, environment, and social equity. This study suggests that the presence or absence of greenery in Medellin is more strongly linked to rapid urban growth patterns than solely to socioeconomic factors. The challenges faced by informal settlements, often lacking green space due to unplanned development, exemplify this connection. Additionally, the southern anomaly, where wealthy areas with limited green space exist due to rapid high-rise construction, further supports this notion.
These insights can serve as a valuable resource for urban planners and policymakers in Medellin. By understanding these spatial relationships, they can develop strategies for a more equitable distribution of green spaces throughout the city and policies for development projects’ licenses. This might involve incorporating green infrastructure into existing informal settlements, promoting green corridors and parks in developing areas, and ensuring that future urban planning prioritizes both economic growth and environmental well-being for all residents. Ultimately, the goal is to ensure that Medellin, the City of Eternal Spring, can truly offer its biodiversity to all its citizens, regardless of socioeconomic background.
It is, however, important to acknowledge that this study serves as an initial approach. For a more comprehensive understanding, further research with finer-grained data analysis could be beneficial. Additionally, incorporating other relevant variables, such as access to public transportation, air quality, and noise pollution, could provide a more holistic picture of how urban planning decisions impact the well-being of residents across the socioeconomic spectrum.
Sources
- Parques del Rio Medellin. (2016). Plataforma Urbana. https://www.plataformaurbana.cl/archive/2016/08/19/7-ciudades-que-estan-transformando-sus-rios-en-nuevos-atractivos-urbanos/parques-del-rio-medellin/
- Portal de Datos Abiertos del Área Metropolitana del Valle de Aburrá. (2024). Metropol.gov.co. https://datosabiertos.metropol.gov.co/search/?theme=Medio%20Ambiente
- Comunas y Corregimientos de Medellín | Metabolism of Cities Data Hub. (2021). Metabolismofcities.org. https://data.metabolismofcities.org/library/35283/
- Geomedellín. (2024). Medellin.gov.co. https://www.medellin.gov.co/geomedellin/datosAbiertos/396
